February 2, 2007
Slower-than-expected January job gains, but recent months revised up
By Jared Bernstein with research assistance from James Lin
The nation’s payrolls grew by 111,000 last month, and unemployment ticked up slightly as the job market turned in a weaker performance than expected, according to today’s report from the Bureau of Labor Statistics. Average weekly hours also slid, as did factory work and jobs in home construction.
Extensive revisions in today’s release, however, reveal faster job growth than was previously reported in prior months. In 2006, for example, employment grew by 2.2 million, 405,000 more than was reported last month. Over the course of the full recovery (beginning November 2001), payrolls added about one million more jobs than were originally reported. Yet even with these additions, the overall jobs recovery still remains weak in historical terms, with jobs growing at half the rate of the 1990s recovery (4.9% vs. 10%).
While January’s job gains were lower than expected, averaging over the past few months reveals a solid underlying trend of job growth. In the past three months, employment is up 171,000 per month, on average, and over the past year average monthly gains were about 180,000. These steady gains have helped to tighten the job market, leading to stronger wage growth over the past year.
Despite these positive underlying trends, a few sectors continue to lag the recovery. Even with the improving trade balance reported in last year’s fourth quarter, manufacturing continues its sharp decline. Factory jobs were down 16,000 last month and 110,000 over the past year. January’s losses were concentrated among auto workers, which were down 22,500.
Note that net losses in auto manufacturing have occurred exclusively among blue-collar (production) workers. Over the past year, the sector cut 80,000 production jobs. This loss slightly exceeds the overall 77,000 job decline, suggesting a shift in the composition of employment toward white-collar workers within the industry, a pattern consistent with the offshoring of production work.
The other consistent negative trend is in the area of residential housing jobs, reflecting the ongoing housing slump. Residential building and contracting was down 11,400 jobs last month, and the two sectors have lost 110,000 jobs since last spring. Business construction, however, more than offset these losses, and overall, construction added 22,000 to job growth in January.
The industries that grew last month included the usual suspects in the service sector. Health care, business services, and food services were major contributors, along with local government.
However, even these industries turned in weaker gains than in prior months, leading to the disappointing overall gain of just 111,000. Average weekly hours slipped by one-tenth of an hour, driven by larger cutbacks in manufacturing hours, including overtime. The decline in hours translated into a slight loss in weekly earnings, while average hourly earnings were up 0.2%, the slowest monthly growth rate since September 2006. Over the year, hourly earnings were up 4.0%, off last month’s pace of 4.3%, underscoring the lack of inflationary pressure from labor costs.
Is today’s weaker-than-expected report a signal of a downshift in what has been a gradually strengthening job market? Other economic indicators suggest that this is unlikely. Overall economic growth was solid in the fourth quarter (real GDP up 3.5%), and productivity growth has slowed, suggesting that unless demand stumbles—which the housing slump hints is possible—employers will still need to add workers at a good clip in coming months.
According to the Household Survey, the African American unemployment rate slipped to 8.0% in January, its lowest rate since July 2001. While this indicator has been quite volatile in recent months, it is on a clear downward trend. Over the past year, the black jobless rate is down almost a point, and the employment rate (the share of African Americans with jobs) is up 1.7 points, compared to a gain of 0.4 points in the overall employment rate. This boost that minority workers have gotten from the tightening job market helps reverse their disproportionate losses during the recession and jobless recovery.
Today’s release incorporates the annual benchmark revision wherein the BLS adjusts its payroll data based on more complete information about job growth. The revision increased the level of jobs last March (the month by which the revised data are phased into the survey) by 752,000, a historically large upward revision. As noted above, while this addition obviously improves the recent jobs record, it does not alter the uniquely weak historical performance over the current recovery.
The Household Survey was also revised to reflect changes in population estimates. While the Bureau does not incorporate these revisions into earlier data, they do provide a historically consistent series of labor force growth, one that incorporates all recent changes to population estimates.
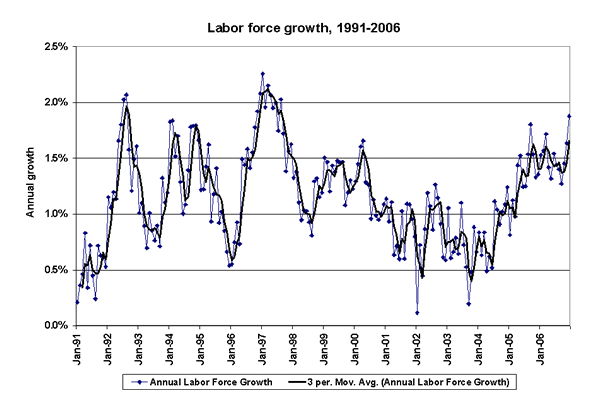
The chart below shows yearly growth in the labor force (along with a moving average to bring out the underlying trend). What is important to note here is that labor force growth has accelerated in recent months, and is again growing relatively quickly, at about the same rate as in 2000 (around the last business-cycle peak). This acceleration belies an oft-repeated claim that labor force growth underwent a structural downshift in the 2000s, with various groups supposedly opting to leave the job market for non-economic reasons.

This acceleration is an important reminder that the job market is not as supply-constrained as claims of structural downshifting would suggest. Instead, it appears that working-age persons are responding to the improving job market by “getting into the game” now that the opportunities are out there.
To view archived editions of JOBS PICTURE, click here.
The Economic Policy Institute JOBS PICTURE is published each month upon release of the Bureau of Labor Statistics’ employment report.
EPI offers same-day analysis of income, price, employment, and other economic data released by U.S. government agencies. For more information, contact EPI at 202-775-8810.
