March 5, 2004
Persistently weak job growth leads to labor force contraction
The nation’s job market was far weaker than expected last month, according to today’s report from the Bureau of Labor Statistics (BLS). Payrolls expanded by a mere 21,000, but even this amount was fully accounted for by government hiring. Private-sector employment was unchanged in February, the first such month since private-sector hiring picked up last September. The persistently weak labor market continues to take a toll on wage growth, with hourly wages up only 1.6% over the past year—the weakest growth rate since 1986.
In a sign that employers continue to be extremely reticent about committing to permanent hires, February’s payroll gains were more than explained by the addition of 32,000 temporary jobs. Most other sectors showed small gains or losses, including manufacturing, which shed 3,000 jobs. While this is the 43rd consecutive month of employment contraction in the nation’s factories, the loss of 3,000 jobs is the smallest reduction in any of those months.
A particularly notable aspect of the weak labor market is the declining trend in the share of the population in the labor force, i.e., the share of persons either working or seeking work. While February’s unemployment rate was unchanged at 5.6%, this reflects the fact that the number of labor force participants fell steeply last month, by 392,000, presumably due to the lack of available jobs. Employment in the survey that measures joblessness was also down last month, by 265,000. See JobWatch.org for an analysis of the impact of this trend on unemployment rates of various groups of workers.
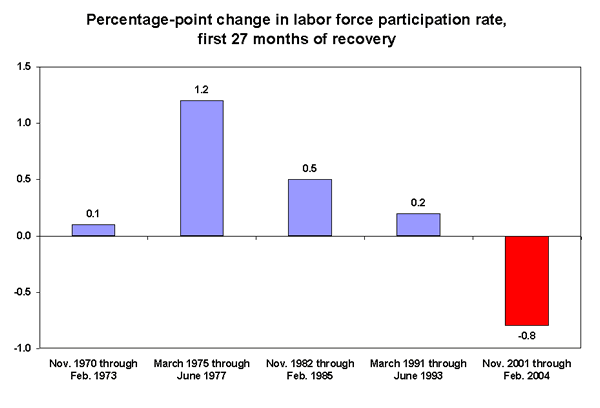
Though monthly labor force counts are volatile, the trend in the share of the population either working or seeking work has been consistently trending downward. Since last July, the labor force has contracted in six out of eight months, and last month’s participation rate of 65.9% was the lowest since September 1988. This rate is down 1.2 percentage points since the recession began in March 2001, with one-third of that decline occurring over the recovery.
The figure contrasts this pattern with past recoveries by showing the percentage-point change in labor force participation rates over the first 27 months of the last four recoveries. Only the current recovery shows a decline in the rate of labor force participation.

For minorities, the declines in participation rates are much larger: down 2.7 points for Hispanics and 2.6 points for African-Americans, with African-American men exhibiting a decline of -3.2 points. Interestingly, participation rate declines are larger for the more highly educated, underscoring the difficult job market for college graduates. Their labor force participation rate last month was 77.7%, down 1.6 points since the recession and the lowest level on record since BLS began publishing this series in 1994.
Another indication that the labor force is far weaker than suggested by the 5.6% unemployment rate is the high level of long-term unemployment. The average unemployment spell is now lasting more than four-and-a-half months (20.3 weeks), just slightly below the highest level in two decades—20.4 weeks—posted in January 1984, when the unemployment rate was 8%.
As noted, outside of temporary help, no sectors in the private workforce had substantial gains last month. In fact, over the course of the recovery, temporary work has posted the fastest pace of job growth, increasing by 10.2% since November 2001. (Health care, another growth sector, grew a bit more than half that fast, at 5.4% over the same period.) The lack of growth in permanent employment provides a clear indication that employers remain reluctant to add permanent hires and are able to meet current levels of demand for their goods and services without adding many new employees.
The impact of the weak job market on wage growth was also evident in today’s BLS report. The 1.6% annual growth rate of the hourly wages of blue-collar workers in manufacturing and non-managers in services is tied with the lowest rate on record (posted in December 1986), going back to 1964. Even with low inflation rates running at about 2%, such slow wage growth means many workers are falling behind in real terms. This is an especially distressing fact given that productivity growth has been exceptionally strong in recent months.
These divergent trends of productivity and wage growth are among the more alarming symptoms of the persistently weak job recovery amidst strong overall economic growth. Clearly, the weakness in the labor market is preventing the gains of growth from being broadly shared with working families.
—Jared Bernstein
with research assistance by Yulia Fungard
For more information on February job and wage data, go to EPI’s web feature JobWatch.org.
To view archived editions of JOBS PICTURE, click here.
The Economic Policy Institute JOBS PICTURE is published each month upon release of the Bureau of Labor Statistics’ employment report.
EPI offers same-day analysis of income, price, employment, and other economic data released by U.S. government agencies. For more information, contact EPI at 202-775-8810.
