Issue Brief #321
An increase in the Illinois minimum wage would help working families hardest hit by the recession and provide a boost to the economy. During the 2011 legislative session, Illinois lawmakers introduced a measure to increase the state minimum wage across four years to $10.65 per hour, and a similar proposal is expected in the 2012 legislative session. Had it been enacted, S.B. 1565 (97th General Assembly, State of Illinois, 2011) would have given more than 1.1 million of the lowest-paid workers a raise, providing more than $3.8 billion in increased wages for directly affected workers.1
The Illinois minimum wage currently is $8.25 per hour. The legislation as proposed in 2011 would have gradually increased the minimum wage until it reached $10.65 in 2014. It would have increased to $8.90 in 2011, $9.50 in 2012, $10.15 in 2013, and $10.65 in 2014. After 2014, it would have maintained its value with increases tied to inflation. Amid persistent unemployment and the resulting downward pressure on wages, increasing the minimum wage for low-wage workers would be a welcome lift for the economy. An incremental increase also would help working families in Illinois make ends meet in the aftermath of the worst recession in generations.
Minimum-wage workers in Illinois
Contrary to popular misconception, workers who would be affected by an increase are generally not teenage part-timers—most are adults struggling in full-time jobs to support their families. An analysis of Current Population Survey data revealed characteristics of affected workers: 84.2 percent are at least 20 years old (only 6.6 percent are teenagers who work less than 20 hours per week); and about three-fifths (60.6 percent) have total family incomes of less than $45,000.2 More than a quarter (28.7 percent) of those who would be affected by an increase are parents supporting at least one child. An increase also would disproportionately benefit women, who, although comprising 47.4 percent3 of the workforce, make up 55.9 percent of workers who would experience a rise in pay; and racial and ethnic minorities, who, although comprising about a third (33.1 percent) of the workforce, make up more than two-fifths (41.3 percent) of affected workers.
A higher minimum wage as a boost to living standards
Illinois workers who would benefit from an increase in the minimum wage are mainly adults whose families rely heavily on the incomes of minimum-wage workers to pay the bills. Workers who would be affected by an increase in the Illinois minimum wage share the same characteristics as workers who would be affected by a proposed indexing of the federal minimum wage, the latter of whom were the subject of a 2009 EPI study (Shierholz 2009). According to that study, families of affected workers, on average, rely on minimum-wage workers for nearly half (45.9 percent) of their income, not far behind the share (60.4 percent) of income contributed by the average worker. More than a quarter (26.0 percent) of families with minimum-wage workers have no other income.
The proposed gradual minimum-wage increase in Illinois across four years would help to reverse the trend of growing wage inequality that has occurred in the past 30 years. From 1973 to 2007, the real value of the federal minimum wage eroded, and working families’ incomes stagnated: The average real family income of the bottom 20 percent of the income distribution was almost flat, growing at an average annual rate of 0.1 percent per year (Shierholz 2009). Meanwhile, the middle 20 percent experienced 0.6 percent average annual income growth, and the top 20 percent saw 1.4 percent growth (Shierholz 2009). Illinois wage trends reflect national trends, with wages for the bottom 20th percentile and median wages essentially stagnant.4
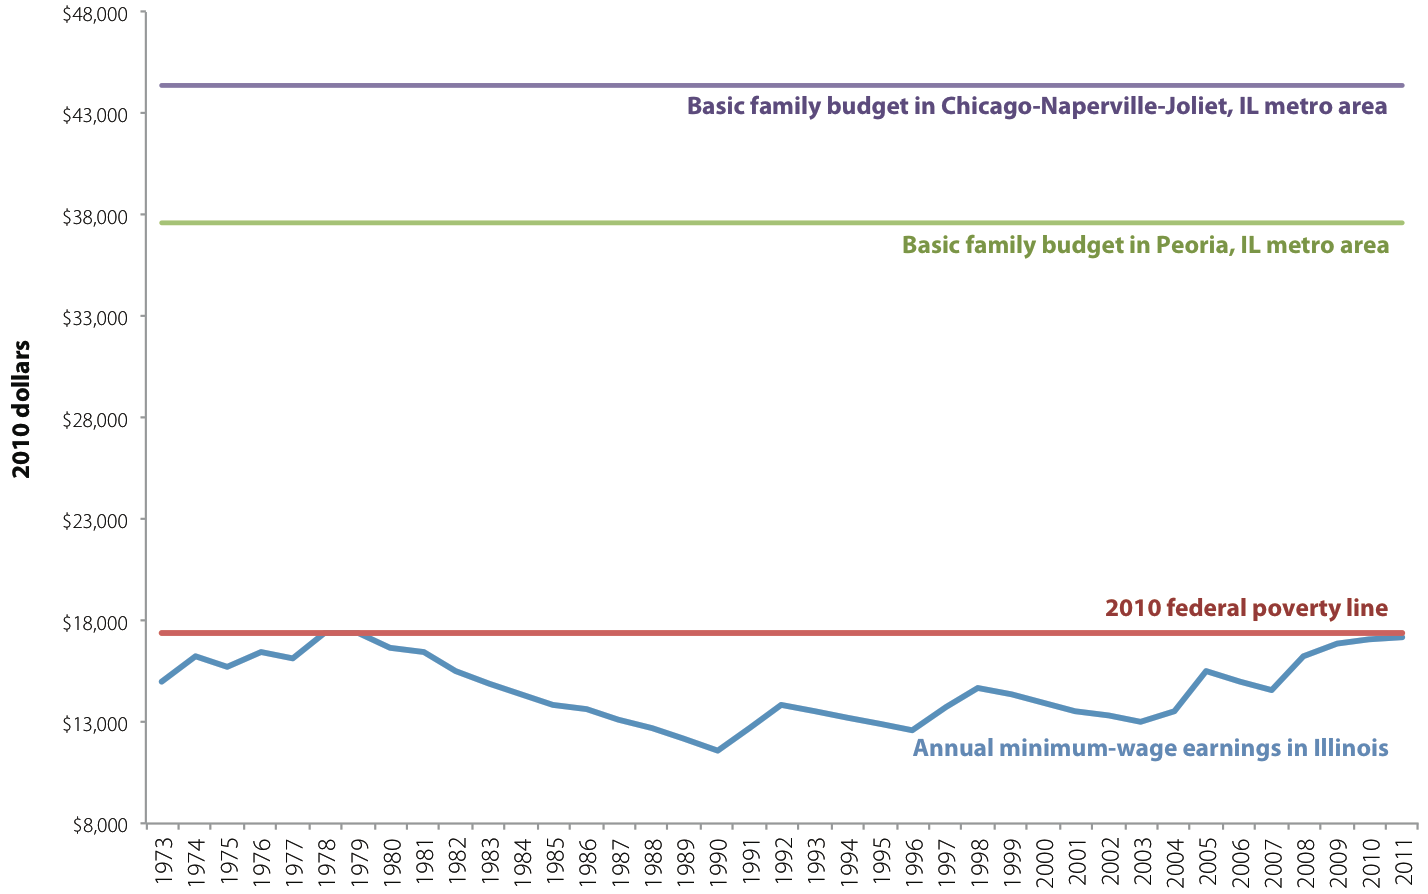
Research attributes much of the increase in economic inequality during the 1980s to the declining real value of the minimum wage (Autor, Katz, and Kearney 2008). Mirroring national trends, Figure A shows that the real value of the Illinois minimum wage for a full-time, full-year worker plummeted far below the poverty level for a family of three throughout the 1980s. Minimum-wage increases during the 2000s were insufficient to help exceed that poverty level. Figure A also reveals that the real value of the minimum wage was nowhere near the level necessary for a family of three to cover essentials, as measured by the Economic Policy Institute’s Family Budget Calculator.5 Returning the Illinois minimum wage to its pre-erosion level would help ensure the minimum wage serves its intended purpose—to set wage standards for the lowest-paid workers at a meaningfully high level, and support low-wage working families. Once Illinois restores the minimum wage to its pre-erosion level, the state should index it to inflation so that it never again strays from its original purpose as a basic protector of fair wages.
Minimum-wage increases and the absence
of negative employment effects
It is important to emphasize that minimum-wage increases do not have negative labor market effects. Contrary to opponents’ claims, raising the minimum wage does not cause job loss. Dube, Lester, and Reich (2010) conducted a study of employment levels in the hundreds of neighboring U.S. counties that straddle a border between states that had different minimum wage rates at any time between 1990 and 2006. Generalizing research by Card and Krueger (1994) that compared different minimum wages in New Jersey and Pennsylvania, this study’s focus on all county pairs that straddle a state border with different minimum-wage rates represented a significant improvement in methodology. Its findings revealed that minimum-wage increases did not cause job loss in the counties with higher minimum wages.
Even in periods of recession and high unemployment, minimum-wage increases do not cause job loss. A second, new study by Allegretto, Dube, and Reich (2011) finds that during recessionary periods in the past two decades—including the Great Recession of 2007–09, when Congress raised the federal minimum wage from $5.15 to $7.25—increases in the minimum wage did not cause employment declines. This study bolsters the cross-county study findings because it reveals that, even during economic downturns, raising the minimum wage does not cause job loss.
Annual minimum-wage earnings in Illinois relative to poverty level and basic-needs budget for a family of three, 1973–2011
Sources: EPI analysis of data from the U.S. Department of Labor (2010), U.S. Census Bureau (2011), and EPI’s Family Budget Calculator (http://www.epi.org/ resources/budget/)  |
Raising the minimum wage as a tool for economic growth
In Illinois and other states, minimum-wage increases will go further than merely not causing job loss: They will create jobs. Like unemployment insurance benefits or tax breaks for low- and middle-income workers, raising the minimum wage puts more money in the pockets of working families when they need it most and, in turn, augments their spending power in the local economy. Economists generally recognize that low-wage workers are more likely than any other income group to spend any extra earnings immediately on basic needs or services that they could not previously afford.
Increasing Illinois’ minimum wage to $10.65 across four years would give an additional $3.8 billion6 to directly affected families, who will, in turn, spend those extra earnings. Indirectly affected workers—those earning close to, but still above, the minimum wage—also are likely to receive a boost in earnings due to the “spillover” effect (Shierholz 2009). They too will have more to spend on necessities.
This projected rise in consumer spending due to a minimum-wage increase is critical to any recovery, especially when weak consumer demand is one of the most significant factors holding back new hiring.7 Though the stimulus from a minimum-wage increase is smaller than the boost created by, for example, unemployment insurance benefits, it is still substantial and has the crucial advantage of not imposing significant costs on state governments. Thus, a minimum-wage increase is one of the few budget-neutral job-creation strategies available to state governments struggling with budget shortfalls.8
Showing that raising the minimum wage is a job-creation tool requires an examination of the stimulative effects of minimum-wage increases. The minimum wage goes primarily to workers in low-income families who depend on those earnings to survive. They also are the most likely to have very little choice but to spend immediately any additional earnings they receive. Thus, increases in the minimum wage spur spending by the workers who get the raise, thereby boosting the economy.
Because minimum-wage increases come from employers, we must construct a “minimum-wage increase multiplier” that takes into account the increase in compensation to low-wage workers and the decrease in corporate profits that both occur as a result of minimum-wage increases. Raising the minimum wage essentially is a shift from corporate profits to low-wage workers’ earnings. Minimum-wage workers are more likely to spend that money immediately on goods and services in the economy than businesses are. Intuitively, raising the minimum wage means shifting profits from an entity (the employer) that is much less likely to spend immediately to one (the low-wage worker) that is more likely to spend immediately in the economy. Thus, increasing the minimum wage stimulates demand for goods and services, leading employers to bring on new staff to keep up with this increased demand.
When economists analyze the net economic stimulus effect of policy proposals (e.g., tax rate changes that boost income for some and reduce it for others), they use a set of widely accepted fiscal multipliers to calculate the total increase in economic activity due to a particular increase in spending. In applying these multipliers, economists generally recognize that a $115,000 increase in economic activity results in the creation of one new full-time equivalent job in the current economy.9
Using these same standard fiscal multipliers to analyze the jobs impact of an increase in compensation of low-wage workers and decrease in corporate profits that result from a minimum-wage increase, we find that increasing the minimum wage in Illinois to $10.65 across four years would result in a net increase in economic activity of approximately $2.5 billion and would generate approximately 20,000 new jobs (see Appendix for methodological details). Though this would not solve the unemployment crisis, it would be a substantial boost for the economy.
Examining the positive effects of a minimum-wage increase in Illinois leads to an overarching discussion of the economic case for increasing the earnings of the lowest-paid workers during a recession. In the current economic climate, everything is pushing against wage growth. With a queue of unemployed workers wrapping around the block for every job opening, employers do not have to offer substantial wage packages to hire the workers they need. If employers know that there are few jobs available, they do not have to pay substantial wage increases to keep workers.
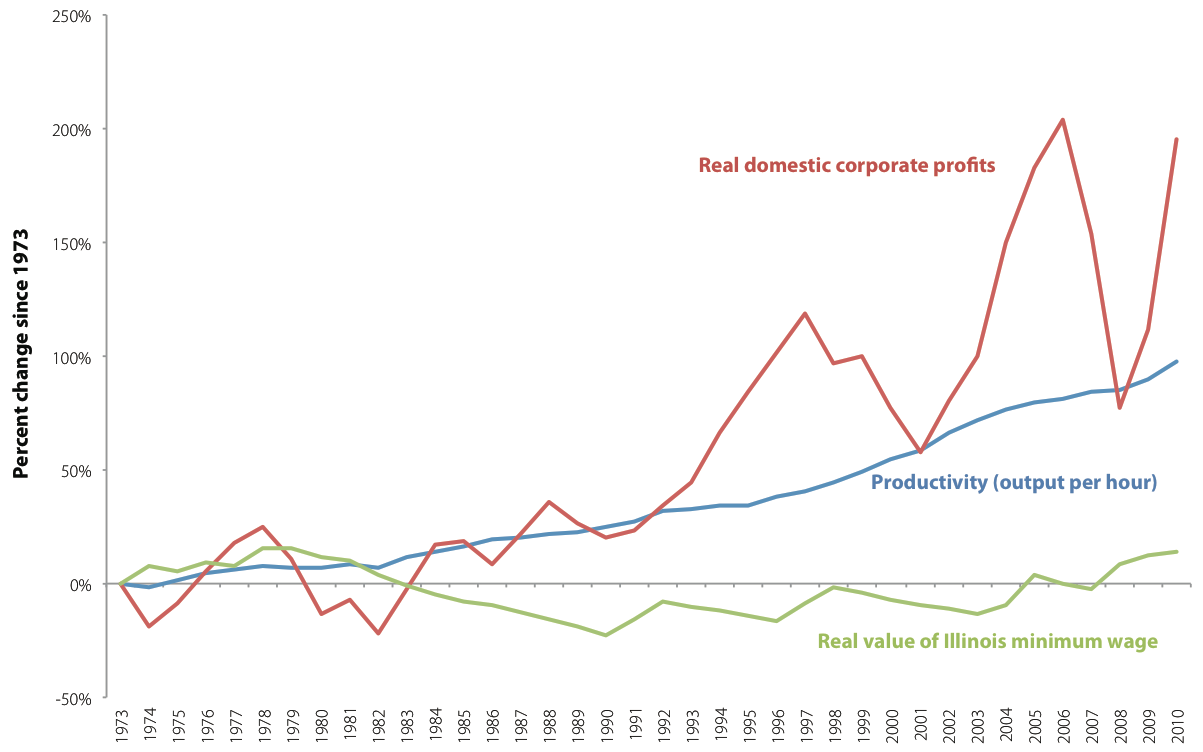
Corporations can afford to increase the wages of the lowest-paid workers. Since 1973, corporate profits have continued to soar as the American worker became more productive. Corporate America even has recovered the losses of the 2008 crash, with growth in profits returning once again to disproportionately higher rates than productivity and wages. Yet in Illinois and nationwide, workers did not share in this prosperity. Figure B reveals this disconnect—real corporate profits peaked in 2006 at more than 200 percent growth since 1973, while the real value of the Illinois minimum wage in 2010 was just 14 percent higher than it was in 1973. Meanwhile, workers’ productivity increased almost 100 percent during the same period. Raising the minimum wage in Illinois would help shift the pendulum, increasing workers’ earnings to reflect their increased productivity.
Change in productivity, corporate profits, and the Illinois minimum wage, 1973–2010
Sources: EPI analysis of data from the U.S. Department of Labor (2010), the Bureau of Labor Statistics (2011), and the Bureau of Economic Analysis (2011) |
Even conservative economists suggest higher wages might help speed the recovery. American Enterprise Institute scholar Desmond Lachman, a former managing director at Salomon Smith Barney, told the New York Times, “Corporations are taking huge advantage of the slack in the labor market—they are in a very strong position and workers are in a very weak position. They are using that bargaining power to cut benefits and wages, and to shorten hours.” According to Lachman, that strategy “very much jeopardizes our chances of experiencing a real recovery” (Powell 2011).
Figure B reveals that corporations were benefiting from the increased productivity of the American worker long before the recession—rising profits and productivity continue to contrast sharply with the stagnant real value of workers’ wages.
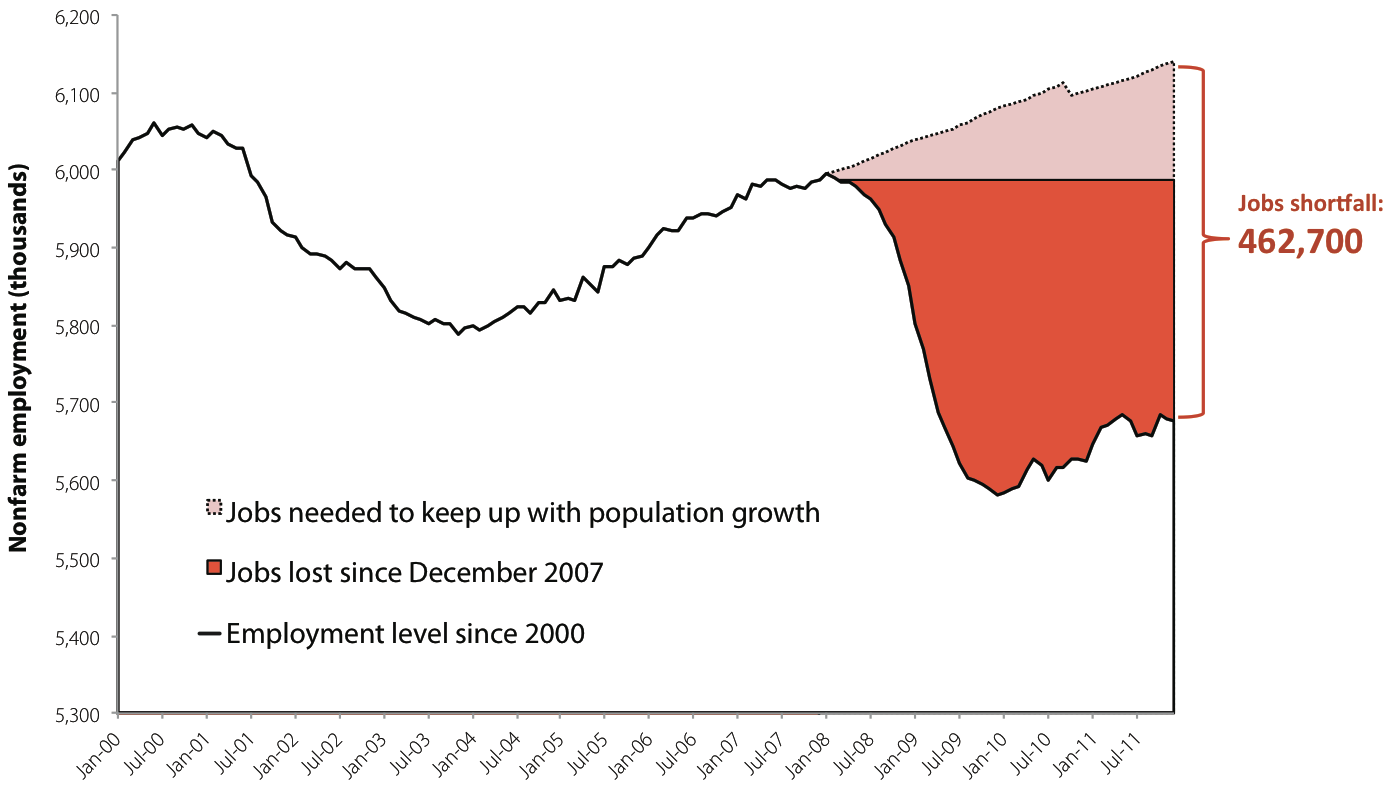
Furthermore, the unemployment rate nationally right now is 8.5 percent and not expected to return to the pre-recession level for at least another five years—and likely much longer. In Illinois, the unemployment rate is 9.8 percent and, as Figure C shows, the state’s “jobs shortfall,” or the difference between the number of jobs Illinois has and the number it needs to regain its pre-recession employment rate, is 462,700. That number includes the 310,200 jobs Illinois lost plus the 152,500 jobs it would have needed to add to keep up with the 2.5 percent growth in population the state has experienced in the 48 months since the recession began.10 (To close this gap within three years, Illinois would have to create 14,000 new jobs every month. In the past year, Illinois has added 52,600 jobs, enough to cover slightly less than four months’ worth of necessary growth. At that rate, it will take Illinois almost nine years to return to pre-recession unemployment levels. Considering that, in the past six months, Illinois has lost 1,200 jobs, a minimum-wage increase that creates 20,000 new jobs will improve the chance of achieving a recovery.)
The Illinois jobs shortfall January 2000–December 2011
Sources: Economic Policy Institute analysis of Bureau of Labor Statistics Current Population Survey, Current Employment Statistics, and Local Area Unemployment Statistics data |
The trifecta of persistently high unemployment, resulting lack of wage growth, and a severe jobs deficit in Illinois means there will be no upward pressure on wages for a very long time. Since raising the minimum wage helps working families, does not cause job loss, and is a boost to the economy, the current economic downturn is exactly the time to raise the minimum wage.
Conclusion
The multiple positive effects that would result from a higher minimum wage in Illinois are evident: boosting the earnings of working families hardest hit by the Great Recession, spurring economic growth, and creating more than 20,000 new jobs with no negative effects on employment. In the current economic climate, in which wage increases for the most vulnerable workers are scarce, raising the minimum wage to $10.65 across four years is an opportunity that working families in Illinois cannot afford to lose.
Appendix: Methodology
An analysis of the stimulative impact of raising the minimum wage in Illinois requires the use of macroeconomic multipliers from “Fiscal Stimulus Multipliers” (Zandi 2011), in which Zandi estimates the one-year dollar change in Gross Domestic Product (GDP) for a given dollar reduction in federal tax revenue or increase in spending. Averaging the stimulus multipliers of the Earned Income Tax Credit (within Recovery Act parameters) and Making Work Pay (the Recovery Act’s refundable tax credit for working individuals and families) gives a reasonable fiscal stimulus multiplier for the spending increase due to the increase in compensation of low-wage workers. This value is 1.2, which means that a $1 increase in compensation to low-wage workers leads to a $1.20 increase in economic activity.
The calculation of the stimulative impact of the minimum wage, however, must also account for the offsetting shift from employers. We assume employers pass on some of the minimum-wage increase to consumers through increased prices (somewhere between 50 percent and 20 percent). Thus, we calculate the offsetting multiplier effects as a weighted average of Zandi’s across-the-board tax cut (1.04, as a proxy for increased prices) and a cut in the corporate tax rate (0.32):
The minimum-wage multiplier is between:
1.2 MW consumer spending increase multiplier – [0.32 corporate tax rate cut*(1-0.5 price pass-through) + (1.04 across-the-board tax cut*0.5 price pass-through)] = 0.53
(representing the case where 50 percent of the minimum-wage increase is passed through to prices)
and
1.2 MW consumer spending increase multiplier – [0.32 corporate tax rate cut*(1-0.2 price pass-through) + (1.04 across-the-board tax cut*0.2 price pass-through] = 0.74
(representing the case where 20 percent of the minimum-wage increase is passed through to prices)
Taking into account the fiscal stimulus multiplier range of the minimum-wage increase (.53 to .74) and the increased wages (“wage bill increase”) of directly affected workers, we can calculate the GDP impact:
The GDP impact is between:
$3,837,083,877 wage bill increase*0.53 minimum-wage multiplier (low) = $2,014,468,773 GDP impact (low)
and
$3,837,083,877 wage bill increase*0.74 minimum-wage multiplier (high) =
$2,843,278,783 GDP impact (high)
We use the general rule that it takes a GDP increase of $115,000 to make one full-time equivalent (FTE) job and a GDP increase of $127,000 to create a payroll job. Then, calculating the impact of an increase in the Illinois minimum wage to $10.65 across four years, the number of FTE jobs created is between:
$2,014,468,773 GDP impact (low)/$115,000 GDP increase per FTE job = 17,517 FTE jobs
and
$2,843,278,783 GDP impact (high)/$115,000 GDP increase per FTE job = 24,724 FTE jobs.
Calculating the number of payroll jobs created is between:
$2,014,468,773 GDP impact (low)/$127,000 GDP increase per payroll job = 15,862 payroll jobs
and
$2,843,278,783 GDP impact (high)/$127,000 GDP increase per payroll job = 22,388 payroll jobs.
Full-time equivalent job measurements take into account both the increase in the number of payroll jobs and the increase in work hours for those who already had jobs by calculating the equivalent number of 40-hours-per-week jobs that would be created by the GDP boost. Measuring the number of payroll jobs strictly shows the number of jobs (not measured by hours). Thus, an increase in the minimum wage in Illinois to $10.65 across four years creates a conservative estimate of about 20,000 jobs (whether measuring FTE or payroll).
Endnotes
1. EPI analysis of 2010 Current Population Survey (CPS) Outgoing Rotations Group (ORG) data. EPI based this analysis on a 2011 legislative proposal in Illinois, S.B. 1565 (97th General Assembly State of Illinois, 2011).
2. EPI analysis of 2010 CPS ORG data for the proposed Illinois minimum-wage increase. Illinois data on minimum-wage worker characteristics reflect those of workers affected by a proposed indexing of the federal minimum wage nationwide (Shierholz 2009).
3. EPI analysis of 2010 American Community Survey data (series S0201).
4. EPI analysis of CPS ORG data from 1979 to 2010 from the Bureau of Labor Statistics.
5. EPI’s basic Family Budget Calculator compiles the costs of essentials, such as housing, food, child care, transportation, and health care, in different regions of the country to provide an estimate of how much families need to get by. Our analysis for a family of one parent and two children uses the Consumer Price Index Research Series using current methods (CPI-U-RS) to adjust the calculations for inflation. See EPI’s basic family budget calculator (http://www.epi.org/resources/budget/) and its technical documentation (Bernstein and Lin 2008).
6. Ibid. i. The EPI analysis assumes 0.4 percent population growth and 2.1 percent wage growth in Illinois per year. The increased wages are the annual amount of increased wages for directly affected workers, assuming they work 50 weeks per year.
7. In a recent poll of 53 economists by The Wall Street Journal, the majority (65 percent) cited a lack of demand as the main reason for a lack of new hiring by employers (Izzo 2011).
8. A recent analysis by the Center on Budget and Policy Priorities projects a $5.3 billion budget shortfall in Illinois in fiscal year 2012. At 16 percent of the general fund budget, this shortfall places Illinois 11th among all states and the District of Columbia as a share of state general fund budgets (McNichol et al. 2011).
9. In a paper on the methodology used to estimate the jobs impact of various policy changes, the Economic Policy Institute’s Josh Bivens finds that $115,000 in additional economic activity results in the creation of one new full-time equivalent job, and $127,000 in additional economic activity results in the creation of one new payroll job (Bivens 2011).
10. This calculation uses both CES (Current Employment Statistics) and LAUS (Local Area Unemployment Statistics) data from the Bureau of Labor Statistics, which provide an estimate similar to EPI’s national-level estimate of the jobs shortfall—combining CES and CPS (Current Population Survey) data. This estimate is based on the dates of the national recession, not individual state recessions, which vary state to state.
References
Allegretto, Sylvia, Arindrajit Dube, and Michael Reich. 2011. “Do Minimum Wages Really Reduce Teen Employment? Accounting for Heterogeneity and Selectivity in State Panel Data.” Industrial Relations, vol. 50, no. 2. www.irle.berkeley.edu/workingpapers/166-08.pdf
Autor, David H., Lawrence F. Katz, and Melissa S. Kearney. 2008. “Trends in U.S. wage inequality: Revising the revisionists.” Review of Economics and Statistics, vol. 90, no. 2, pp. 300–23.
Bernstein, Jared, and James Lin. 2008. “2008 Economic Policy Institute Family Budgets Technical Documentation.” Washington, D.C.: Economic Policy Institute. http://www.epi.org/page/-/old/datazone/fambud/2008_epi_family_budgets_tech_doc.pdf
Bivens, Josh L. 2011. Method memo on estimating the jobs impact of various policy changes. Washington, D.C.: Economic Policy Institute.
Bureau of Economic Analysis (U.S. Department of Commerce). 2011. National Income and Product Accounts Tables, Tables 6.16B, 6.16C, and 6.16D, “Corporate Profits by Industry,” selected years, Excel spreadsheets accessed October. http://www.bea.gov/iTable/iTable.cfm?ReqID=9&step=1
Bureau of Labor Statistics (U.S. Department of Labor). 2011. Data, Tables & Calculators by Subject, “Major Sector Productivity and Costs,” selected years, Excel spreadsheets accessed October. http://data.bls.gov/timeseries/PRS85006092
Card, David, and Alan B. Krueger. 1994. “Minimum wages and employment: A case study of the fast food industry in New Jersey and Pennsylvania.” American Economic Review, vol. 84, no. 5, pp. 772-93.
Dube, Arindrajit, William Lester, and Michael Reich. 2010. “Minimum Wage Effects across State Borders: Estimating Using Contiguous Counties.” Institute for Research on Labor and Employment Working Paper 157-07. Berkeley, Calif.: University of California. www.irle.berkeley.edu/workingpapers/157-07.pdf
Economic Policy Institute. 2007 (updated to 2011). “Basic Family Budget Calculator” tool on the EPI website. http://www.epi.org/resources/budget/
Izzo, Phil. 2011. “Dearth of Demand Seen behind Weak Hiring.” The Wall Street Journal, July 18.
McNichol, Elizabeth, Phil Oliff, and Nicholas Johnson. 2011. “States Continue to Feel Recession’s Impact.” Washington, D.C.: Center on Budget and Policy Priorities.
97th General Assembly, State of Illinois. 2011. S.B. 1565. http://www.ilga.gov/legislation/fulltext.asp?DocName=&SessionId=84&GA=97&DocTypeId=SB&DocNum=1565&GAID=11&LegID=57471&SpecSess=&Session=
Powell, Michael. 2011. “Corporate Profits Are Booming. Why Aren’t the Jobs?” New York Times, January 8.
Shierholz, Heidi. 2009. Fix it and Forget It: Index the Minimum Wage to Growth in Average Wages. Economic Policy Institute Briefing Paper #251. Washington, D.C.: Economic Policy Institute.
U.S. Census Bureau. 2011. Poverty Data, “Poverty Thresholds for 2010 by Size of Family and Number of Related Children Under 18 Years,” Excel spreadsheet last revised September 13. www.census.gov/hhes/www/poverty/data/threshld/thresh10.xls
U.S. Department of Labor. 2010. State Labor Laws Historical Tables, “Changes in basic minimum wages in non-farm employment under state law: selected years 1968–2011,” last revised December. http://www.dol.gov/whd/state/stateMinWageHis.htm
Zandi, Mark. 2011. “At Last, the U.S. Begins a Serious Fiscal Debate.” Moody’s Analytics’ Dismal Scientist website. http://www.economy.com/dismal/article_free.asp?cid=198972&tid=F0851CC1-F571-48DE-A136-B2F622EF6FA4