Rising wage inequality and slow and uneven growth in real (inflation-adjusted) hourly wages for the vast majority of workers have been defining features of the U.S. labor market for most of the last 40 or so years. In only about 10 years since 1979 did most workers see any consistent positive wage growth: in the tight labor market of the late 1990s and in the five years leading up to the pre-pandemic labor market peak in 2019. Some low-wage workers have experienced disproportionate wage gains in the current business cycle—gains that even beat out high inflation.
However, the latest data on annual earnings from the Social Security Administration show that the very top continues to pull away and amass a larger share of the earnings pie, while the bottom 90% continues to fall further behind.
In 2021, annual wages rose fastest for the top 1% of earners (up 9.4%) and top 0.1% (up 18.5%), while those in the bottom 90% saw their real earnings fall 0.2% between 2020 and 2021. Workers in the 90th–99th percentile of the earnings distribution also experienced real losses in 2021.
The top 1% earned 14.6% of all wages in 2021—twice as high as their 7.3% share in 1979. The bottom 90% received just 58.6% of all wages in 2021, the lowest share on record, and far lower than their 69.8% share in 1979.
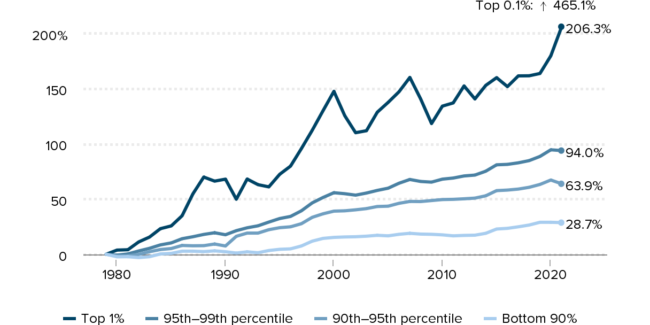
From 1979 to 2021, wages for the top 1% and top 0.1% skyrocketed by 206.3% and 465.1%, respectively, while wages for the bottom 90% grew just 28.7%. On an annualized basis, bottom 90% wages grew only 0.6% per year, compared with 2.7% and 4.2% annualized wage growth for the top 1% and top 0.1%, respectively.