On some fronts, the economy is steadily recovering from the Great Recession. The unemployment rate is down, and the pace of monthly job growth is healing some of the damage inflicted by the downturn. But as EPI’s top charts of 2015 illustrate, the economy remains far from fully recovered—and is still failing ordinary Americans, who have endured decades of stagnant wages despite working more productively than ever.
But the charts also make clear that it doesn’t have to be this way. They show that policies that enhance low- and middle-income Americans’ economic leverage—such as keeping interest rates low, raising the minimum wage, making it easier for workers to bargain collectively, expanding access to overtime pay, and eliminating discriminatory practices that contribute to gender inequality—can go far toward creating an economy where prosperity is broadly shared.
Share of prime-age workers with a job hasn't recovered from the recession: Employment-to-population ratio of workers age 25–54, 1989–2015
| Employment-to-population ratio | |
|---|---|
| Jan-1989 | 80.0% |
| Feb-1989 | 79.9 |
| Mar-1989 | 79.9 |
| Apr-1989 | 79.8 |
| May-1989 | 79.8 |
| Jun-1989 | 79.8 |
| Jul-1989 | 79.8 |
| Aug-1989 | 79.9 |
| Sep-1989 | 80.0 |
| Oct-1989 | 79.9 |
| Nov-1989 | 80.2 |
| Dec-1989 | 80.1 |
| Jan-1990 | 80.2 |
| Feb-1990 | 80.2 |
| Mar-1990 | 80.1 |
| Apr-1990 | 79.9 |
| May-1990 | 79.9 |
| Jun-1990 | 79.8 |
| Jul-1990 | 79.6 |
| Aug-1990 | 79.5 |
| Sep-1990 | 79.4 |
| Oct-1990 | 79.4 |
| Nov-1990 | 79.2 |
| Dec-1990 | 79.0 |
| Jan-1991 | 78.9 |
| Feb-1991 | 78.9 |
| Mar-1991 | 78.7 |
| Apr-1991 | 79.0 |
| May-1991 | 78.6 |
| Jun-1991 | 78.7 |
| Jul-1991 | 78.6 |
| Aug-1991 | 78.5 |
| Sep-1991 | 78.6 |
| Oct-1991 | 78.5 |
| Nov-1991 | 78.4 |
| Dec-1991 | 78.3 |
| Jan-1992 | 78.4 |
| Feb-1992 | 78.2 |
| Mar-1992 | 78.2 |
| Apr-1992 | 78.4 |
| May-1992 | 78.4 |
| Jun-1992 | 78.5 |
| Jul-1992 | 78.4 |
| Aug-1992 | 78.4 |
| Sep-1992 | 78.3 |
| Oct-1992 | 78.2 |
| Nov-1992 | 78.2 |
| Dec-1992 | 78.2 |
| Jan-1993 | 78.2 |
| Feb-1993 | 78.1 |
| Mar-1993 | 78.2 |
| Apr-1993 | 78.2 |
| May-1993 | 78.5 |
| Jun-1993 | 78.6 |
| Jul-1993 | 78.6 |
| Aug-1993 | 78.8 |
| Sep-1993 | 78.6 |
| Oct-1993 | 78.7 |
| Nov-1993 | 79.0 |
| Dec-1993 | 79.0 |
| Jan-1994 | 78.9 |
| Feb-1994 | 78.9 |
| Mar-1994 | 78.9 |
| Apr-1994 | 79.0 |
| May-1994 | 79.2 |
| Jun-1994 | 78.8 |
| Jul-1994 | 79.1 |
| Aug-1994 | 79.2 |
| Sep-1994 | 79.6 |
| Oct-1994 | 79.6 |
| Nov-1994 | 79.8 |
| Dec-1994 | 79.8 |
| Jan-1995 | 79.7 |
| Feb-1995 | 80.0 |
| Mar-1995 | 79.9 |
| Apr-1995 | 79.8 |
| May-1995 | 79.7 |
| Jun-1995 | 79.5 |
| Jul-1995 | 79.7 |
| Aug-1995 | 79.6 |
| Sep-1995 | 79.8 |
| Oct-1995 | 79.8 |
| Nov-1995 | 79.7 |
| Dec-1995 | 79.7 |
| Jan-1996 | 79.8 |
| Feb-1996 | 79.9 |
| Mar-1996 | 79.9 |
| Apr-1996 | 79.9 |
| May-1996 | 80.0 |
| Jun-1996 | 80.1 |
| Jul-1996 | 80.4 |
| Aug-1996 | 80.5 |
| Sep-1996 | 80.4 |
| Oct-1996 | 80.6 |
| Nov-1996 | 80.5 |
| Dec-1996 | 80.5 |
| Jan-1997 | 80.5 |
| Feb-1997 | 80.4 |
| Mar-1997 | 80.6 |
| Apr-1997 | 80.7 |
| May-1997 | 80.6 |
| Jun-1997 | 80.9 |
| Jul-1997 | 81.1 |
| Aug-1997 | 81.3 |
| Sep-1997 | 81.1 |
| Oct-1997 | 81.1 |
| Nov-1997 | 81.0 |
| Dec-1997 | 81.0 |
| Jan-1998 | 81.0 |
| Feb-1998 | 81.0 |
| Mar-1998 | 81.0 |
| Apr-1998 | 81.1 |
| May-1998 | 81.0 |
| Jun-1998 | 81.0 |
| Jul-1998 | 81.1 |
| Aug-1998 | 81.2 |
| Sep-1998 | 81.3 |
| Oct-1998 | 81.1 |
| Nov-1998 | 81.2 |
| Dec-1998 | 81.3 |
| Jan-1999 | 81.8 |
| Feb-1999 | 81.5 |
| Mar-1999 | 81.3 |
| Apr-1999 | 81.3 |
| May-1999 | 81.4 |
| Jun-1999 | 81.4 |
| Jul-1999 | 81.2 |
| Aug-1999 | 81.3 |
| Sep-1999 | 81.3 |
| Oct-1999 | 81.5 |
| Nov-1999 | 81.6 |
| Dec-1999 | 81.5 |
| Jan-2000 | 81.8 |
| Feb-2000 | 81.8 |
| Mar-2000 | 81.7 |
| Apr-2000 | 81.9 |
| May-2000 | 81.5 |
| Jun-2000 | 81.5 |
| Jul-2000 | 81.3 |
| Aug-2000 | 81.1 |
| Sep-2000 | 81.1 |
| Oct-2000 | 81.1 |
| Nov-2000 | 81.3 |
| Dec-2000 | 81.4 |
| Jan-2001 | 81.4 |
| Feb-2001 | 81.3 |
| Mar-2001 | 81.3 |
| Apr-2001 | 80.9 |
| May-2001 | 80.8 |
| Jun-2001 | 80.6 |
| Jul-2001 | 80.5 |
| Aug-2001 | 80.2 |
| Sep-2001 | 80.2 |
| Oct-2001 | 79.9 |
| Nov-2001 | 79.7 |
| Dec-2001 | 79.8 |
| Jan-2002 | 79.6 |
| Feb-2002 | 79.8 |
| Mar-2002 | 79.6 |
| Apr-2002 | 79.5 |
| May-2002 | 79.4 |
| Jun-2002 | 79.2 |
| Jul-2002 | 79.1 |
| Aug-2002 | 79.3 |
| Sep-2002 | 79.4 |
| Oct-2002 | 79.2 |
| Nov-2002 | 78.8 |
| Dec-2002 | 79.0 |
| Jan-2003 | 78.9 |
| Feb-2003 | 78.9 |
| Mar-2003 | 79.0 |
| Apr-2003 | 79.1 |
| May-2003 | 78.9 |
| Jun-2003 | 78.9 |
| Jul-2003 | 78.8 |
| Aug-2003 | 78.7 |
| Sep-2003 | 78.6 |
| Oct-2003 | 78.6 |
| Nov-2003 | 78.7 |
| Dec-2003 | 78.8 |
| Jan-2004 | 78.9 |
| Feb-2004 | 78.8 |
| Mar-2004 | 78.7 |
| Apr-2004 | 78.9 |
| May-2004 | 79 |
| Jun-2004 | 79.1 |
| Jul-2004 | 79.2 |
| Aug-2004 | 79 |
| Sep-2004 | 79 |
| Oct-2004 | 79 |
| Nov-2004 | 79.1 |
| Dec-2004 | 78.9 |
| Jan-2005 | 79.2 |
| Feb-2005 | 79.2 |
| Mar-2005 | 79.2 |
| Apr-2005 | 79.4 |
| May-2005 | 79.5 |
| Jun-2005 | 79.2 |
| Jul-2005 | 79.4 |
| Aug-2005 | 79.6 |
| Sep-2005 | 79.4 |
| Oct-2005 | 79.3 |
| Nov-2005 | 79.2 |
| Dec-2005 | 79.3 |
| Jan-2006 | 79.6 |
| Feb-2006 | 79.7 |
| Mar-2006 | 79.8 |
| Apr-2006 | 79.6 |
| May-2006 | 79.7 |
| Jun-2006 | 79.8 |
| Jul-2006 | 79.8 |
| Aug-2006 | 79.8 |
| Sep-2006 | 79.9 |
| Oct-2006 | 80.1 |
| Nov-2006 | 80 |
| Dec-2006 | 80.1 |
| Jan-2007 | 80.3 |
| Feb-2007 | 80.1 |
| Mar-2007 | 80.2 |
| Apr-2007 | 80 |
| May-2007 | 80 |
| Jun-2007 | 79.9 |
| Jul-2007 | 79.8 |
| Aug-2007 | 79.8 |
| Sep-2007 | 79.7 |
| Oct-2007 | 79.6 |
| Nov-2007 | 79.7 |
| Dec-2007 | 79.7 |
| Jan-2008 | 80 |
| Feb-2008 | 79.9 |
| Mar-2008 | 79.8 |
| Apr-2008 | 79.6 |
| May-2008 | 79.5 |
| Jun-2008 | 79.4 |
| Jul-2008 | 79.2 |
| Aug-2008 | 78.8 |
| Sep-2008 | 78.8 |
| Oct-2008 | 78.4 |
| Nov-2008 | 78.1 |
| Dec-2008 | 77.6 |
| Jan-2009 | 77 |
| Feb-2009 | 76.7 |
| Mar-2009 | 76.2 |
| Apr-2009 | 76.2 |
| May-2009 | 75.9 |
| Jun-2009 | 75.9 |
| Jul-2009 | 75.8 |
| Aug-2009 | 75.6 |
| Sep-2009 | 75.1 |
| Oct-2009 | 75 |
| Nov-2009 | 75.2 |
| Dec-2009 | 74.8 |
| Jan-2010 | 75.1 |
| Feb-2010 | 75.1 |
| Mar-2010 | 75.1 |
| Apr-2010 | 75.4 |
| May-2010 | 75.1 |
| Jun-2010 | 75.2 |
| Jul-2010 | 75.1 |
| Aug-2010 | 75 |
| Sep-2010 | 75.1 |
| Oct-2010 | 75 |
| Nov-2010 | 74.8 |
| Dec-2010 | 75 |
| Jan-2011 | 75.2 |
| Feb-2011 | 75.1 |
| Mar-2011 | 75.3 |
| Apr-2011 | 75.1 |
| May-2011 | 75.2 |
| Jun-2011 | 75 |
| Jul-2011 | 75 |
| Aug-2011 | 75.1 |
| Sep-2011 | 74.9 |
| Oct-2011 | 74.9 |
| Nov-2011 | 75.3 |
| Dec-2011 | 75.4 |
| Jan-2012 | 75.6 |
| Feb-2012 | 75.6 |
| Mar-2012 | 75.7 |
| Apr-2012 | 75.7 |
| May-2012 | 75.7 |
| Jun-2012 | 75.7 |
| Jul-2012 | 75.6 |
| Aug-2012 | 75.7 |
| Sep-2012 | 75.9 |
| Oct-2012 | 76 |
| Nov-2012 | 75.8 |
| Dec-2012 | 75.9 |
| Jan-2013 | 75.7 |
| Feb-2013 | 75.9 |
| Mar-2013 | 75.9 |
| Apr-2013 | 75.9 |
| May-2013 | 76 |
| Jun-2013 | 75.9 |
| Jul-2013 | 76 |
| Aug-2013 | 75.9 |
| Sep-2013 | 75.9 |
| Oct-2013 | 75.5 |
| Nov-2013 | 76 |
| Dec-2013 | 76.1 |
| Jan-2014 | 76.5 |
| Feb-2014 | 76.5 |
| Mar-2014 | 76.6 |
| Apr-2014 | 76.5 |
| May-2014 | 76.4 |
| Jun-2014 | 76.8 |
| Jul-2014 | 76.6 |
| Aug-2014 | 76.8 |
| Sep-2014 | 76.8 |
| Oct-2014 | 76.9 |
| Nov-2014 | 76.9 |
| Dec-2014 | 77 |
| Jan-2015 | 77.2 |
| Feb-2015 | 77.3 |
| Mar-2015 | 77.2 |
| Apr-2015 | 77.2 |
| May-2015 | 77.2 |
| Jun-2015 | 77.2 |
| Jul-2015 | 77.1 |
| Aug-2015 | 77.2 |
| Sep-2015 | 77.2 |
| Oct-2015 | 77.2 |
| Nov-2015 | 77.4% |
Note: Shaded areas denote recessions.
Source: Adapted from Elise Gould, "What to Watch on Jobs Day: Job Growth Has Only Been Fast Enough to Keep Up with Population Growth," Working Economics (Economic Policy Institute blog), November 5, 2015
While the headline unemployment rate has fallen nearly to pre–Great Recession levels, other measures show much less progress. In particular, the share of 25- to 54-year-olds with a job is a crucial measure of how far from full recovery the economy truly is. From its peak before the Great Recession to its trough following the downturn, the share of 25- to 54-year-olds with a job fell 5.6 percentage points. Since then, it has clawed back less than half of this decline. It currently sits at 77.4 percent, 2.9 percentage points below its pre–Great Recession peak. Even more striking, this measure is a whopping 4.5 percentage points below the peak reached in 2000.
This provides strong evidence that the U.S. economy hasn’t yet achieved a full recovery from the Great Recession. It also illustrates that we’re far from the genuine full employment that prevailed in the late 1990s, which was the last time that nearly all American workers saw healthy wage increases. Until the labor market is tighter—in other words, until the share of Americans age 25–54 with a job has fully recovered—employers won’t need to pay higher wages to get and keep the workers they need.
The gap between what wages are, and what they would be in a healthy economy, is growing: Cumulative nominal average hourly earnings, actual and hypothetical had they grown 3.5% annually since the recession began, 2007–2015
| Average hourly earnings of all private employees | Hypothetical, assuming 3.5% growth* | |
|---|---|---|
| Jan-2007 | $20.6000 | |
| Feb-2007 | $20.6800 | |
| Mar-2007 | $20.7700 | |
| Apr-2007 | $20.8200 | |
| May-2007 | $20.8800 | |
| Jun-2007 | $21.0000 | |
| Jul-2007 | $21.0000 | |
| Aug-2007 | $21.0300 | |
| Sep-2007 | $21.0800 | |
| Oct-2007 | $21.1100 | |
| Nov-2007 | $21.1500 | |
| Dec-2007 | $21.2200 | $21.2200 |
| Jan-2008 | $21.2400 | $21.2809 |
| Feb-2008 | $21.3200 | $21.3420 |
| Mar-2008 | $21.4100 | $21.4033 |
| Apr-2008 | $21.4200 | $21.4647 |
| May-2008 | $21.5100 | $21.5264 |
| Jun-2008 | $21.5600 | $21.5882 |
| Jul-2008 | $21.6300 | $21.6501 |
| Aug-2008 | $21.7300 | $21.7123 |
| Sep-2008 | $21.7600 | $21.7746 |
| Oct-2008 | $21.8100 | $21.8371 |
| Nov-2008 | $21.9200 | $21.8998 |
| Dec-2008 | $21.9800 | $21.9627 |
| Jan-2009 | $22.0000 | $22.0258 |
| Feb-2009 | $22.0100 | $22.0890 |
| Mar-2009 | $22.0800 | $22.1524 |
| Apr-2009 | $22.1100 | $22.2160 |
| May-2009 | $22.1200 | $22.2798 |
| Jun-2009 | $22.1600 | $22.3437 |
| Jul-2009 | $22.1900 | $22.4079 |
| Aug-2009 | $22.2500 | $22.4722 |
| Sep-2009 | $22.2700 | $22.5367 |
| Oct-2009 | $22.3200 | $22.6014 |
| Nov-2009 | $22.3700 | $22.6663 |
| Dec-2009 | $22.3800 | $22.7314 |
| Jan-2010 | $22.4300 | $22.7967 |
| Feb-2010 | $22.4500 | $22.8621 |
| Mar-2010 | $22.4700 | $22.9277 |
| Apr-2010 | $22.5100 | $22.9936 |
| May-2010 | $22.5500 | $23.0596 |
| Jun-2010 | $22.5400 | $23.1258 |
| Jul-2010 | $22.6000 | $23.1922 |
| Aug-2010 | $22.6400 | $23.2587 |
| Sep-2010 | $22.6800 | $23.3255 |
| Oct-2010 | $22.7400 | $23.3925 |
| Nov-2010 | $22.7400 | $23.4596 |
| Dec-2010 | $22.7700 | $23.5270 |
| Jan-2011 | $22.8600 | $23.5945 |
| Feb-2011 | $22.8700 | $23.6623 |
| Mar-2011 | $22.8900 | $23.7302 |
| Apr-2011 | $22.9400 | $23.7983 |
| May-2011 | $23.0000 | $23.8667 |
| Jun-2011 | $23.0200 | $23.9352 |
| Jul-2011 | $23.1100 | $24.0039 |
| Aug-2011 | $23.0700 | $24.0728 |
| Sep-2011 | $23.1200 | $24.1419 |
| Oct-2011 | $23.2200 | $24.2112 |
| Nov-2011 | $23.2000 | $24.2807 |
| Dec-2011 | $23.2200 | $24.3504 |
| Jan-2012 | $23.2600 | $24.4203 |
| Feb-2012 | $23.3000 | $24.4905 |
| Mar-2012 | $23.3700 | $24.5608 |
| Apr-2012 | $23.4000 | $24.6313 |
| May-2012 | $23.4200 | $24.7020 |
| Jun-2012 | $23.4700 | $24.7729 |
| Jul-2012 | $23.5200 | $24.8440 |
| Aug-2012 | $23.4900 | $24.9154 |
| Sep-2012 | $23.5800 | $24.9869 |
| Oct-2012 | $23.5700 | $25.0586 |
| Nov-2012 | $23.6400 | $25.1306 |
| Dec-2012 | $23.7300 | $25.2027 |
| Jan-2013 | $23.7600 | $25.2751 |
| Feb-2013 | $23.7900 | $25.3476 |
| Mar-2013 | $23.8200 | $25.4204 |
| Apr-2013 | $23.8700 | $25.4934 |
| May-2013 | $23.8900 | $25.5666 |
| Jun-2013 | $23.9700 | $25.6400 |
| Jul-2013 | $23.9700 | $25.7136 |
| Aug-2013 | $24.0200 | $25.7874 |
| Sep-2013 | $24.0600 | $25.8614 |
| Oct-2013 | $24.1000 | $25.9357 |
| Nov-2013 | $24.1700 | $26.0101 |
| Dec-2013 | $24.1800 | $26.0848 |
| Jan-2014 | $24.2200 | $26.1597 |
| Feb-2014 | $24.3000 | $26.2348 |
| Mar-2014 | $24.3400 | $26.3101 |
| Apr-2014 | $24.3400 | $26.3856 |
| May-2014 | $24.4000 | $26.4614 |
| Jun-2014 | $24.4600 | $26.5374 |
| Jul-2014 | $24.4700 | $26.6135 |
| Aug-2014 | $24.5500 | $26.6899 |
| Sep-2014 | $24.5500 | $26.7666 |
| Oct-2014 | $24.5900 | $26.8434 |
| Nov-2014 | $24.6800 | $26.9205 |
| Dec-2014 | $24.6200 | $26.9978 |
| Jan-2015 | $24.7600 | $27.0753 |
| Feb-2015 | $24.7800 | $27.1530 |
| Mar-2015 | $24.8500 | $27.2310 |
| Apr-2015 | $24.8900 | $27.3091 |
| May-2015 | $24.9500 | $27.3875 |
| Jun-2015 | $24.9500 | $27.4662 |
| Jul-2015 | $25.0100 | $27.5450 |
| Aug-2015 | $25.1000 | $27.6241 |
| Sep-2015 | $25.1200 | $27.7034 |
| Oct-2015 | $25.2100 | $27.7829 |
| Nov-2015 | $25.2500 | $27.8627 |
* Nominal wage growth consistent with the Federal Reserve Board's 2 percent inflation target, 1.5 percent productivity growth, and a stable labor share of income
Source: Adapted from EPI's "Nominal Wage Tracker"
Another measure that highlights the still-precarious state of the U.S. economy is the slow growth of nominal wages (wages unadjusted for inflation). Nominal wages of private-sector employees have only risen between 2 and 2.5 percent this year—and every other year since the recovery began. In a healthy economy, nominal wages should grow roughly 3.5 percent annually. Each year that wage growth misses this target just widens the gap that needs to be filled to restore wages to pre–Great Recession levels.
The deceleration of nominal wage growth—and the failure so far to reverse this trend—is the clearest sign that the American economy remains weak because it is still starved of aggregate demand (spending by households, businesses, and governments). It is thus the clearest signal that policymakers—particularly the Federal Reserve—should hold off on intentionally slowing economic growth in 2016.
Workers' pay is no longer rising along with productivity: Growth in economy-wide productivity and a typical worker's hourly compensation, 1948–2014
| Year | Hourly compensation | Net productivity |
|---|---|---|
| 1948 | 0.0% | 0.0% |
| 1949 | 6.3% | 1.5% |
| 1950 | 10.5% | 9.3% |
| 1951 | 11.8% | 12.3% |
| 1952 | 15.0% | 15.6% |
| 1953 | 20.8% | 19.5% |
| 1954 | 23.5% | 21.6% |
| 1955 | 28.7% | 26.5% |
| 1956 | 33.9% | 26.7% |
| 1957 | 37.1% | 30.1% |
| 1958 | 38.2% | 32.8% |
| 1959 | 42.5% | 37.6% |
| 1960 | 45.5% | 40.0% |
| 1961 | 48.0% | 44.3% |
| 1962 | 52.5% | 49.8% |
| 1963 | 55.0% | 55.0% |
| 1964 | 58.5% | 60.0% |
| 1965 | 62.5% | 64.9% |
| 1966 | 64.9% | 70.0% |
| 1967 | 66.9% | 72.0% |
| 1968 | 70.7% | 77.2% |
| 1969 | 74.7% | 77.9% |
| 1970 | 76.6% | 80.4% |
| 1971 | 82.0% | 87.1% |
| 1972 | 91.2% | 92.0% |
| 1973 | 91.3% | 96.7% |
| 1974 | 87.0% | 93.7% |
| 1975 | 86.8% | 97.9% |
| 1976 | 89.7% | 103.4% |
| 1977 | 93.1% | 105.8% |
| 1978 | 96.0% | 107.8% |
| 1979 | 93.4% | 108.1% |
| 1980 | 88.6% | 106.6% |
| 1981 | 87.6% | 111.0% |
| 1982 | 87.8% | 107.9% |
| 1983 | 88.3% | 114.1% |
| 1984 | 86.9% | 119.7% |
| 1985 | 86.3% | 123.4% |
| 1986 | 87.3% | 128.0% |
| 1987 | 84.6% | 129.1% |
| 1988 | 83.9% | 131.8% |
| 1989 | 83.7% | 133.6% |
| 1990 | 82.2% | 137.0% |
| 1991 | 81.9% | 138.9% |
| 1992 | 83.0% | 147.5% |
| 1993 | 83.4% | 148.4% |
| 1994 | 83.8% | 150.7% |
| 1995 | 82.7% | 150.8% |
| 1996 | 82.8% | 156.9% |
| 1997 | 84.8% | 160.5% |
| 1998 | 89.2% | 165.7% |
| 1999 | 91.9% | 172.1% |
| 2000 | 92.9% | 178.5% |
| 2001 | 95.6% | 182.9% |
| 2002 | 99.5% | 190.7% |
| 2003 | 101.6% | 200.2% |
| 2004 | 101.0% | 208.3% |
| 2005 | 100.0% | 213.6% |
| 2006 | 100.2% | 215.6% |
| 2007 | 101.7% | 217.8% |
| 2008 | 101.8% | 218.3% |
| 2009 | 109.7% | 224.9% |
| 2010 | 111.5% | 234.4% |
| 2011 | 109.1% | 234.8% |
| 2012 | 107.3% | 236.6% |
| 2013 | 108.3% | 236.9% |
| 2014 | 109.0% | 238.7% |
Note: Data are for average hourly compensation of production/nonsupervisory workers in the private sector and net productivity of the total economy. "Net productivity" is the growth of output of goods and services minus depreciation per hour worked.
Source: Adapted from Figure A in Josh Bivens and Lawrence Mishel, Understanding the Historic Divergence Between Productivity and a Typical Worker’s Pay: Why It Matters and Why It’s Real, EPI Briefing Paper #406, September 2, 2015
Anemic wage growth is nothing new—American workers have had to contend with stagnant wages for decades. From 1973 to 2014, the hourly pay (wages and benefits) of typical workers increased only 9.2 percent over 41 years (after adjusting for inflation). Over this same period, net productivity (how much workers produce per hour) rose 72.2 percent. This means that although Americans are working more productively than ever, the fruits of their labors have primarily accrued to managers and executives at the top of the pay scale and to corporate profits. In contrast, for two-and-a-half decades beginning in the late 1940s, the pay of typical workers rose in tandem with productivity.
Inequality explains 70% of the pay–productivity gap: Growth of productivity, real average compensation (consumer and producer), and real median compensation, 1973–2014
| Year | Median hourly compensation | Consumer avg. hourly compensation | Net productivity | Producer avg. hourly compensation |
|---|---|---|---|---|
| 1973 | 0.0% | 0.0% | 0.0% | 0.0% |
| 1974 | -2.0% | -0.9% | -1.6% | 0.1% |
| 1975 | -0.5% | 1.0% | 0.6% | 1.2% |
| 1976 | 0.4% | 2.8% | 3.4% | 3.1% |
| 1977 | 1.3% | 3.9% | 4.6% | 4.5% |
| 1978 | 2.5% | 5.0% | 5.6% | 5.4% |
| 1979 | 1.9% | 4.9% | 5.8% | 6.6% |
| 1980 | 1.1% | 4.1% | 5.0% | 7.9% |
| 1981 | -1.2% | 4.5% | 7.2% | 8.6% |
| 1982 | 0.5% | 5.6% | 5.7% | 9.7% |
| 1983 | 0.4% | 5.8% | 8.8% | 10.0% |
| 1984 | 0.7% | 6.0% | 11.7% | 10.8% |
| 1985 | 1.7% | 7.7% | 13.6% | 12.6% |
| 1986 | 3.8% | 11.2% | 15.9% | 16.3% |
| 1987 | 3.4% | 11.9% | 16.5% | 18.1% |
| 1988 | 2.7% | 13.3% | 17.8% | 19.9% |
| 1989 | 2.6% | 12.1% | 18.8% | 19.1% |
| 1990 | 2.6% | 13.4% | 20.4% | 21.8% |
| 1991 | 3.6% | 14.6% | 21.4% | 23.4% |
| 1992 | 5.2% | 18.0% | 25.8% | 27.3% |
| 1993 | 4.5% | 17.1% | 26.2% | 26.5% |
| 1994 | 2.4% | 16.3% | 27.4% | 25.7% |
| 1995 | 0.7% | 15.7% | 27.5% | 25.6% |
| 1996 | -0.4% | 17.1% | 30.6% | 28.0% |
| 1997 | 1.4% | 18.4% | 32.4% | 29.8% |
| 1998 | 4.0% | 22.7% | 35.0% | 34.7% |
| 1999 | 7.1% | 25.3% | 38.3% | 38.2% |
| 2000 | 6.8% | 29.1% | 41.6% | 43.8% |
| 2001 | 9.6% | 31.2% | 43.8% | 46.6% |
| 2002 | 11.3% | 32.5% | 47.8% | 47.9% |
| 2003 | 13.3% | 35.1% | 52.6% | 51.1% |
| 2004 | 13.6% | 37.7% | 56.7% | 53.9% |
| 2005 | 12.5% | 37.9% | 59.4% | 54.6% |
| 2006 | 12.3% | 38.7% | 60.4% | 56.1% |
| 2007 | 11.0% | 40.6% | 61.5% | 58.4% |
| 2008 | 11.6% | 39.3% | 61.8% | 59.8% |
| 2009 | 14.0% | 42.1% | 65.1% | 60.9% |
| 2010 | 12.7% | 42.6% | 70.0% | 61.9% |
| 2011 | 9.6% | 41.1% | 70.2% | 61.6% |
| 2012 | 8.5% | 41.6% | 71.1% | 62.4% |
| 2013 | 9.6% | 41.2% | 71.2% | 61.8% |
| 2014 | 8.7% | 42.5% | 72.2% | 63.3% |
Note: Over 1973–2014, over half (58.9 percent) of the growth of the productivity–median compensation gap was due to increased compensation inequality, and about a tenth (11.5 percent) was due to a loss in labor’s income share—meaning that about 70 percent of the gap is attributable to inequality. All compensation data are in real terms. Data are for all workers. Net productivity is the growth of output of goods and services minus depreciation, per hour worked.
Source: Adapted from Figure C in Josh Bivens and Lawrence Mishel, Understanding the Historic Divergence Between Productivity and a Typical Worker’s Pay: Why It Matters and Why It’s Real, EPI Briefing Paper #406, September 2, 2015
The prosperity generated over the last four decades has failed to “trickle down” to the vast majority largely because policy choices have exacerbated inequality by allowing those with the most income, wealth, and power to capture these gains.
Indeed, more than 70 percent of the pay–productivity divergence over 1973–2014 can be explained by rising inequality. This inequality takes two forms: inequality within the pay structure, and the loss in workers’ share of income (in other words, income is increasingly going toward capital owners—for example, in the form of profits—instead of toward employee compensation). And since 2000, rising inequality explains more than 85 percent of the pay–productivity divergence.
For future productivity gains to lead to robust wage growth and widely shared prosperity, we need to institute policies that reconnect pay and productivity—such as those in EPI’s Agenda to Raise America’s Pay.
Had the minimum wage risen in line with productivity since 1968, it would be over $18: Real and nominal value of the federal minimum wage, and total economy productivity, 1938–2014
| Real federal minimum wage (2014$) | Projected under RTWA* | Productivity | Projected Net Productivity | Nominal minimum wage | Projected nominal minimum wage | |
|---|---|---|---|---|---|---|
| 1938 | $3.67 | $ 0.25 | ||||
| 1939 | $4.46 | $ 0.30 | ||||
| 1940 | $4.43 | $ 0.30 | ||||
| 1941 | $4.22 | $ 0.30 | ||||
| 1942 | $3.81 | $ 0.30 | ||||
| 1943 | $3.59 | $ 0.30 | ||||
| 1944 | $3.53 | $ 0.30 | ||||
| 1945 | $4.60 | $ 0.40 | ||||
| 1946 | $4.24 | $ 0.40 | ||||
| 1947 | $3.71 | $ 0.40 | ||||
| 1948 | $3.43 | $5.39 | $ 0.40 | |||
| 1949 | $3.48 | $5.47 | $ 0.40 | |||
| 1950 | $6.44 | $5.89 | $ 0.75 | |||
| 1951 | $5.97 | $6.05 | $ 0.75 | |||
| 1952 | $5.85 | $6.23 | $ 0.75 | |||
| 1953 | $5.81 | $6.44 | $ 0.75 | |||
| 1954 | $5.77 | $6.55 | $ 0.75 | |||
| 1955 | $5.79 | $6.81 | $ 0.75 | |||
| 1956 | $7.60 | $6.82 | $ 1.00 | |||
| 1957 | $7.36 | $7.01 | $ 1.00 | |||
| 1958 | $7.16 | $7.15 | $ 1.00 | |||
| 1959 | $7.11 | $7.41 | $ 1.00 | |||
| 1960 | $6.99 | $7.54 | $ 1.00 | |||
| 1961 | $7.96 | $7.77 | $ 1.15 | |||
| 1962 | $7.88 | $8.07 | $ 1.15 | |||
| 1963 | $8.45 | $8.35 | $ 1.25 | |||
| 1964 | $8.34 | $8.62 | $ 1.25 | |||
| 1965 | $8.21 | $8.88 | $ 1.25 | |||
| 1966 | $7.98 | $9.16 | $ 1.25 | |||
| 1967 | $8.67 | $9.27 | $ 1.40 | |||
| 1968 | $9.54 | $9.54 | $ 1.60 | |||
| 1969 | $9.13 | $9.58 | $ 1.60 | |||
| 1970 | $8.71 | $9.71 | $ 1.60 | |||
| 1971 | $8.35 | $10.08 | $ 1.60 | |||
| 1972 | $8.10 | $10.34 | $ 1.60 | |||
| 1973 | $7.62 | $10.60 | $ 1.60 | |||
| 1974 | $8.66 | $10.43 | $ 2.00 | |||
| 1975 | $8.40 | $10.66 | $ 2.10 | |||
| 1976 | $8.70 | $10.96 | $ 2.30 | |||
| 1977 | $8.18 | $11.08 | $ 2.30 | |||
| 1978 | $8.83 | $11.19 | $ 2.65 | |||
| 1979 | $8.81 | $11.21 | $ 2.90 | |||
| 1980 | $8.48 | $11.12 | $ 3.10 | |||
| 1981 | $8.37 | $11.36 | $ 3.35 | |||
| 1982 | $7.89 | $11.20 | $ 3.35 | |||
| 1983 | $7.57 | $11.53 | $ 3.35 | |||
| 1984 | $7.27 | $11.83 | $ 3.35 | |||
| 1985 | $7.03 | $12.03 | $ 3.35 | |||
| 1986 | $6.90 | $12.28 | $ 3.35 | |||
| 1987 | $6.68 | $12.34 | $ 3.35 | |||
| 1988 | $6.44 | $12.48 | $ 3.35 | |||
| 1989 | $6.18 | $12.58 | $ 3.35 | |||
| 1990 | $6.67 | $12.76 | $ 3.80 | |||
| 1991 | $7.20 | $12.87 | $ 4.25 | |||
| 1992 | $7.03 | $13.33 | $ 4.25 | |||
| 1993 | $6.86 | $13.38 | $ 4.25 | |||
| 1994 | $6.71 | $13.50 | $ 4.25 | |||
| 1995 | $6.56 | $13.51 | $ 4.25 | |||
| 1996 | $7.14 | $13.84 | $ 4.75 | |||
| 1997 | $7.57 | $14.03 | $ 5.15 | |||
| 1998 | $7.47 | $14.31 | $ 5.15 | |||
| 1999 | $7.32 | $14.65 | $ 5.15 | |||
| 2000 | $7.08 | $15.00 | $ 5.15 | |||
| 2001 | $6.89 | $15.23 | $ 5.15 | |||
| 2002 | $6.78 | $15.66 | $ 5.15 | |||
| 2003 | $6.63 | $16.17 | $ 5.15 | |||
| 2004 | $6.46 | $16.60 | $ 5.15 | |||
| 2005 | $6.25 | $16.89 | $ 5.15 | |||
| 2006 | $6.05 | $17.00 | $ 5.15 | |||
| 2007 | $6.68 | $17.12 | $ 5.85 | |||
| 2008 | $7.20 | $17.15 | $ 6.55 | |||
| 2009 | $8.00 | $17.50 | $ 7.25 | |||
| 2010 | $7.87 | $18.01 | $ 7.25 | |||
| 2011 | $7.63 | $18.03 | $ 7.25 | |||
| 2012 | $7.48 | $18.15 | $ 7.25 | |||
| 2013 | $7.37 | $18.33 | $ 7.25 | |||
| 2014 | $7.25 | $18.42 | $18.42 | $ 7.25 | $ 7.25 |
Note: The productivity series is total economy productivity net depreciation, indexed to the 1968 real value of the minimum wage. Minimum-wage values are in 2014 dollars deflated by the CPI-U-RS. Projections for productivity growth use CBO Budget and Economic Outlook, 2015 to 2025.
Source: Adapted from Figure A in David Cooper, Raising the Minimum Wage to $12 by 2020 Would Lift Wages for 35 Million American Workers, EPI Briefing Paper #405, July 14, 2015
EPI analysis of Raise the Wage Act, Fair Labor Standards Act and amendments, Current Population Survey Outgoing Rotation Group microdata, unpublished Total Economy Productivity data from Bureau of Labor Statistics Labor Productivity and Costs program, and CBO Budget and Economic Outlook, 2015 to 2025
One way to raise Americans’ wages is to increase the minimum wage. Today, a range of policy proposals to raise minimum wages at the federal, state, and local levels have proliferated. Many of them seem extraordinarily ambitious, but this is primarily because the economy has grown so unbalanced in recent decades. Had wage growth been equitable and strong in recent decades, today’s minimum wage would be far higher. For example, had the minimum wage kept pace with productivity gains after 1968, as it did from its enactment in 1938 to 1968, it would stand at $18.42 instead of $7.25. And had the minimum wage maintained its peak inflation-adjusted value (reached in 1968), it would be $9.54.
But unfortunately, wage growth hasn’t been distributed equitably in recent decades. This is because a multitude of policy decisions have sapped low- and moderate-wage workers’ power to bargain with their employers for higher pay. Restoring bargaining power to American workers will similarly require a range of policies. A good place to start is raising the federal minimum wage. In fact, increasing it to $12 by 2020 would boost wages for over 35 million workers—one-quarter of the American workforce.
States with the largest declines in collective bargaining have had slower pay growth: Median hourly compensation growth and change in state collective bargaining coverage, 1979–2012
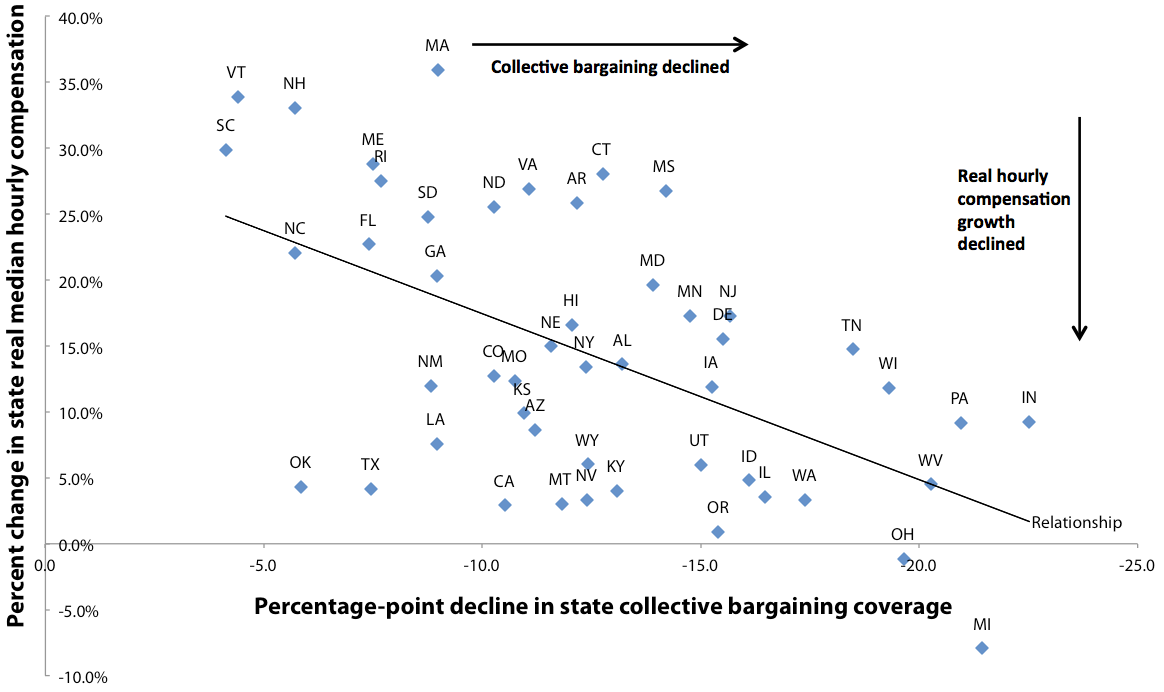
Note: Excludes Alaska and the District of Columbia.
Source: Adapted from Figure B in David Cooper and Lawrence Mishel, The Erosion of Collective Bargaining Has Widened the Gap Between Productivity and Pay, EPI Report, January 6, 2015
Making it easier for workers to bargain collectively for higher pay is another way to raise Americans’ wages. Since 2010, Republican governors have attacked collective bargaining at the state level. These attacks are not just a narrow attack on unions—they are an ambitious attack on middle-class wages. And unfortunately, they have worked. States where collective bargaining has declined the fastest have seen the slowest growth (and in some cases, even declines) in median hourly compensation over 1979–2012. This illustrates why it’s crucial to restore and expand the right to collective bargaining—a key component of EPI’s Agenda to Raise America’s Pay.
Expanding access to overtime pay could benefit over 9 million children: Number of fathers, mothers, and their children who would newly benefit from raising the overtime salary threshold to $933 per week from $455 per week, 2014
| Newly covered under $933 | |
|---|---|
| Mothers | 2,402,000 |
| Fathers | 2,219,000 |
| Children (under age 18) | 9,179,000 |
Note: The sample reflects salaried (nonhourly) workers who are subject to the Fair Labor Standards Act (FLSA). This excludes certain groups of workers such as the self-employed, most federal workers, religious workers, many agricultural workers, and many transportation workers.
Source: Adapted from Figure A in Ross Eisenbrey and Lawrence Mishel, Raising the Overtime Threshold Would Directly Benefit 13.5 Million Workers: Here Is a Breakdown of Who They Are, Economic Policy Institute Report, August 3, 2015
Making more Americans eligible for time-and-a-half overtime pay is yet another policy that will help working families get their fair share of economic growth. Earlier this year, new regulations from the Department of Labor proposed raising the overtime threshold—the salary level below which workers are automatically eligible for overtime pay—from less than $24,000 ($455 per week) to roughly $50,000 ($933 per week). This threshold had been changed only trivially since 1975, even as inflation eroded its effect. The rule change—which is expected to become law next year—will benefit approximately 13.5 million workers by making them newly eligible for overtime pay.
Because America’s workers are also America’s parents, this rule change could potentially raise living standards for more than 9 million children. This illustrates that policy decisions matter when it comes to American families’ wages—and that using policy to boost wages needs to be a top priority.
CEOs make 300 times more than typical workers: CEO-to-worker compensation ratio, 1965–2014
| Year | CEO-to-worker compensation ratio |
|---|---|
| 1965/01/01 | 20.0 |
| 1966/01/01 | 21.2 |
| 1967/01/01 | 22.4 |
| 1968/01/01 | 23.7 |
| 1969/01/01 | 23.4 |
| 1970/01/01 | 23.2 |
| 1971/01/01 | 22.9 |
| 1972/01/01 | 22.6 |
| 1973/01/01 | 22.3 |
| 1974/01/01 | 23.7 |
| 1975/01/01 | 25.1 |
| 1976/01/01 | 26.6 |
| 1977/01/01 | 28.2 |
| 1978/01/01 | 29.9 |
| 1979/01/01 | 31.8 |
| 1980/01/01 | 33.8 |
| 1981/01/01 | 35.9 |
| 1982/01/01 | 38.2 |
| 1983/01/01 | 40.6 |
| 1984/01/01 | 43.2 |
| 1985/01/01 | 45.9 |
| 1986/01/01 | 48.9 |
| 1987/01/01 | 51.9 |
| 1988/01/01 | 55.2 |
| 1989/01/01 | 58.7 |
| 1990/01/01 | 71.2 |
| 1991/01/01 | 86.2 |
| 1992/01/01 | 104.4 |
| 1993/01/01 | 111.8 |
| 1994/01/01 | 87.3 |
| 1995/01/01 | 122.6 |
| 1996/01/01 | 153.8 |
| 1997/01/01 | 233.0 |
| 1998/01/01 | 321.8 |
| 1999/01/01 | 286.7 |
| 2000/01/01 | 376.1 |
| 2001/01/01 | 214.2 |
| 2002/01/01 | 188.5 |
| 2003/01/01 | 227.5 |
| 2004/01/01 | 256.6 |
| 2005/01/01 | 308.0 |
| 2006/01/01 | 341.4 |
| 2007/01/01 | 345.3 |
| 2008/01/01 | 239.3 |
| 2009/01/01 | 195.8 |
| 2010/01/01 | 229.7 |
| 2011/01/01 | 235.5 |
| 2012/01/01 | 285.3 |
| 2013/01/01 | 303.1 |
| 2014/01/01 | 303.4 |
Note: CEO annual compensation is computed using the "options realized" compensation series, which includes salary, bonus, restricted stock grants, options exercised, and long-term incentive payouts for CEOs at the top 350 U.S. firms ranked by sales.
Source: Adapted from Figure C in Lawrence Mishel and Alyssa Davis, Top CEOs Make 300 Times More than Typical Workers: Pay Growth Surpasses Stock Gains and Wage Growth of Top 0.1 Percent, EPI Issue Brief #399, June 21, 2015
In contrast to the vast majority of workers, CEOs have enjoyed extraordinary pay growth in recent decades. The gap between CEOs and typical workers has expanded enormously over the past 50 years. In 1965 CEOs made 20.0 times as much as typical workers. This ratio rose to 29.9 in 1979 and 58.7 in 1989—and now sits at 303.4. While this is down a bit from previous peaks in 2000 and 2007, CEO pay is recovering rapidly from the Great Recession.
There was perhaps a time when angst about CEO pay was largely symbolic. But CEOs now make so much—and set patterns of pay for other corporate managers and in other high-end labor markets (such as those in medicine and law, and in leadership positions in academia and large nonprofits)—that it is imperative that some competitive discipline be brought to CEO pay-setting. This would free up more income for the vast majority of workers whose pay has stagnated in recent decades.
Eliminating the gender and inequality wage gap would raise women’s wages by more than 70%: Median hourly wages for men and women, compared with wages for all workers had they increased in tandem with productivity, 1979–2014
| Wages for all workers | Men’s wages | Women’s wages | Wages for all workers had they grown in tandem with productivity | |
|---|---|---|---|---|
| 1979 | $16.00 | $20.13 | $12.61 | $16.00 |
| 1980 | $15.85 | $19.83 | $12.58 | $15.88 |
| 1981 | $15.43 | $19.42 | $12.47 | $16.22 |
| 1982 | $15.65 | $19.27 | $12.49 | $15.98 |
| 1983 | $15.57 | $19.01 | $12.65 | $16.46 |
| 1984 | $15.65 | $18.92 | $12.76 | $16.89 |
| 1985 | $15.79 | $19.10 | $12.82 | $17.18 |
| 1986 | $16.09 | $19.64 | $13.15 | $17.53 |
| 1987 | $16.10 | $19.53 | $13.49 | $17.62 |
| 1988 | $16.00 | $19.16 | $13.61 | $17.82 |
| 1989 | $15.91 | $18.61 | $13.60 | $17.97 |
| 1990 | $15.90 | $18.32 | $13.64 | $18.22 |
| 1991 | $16.00 | $18.28 | $13.70 | $18.37 |
| 1992 | $16.14 | $18.13 | $13.80 | $19.03 |
| 1993 | $16.02 | $17.98 | $13.96 | $19.10 |
| 1994 | $15.74 | $17.66 | $13.84 | $19.28 |
| 1995 | $15.62 | $17.93 | $13.75 | $19.29 |
| 1996 | $15.55 | $17.81 | $13.82 | $19.75 |
| 1997 | $15.92 | $17.92 | $14.16 | $20.03 |
| 1998 | $16.36 | $18.56 | $14.51 | $20.43 |
| 1999 | $16.87 | $19.04 | $14.64 | $20.92 |
| 2000 | $16.83 | $19.16 | $14.94 | $21.41 |
| 2001 | $17.18 | $19.43 | $15.26 | $21.75 |
| 2002 | $17.33 | $19.52 | $15.64 | $22.36 |
| 2003 | $17.54 | $19.36 | $15.68 | $23.08 |
| 2004 | $17.54 | $19.13 | $15.65 | $23.70 |
| 2005 | $17.33 | $18.97 | $15.54 | $24.12 |
| 2006 | $17.40 | $18.93 | $15.56 | $24.26 |
| 2007 | $17.26 | $19.24 | $15.69 | $24.44 |
| 2008 | $17.32 | $19.13 | $15.80 | $24.48 |
| 2009 | $17.61 | $19.67 | $16.07 | $24.98 |
| 2010 | $17.38 | $19.16 | $15.96 | $25.71 |
| 2011 | $16.91 | $18.64 | $15.67 | $25.75 |
| 2012 | $16.81 | $18.60 | $15.39 | $25.88 |
| 2013 | $16.97 | $18.41 | $15.35 | $25.91 |
| 2014 | $16.90 | $18.35 | $15.21 | $26.04 |
Source: Reproduced from Figure G in Alyssa Davis and Elise Gould, Closing the Pay Gap and Beyond:
A Comprehensive Strategy for Improving Economic Security for Women and Families, EPI Briefing Paper #412, November 18, 2015
In recent decades, not only have most American women’s wages grown much slower than productivity, they have also remained considerably below men’s wages. Gender wage disparities are present at all wage levels and within education categories, occupations, and sectors—sometimes to a grave degree. If we had closed the gender wage gap and had wages for all workers grown in line with productivity over 1979–2014, the hourly wages of the median woman could be over 70 percent higher today—$26.04 instead of $15.21. This highlights the importance of ensuring gender wage parity and raising wages for all workers—the twin goals of EPI’s Women’s Economic Agenda.
The share of prime-age women with a job has fared worse in the U.S. than in peer countries: Employment-to-population ratio of women workers age 25–54, select countries, 1995–2014
| Canada | Germany | Japan | United States | |
|---|---|---|---|---|
| 1995 | 69.434551% | 66.360158% | 63.233624% | 72.189196% |
| 1996 | 69.577146% | 67.220440% | 63.701741% | 72.770073% |
| 1997 | 70.971110% | 67.399584% | 64.566038% | 73.541046% |
| 1998 | 72.183646% | 68.944387% | 64.036077% | 73.642970% |
| 1999 | 73.245982% | 70.253128% | 63.551051% | 74.147991% |
| 2000 | 73.944309% | 71.210539% | 63.582090% | 74.213847% |
| 2001 | 74.297867% | 71.607431% | 64.124398% | 73.421299% |
| 2002 | 75.348504% | 71.845950% | 63.863976% | 72.259684% |
| 2003 | 76.000458% | 71.981067% | 64.407421% | 72.006189% |
| 2004 | 76.720415% | 72.129055% | 65.028791% | 71.848458% |
| 2005 | 76.488663% | 70.969949% | 65.733178% | 71.963537% |
| 2006 | 76.984912% | 72.647765% | 66.614235% | 72.504467% |
| 2007 | 78.190906% | 74.045933% | 67.370518% | 72.501768% |
| 2008 | 78.008148% | 74.744854% | 67.495987% | 72.301570% |
| 2009 | 77.114622% | 75.420875% | 67.595960% | 70.208609% |
| 2010 | 77.075022% | 76.320711% | 68.157788% | 69.343654% |
| 2011 | 77.207691% | 77.892216% | 68.459240% | 68.967922% |
| 2012 | 77.710148% | 78.235789% | 69.161920% | 69.196894% |
| 2013 | 78.090883% | 78.625264% | 70.773639% | 69.253713% |
| 2014 | 77.444969% | 78.839200% | 71.835052% | 69.997790% |
Source: EPI analysis of OECD Labour Force Statistics
Another sign the economy is failing many American women is that in recent years, the share of 25- to 54-year-old women with a job has fared worse in the United States than in peer countries. In 1995, this share was higher in America than in almost any other wealthy country. Since then (and particularly since the tight labor markets of the late 1990s faded away), this advantage has been decisively lost. Since 2000 this share has declined substantially in the United States—while it has risen significantly in Japan, Germany, and Canada.
Given that American families rely enormously on income earned by women from working, raising the share of women who are employed should be a policy priority. An obvious policy that would help working families—and disproportionately benefit women—would be a major national investment in early childhood care and education. This would make it easier for women to balance work and family.
Achievement gaps rooted in socioeconomic status exist when children enter kindergarten: Reading and math achievement at the beginning of kindergarten, second through fifth socioeconomic quintiles as compared with lowest quintile
Reading
| Unadjusted (M1S) | |
|---|---|
| Low-middle SES | 0.269***(0.032) |
| Middle SES | 0.489***(0.034) |
| High-middle SES | 0.739***(0.037) |
| High SES | 0.996***(0.039) |
Math
| Unadjusted (M1S) | |
|---|---|
| Low-middle SES | 0.240***(0.032) |
| Middle SES | 0.504***(0.035) |
| High-middle SES | 0.710***(0.036) |
| High SES | 0.957***(0.039) |
Note: SES refers to socioeconomic status. Bars show the unadjusted standard deviation score for each socioeconomic group, relative to low-SES children.
Source: Adapted from Figure D1 in Emma Garcia, Inequalities at the Starting Gate: Cognitive and Noncognitive Skills Gaps Between 2010–2011 Kindergarten Classmates, Economic Policy Institute Report, June 17, 2015
Economic inequality leads to education inequalities. The large achievement gaps documented throughout children’s school trajectories don’t originate in school—rather, they are rooted in children’s socioeconomic status (SES). Indeed, performance gaps in reading and math are apparent when children enter kindergarten—and performance is closely associated with, and rises along with, SES. In fact, children in the highest socioeconomic fifth have reading and math scores that are significantly higher (by a full standard deviation) than those of their peers in the lowest SES fifth.
This illustrates the need to weaken the link between inequality and education, and to ensure that all children are prepared for kindergarten. This will require not only expanding access to high-quality early education programs, but also pursuing policies to reduce economic disparities.