
Submitted via https://waysandmeans.house.gov/committeesubmissions/
Two weeks ago, the Tax Policy Subcommittee of the Ways and Means Committee of the U.S. House of Representatives announced a series of hearings on the effects of the Tax Cuts and Jobs Act (TCJA) passed last December. The committee has invited submissions of written testimony from the public.
The authors of this testimony work for the Economic Policy Institute (EPI), the nation’s premier research institute studying the effect of policy on the living standards of low- and middle-income American families. Our view, supported below, is that the TCJA is deeply flawed policy. It will deliver the vast majority of its direct benefits to the richest households; claims that large benefits will trickle down through indirect channels to low- and middle-income families are clearly incorrect. The key points we make in this testimony are:
- There is no compelling evidence yet available to make firm claims about the effect of the TCJA on the American economy. Claims that evidence is already showing large positive effects are based on data cherry-picking and are either innumerate or dishonest.
- The clearest reason why evidence so far shows no compelling effect of the TCJA on the economy is that it’s simply too soon since its passage for a full set of data to be assembled. However, the data that have come in so far have shown no break in trend at all for most economic indicators. There is no basis to claim that data so far show any positive effect of the TCJA.
- The largest and only permanent cut in taxes stemming from the TCJA is a cut to corporate tax rates. Thus the best predictor of the likely effect of the TCJA is what happened after past episodes when corporate tax rates were cut.
- This evidence based on past experience with corporate rates cuts—either in the United States, in international peer countries, or in individual U.S. states—argues strongly that capital investment and pay for most American workers will not noticeably increase due to the TCJA.
Do data since the TCJA passed tell us anything about its effects?
All objective analysis indicates that the direct, first-round benefits of the TCJA will accrue overwhelmingly to richer households when the act is fully phased. The Tax Policy Center (TPC), for example, estimates that the top 1 percent of households will see 83 percent of the total benefits from the law by 2027.1 In the run-up to the passage of the TCJA, proponents often claimed that the law would have indirect effects as that would lead to higher capital investment which in turn would eventually filter through to the economy in the form of higher productivity and pay for most American workers.2 Since its passage, these proponents have not been shy about claiming it has already had beneficial effects for the U.S. economy. The two broad claims made most often are that the TCJA is responsible for an alleged tsunami of wage increases and bonus payments that appeared in its wake, and that it is responsible for a large increase in investments made by American firms in plants, equipment, and research and development. These two strong claims about what has already appeared in the data are clearly false.
With regard to claims about bonuses and wages, there are several points to make. First, there is no evidence that wage growth has materially picked up since the TCJA’s passage. Figure 1 shows nominal wage growth (measured relative to the same month last year) before and after the passage of the TCJA. There is no obvious effect at all.
Nominal wage growth has been far below target in the recovery: Year-over-year change in private-sector nominal average hourly earnings, 2007–2018
| Date | All nonfarm employees | Production/nonsupervisory workers |
|---|---|---|
| Mar-2007 | 3.44% | 4.11% |
| Apr-2007 | 3.13% | 3.85% |
| May-2007 | 3.53% | 4.14% |
| Jun-2007 | 3.61% | 4.19% |
| Jul-2007 | 3.25% | 4.05% |
| Aug-2007 | 3.35% | 3.98% |
| Sep-2007 | 3.09% | 4.15% |
| Oct-2007 | 3.03% | 3.78% |
| Nov-2007 | 3.07% | 3.83% |
| Dec-2007 | 2.92% | 3.75% |
| Jan-2008 | 2.91% | 3.80% |
| Feb-2008 | 2.85% | 3.79% |
| Mar-2008 | 3.04% | 3.83% |
| Apr-2008 | 2.89% | 3.70% |
| May-2008 | 3.07% | 3.69% |
| Jun-2008 | 2.67% | 3.56% |
| Jul-2008 | 3.05% | 3.67% |
| Aug-2008 | 3.33% | 3.89% |
| Sep-2008 | 3.28% | 3.64% |
| Oct-2008 | 3.32% | 3.81% |
| Nov-2008 | 3.50% | 3.91% |
| Dec-2008 | 3.59% | 3.90% |
| Jan-2009 | 3.58% | 3.72% |
| Feb-2009 | 3.43% | 3.65% |
| Mar-2009 | 3.28% | 3.47% |
| Apr-2009 | 3.37% | 3.35% |
| May-2009 | 2.93% | 3.06% |
| Jun-2009 | 2.88% | 2.88% |
| Jul-2009 | 2.69% | 2.76% |
| Aug-2009 | 2.44% | 2.64% |
| Sep-2009 | 2.44% | 2.75% |
| Oct-2009 | 2.53% | 2.68% |
| Nov-2009 | 2.15% | 2.67% |
| Dec-2009 | 1.96% | 2.50% |
| Jan-2010 | 2.09% | 2.66% |
| Feb-2010 | 2.09% | 2.55% |
| Mar-2010 | 1.81% | 2.27% |
| Apr-2010 | 1.81% | 2.38% |
| May-2010 | 1.90% | 2.59% |
| Jun-2010 | 1.76% | 2.53% |
| Jul-2010 | 1.85% | 2.42% |
| Aug-2010 | 1.75% | 2.36% |
| Sep-2010 | 1.84% | 2.19% |
| Oct-2010 | 1.93% | 2.45% |
| Nov-2010 | 1.79% | 2.13% |
| Dec-2010 | 1.79% | 2.02% |
| Jan-2011 | 1.96% | 2.28% |
| Feb-2011 | 1.83% | 2.11% |
| Mar-2011 | 1.83% | 2.06% |
| Apr-2011 | 1.87% | 2.11% |
| May-2011 | 2.04% | 2.10% |
| Jun-2011 | 2.13% | 2.05% |
| Jul-2011 | 2.30% | 2.26% |
| Aug-2011 | 1.95% | 1.99% |
| Sep-2011 | 1.94% | 1.99% |
| Oct-2011 | 2.07% | 1.88% |
| Nov-2011 | 1.98% | 1.82% |
| Dec-2011 | 2.02% | 1.77% |
| Jan-2012 | 1.75% | 1.35% |
| Feb-2012 | 1.79% | 1.45% |
| Mar-2012 | 2.14% | 1.76% |
| Apr-2012 | 2.09% | 1.70% |
| May-2012 | 1.74% | 1.39% |
| Jun-2012 | 1.96% | 1.54% |
| Jul-2012 | 1.69% | 1.39% |
| Aug-2012 | 1.86% | 1.33% |
| Sep-2012 | 1.99% | 1.54% |
| Oct-2012 | 1.51% | 1.18% |
| Nov-2012 | 1.94% | 1.48% |
| Dec-2012 | 2.11% | 1.69% |
| Jan-2013 | 2.11% | 1.89% |
| Feb-2013 | 2.19% | 1.99% |
| Mar-2013 | 1.93% | 1.88% |
| Apr-2013 | 2.01% | 1.78% |
| May-2013 | 2.14% | 1.93% |
| Jun-2013 | 2.13% | 1.98% |
| Jul-2013 | 2.09% | 2.03% |
| Aug-2013 | 2.26% | 2.23% |
| Sep-2013 | 2.04% | 2.12% |
| Oct-2013 | 2.25% | 2.37% |
| Nov-2013 | 2.20% | 2.32% |
| Dec-2013 | 1.90% | 2.26% |
| Jan-2014 | 1.98% | 2.21% |
| Feb-2014 | 2.23% | 2.55% |
| Mar-2014 | 2.06% | 2.30% |
| Apr-2014 | 1.97% | 2.40% |
| May-2014 | 2.13% | 2.44% |
| Jun-2014 | 2.05% | 2.34% |
| Jul-2014 | 2.08% | 2.33% |
| Aug-2014 | 2.21% | 2.43% |
| Sep-2014 | 2.16% | 2.33% |
| Oct-2014 | 2.03% | 2.22% |
| Nov-2014 | 2.03% | 2.26% |
| Dec-2014 | 1.99% | 1.92% |
| Jan-2015 | 2.19% | 2.06% |
| Feb-2015 | 1.93% | 1.66% |
| Mar-2015 | 2.22% | 1.95% |
| Apr-2015 | 2.22% | 1.95% |
| May-2015 | 2.34% | 2.14% |
| Jun-2015 | 2.17% | 2.09% |
| Jul-2015 | 2.12% | 1.99% |
| Aug-2015 | 2.24% | 2.08% |
| Sep-2015 | 2.24% | 2.03% |
| Oct-2015 | 2.52% | 2.37% |
| Nov-2015 | 2.43% | 2.12% |
| Dec-2015 | 2.56% | 2.51% |
| Jan-2016 | 2.55% | 2.40% |
| Feb-2016 | 2.38% | 2.40% |
| Mar-2016 | 2.50% | 2.54% |
| Apr-2016 | 2.61% | 2.58% |
| May-2016 | 2.44% | 2.33% |
| Jun-2016 | 2.56% | 2.43% |
| Jul-2016 | 2.76% | 2.62% |
| Aug-2016 | 2.47% | 2.42% |
| Sep-2016 | 2.63% | 2.56% |
| Oct-2016 | 2.70% | 2.36% |
| Nov-2016 | 2.57% | 2.40% |
| Dec-2016 | 2.65% | 2.49% |
| Jan-2017 | 2.40% | 2.35% |
| Feb-2017 | 2.72% | 2.39% |
| Mar-2017 | 2.55% | 2.24% |
| Apr-2017 | 2.51% | 2.24% |
| May-2017 | 2.46% | 2.33% |
| Jun-2017 | 2.50% | 2.32% |
| Jul-2017 | 2.49% | 2.22% |
| Aug-2017 | 2.60% | 2.31% |
| Sep-2017 | 2.83% | 2.59% |
| Oct-2017 | 2.28% | 2.21% |
| Nov-2017 | 2.47% | 2.35% |
| Dec-2017 | 2.66% | 2.43% |
| Jan-2018 | 2.77% | 2.43% |
| Feb-2018 | 2.57% | 2.47% |
| Mar-2018 | 2.64% | 2.60% |
| Apr-2018 | 2.56% | 2.60% |
*Nominal wage growth consistent with the Federal Reserve Board's 2 percent inflation target, 1.5 percent productivity growth, and a stable labor share of income.
Source: EPI analysis of Bureau of Labor Statistics Current Employment Statistics public data series
Second, though there were plenty of anecdotal claims about bonuses being spurred by the TCJA, bonuses are not permanent wage increases, i.e., not the sort of boost that leads to permanently higher wages because productivity has been boosted and because workers have been given the bargaining clout to claim a fair share of this productivity growth. In a sense, focusing on bonuses over permanent wage increases already constitutes an admission that claims made during the run-up to the TCJA’s passage about permanent wage gains were excessively rosy.
Third nearly 40 percent of American workers get bonuses every year.3 So, in any given year tens of millions of stories could’ve been written about the bonuses workers received. No TCJA proponents have mobilized any systematic evidence that bonuses surged because of the tax cut.
Finally, there really was an incentive in the TCJA to provide bonuses in 2017.4 Because labor costs are an expense that can be written off on corporate taxes, these bonuses become more costly when tax rates are low. Because the TCJA slashed the headline corporate tax rate from 35 percent to 21 percent, it made granting bonuses much cheaper in 2017 than in 2018 and all other post-TCJA years. What this means is that even if some increase in bonuses occurred in 2017 because of the TCJA (this remains a big “if”), there is no reason to think such bonuses will recur in the future. In short, if you didn’t get your paycheck bump from the TCJA by New Year’s Eve 2017, you’re likely to not get it at all.
With regard to the corporate investment claim, there is no serious evidence that the TCJA spurred a notable pickup in business investment. In an embarrassingly over-the-top defense of the TCJA made in the Wall Street Journal last month, the director of the Council of Economic Advisers (CEA) for the Trump Administration, Kevin Hassett, made lots of hay over the fact that business investment in the last quarter of 2017 grew 6.3 percent, an improvement over very recent years’ growth. He argued that this represented a radical improvement over an investment-starved recovery during the Obama administration’s tenure. To explain away the inconvenient fact that the TCJA didn’t come into effect until 2018, and hence would have a hard time directly explaining any late-2017 investment surge, Hassett speculated (with no evidence) that firms could predict the future improvements to post-tax profitability that would accompany the law’s effect, and that “when profits go up, capital investment goes up, and wages follow.” 5
However, in recent decades as profits and corporate managers’ salaries rose rapidly, the pay for typical workers didn’t.6 But, setting this aside for one second, even the claim that capital investment responds strongly to higher profits is impossible to square with the level of investment during the Obama administration. (As Hassett scornfully noted, “For perspective, real private nonresidential fixed investment was anemic at the end of the Obama administration.”) It’s hard to square because during these same years when capital investment genuinely was weak, profitability of corporations was historically high.7 In short, it just cannot be the case that low after-tax profitability was a binding constraint on capital investment and economic growth in recent years because profitability was not low, it was high.
Further, it’s worth lingering a bit on the data point Hassett trumpets as proving the TCJA’s effectiveness in spurring investment. He points to the 6.3 percent year-over-year increase in real, private nonresidential investment in the last quarter of 2017. We plot this in Figure 2. Readers can decide for themselves if they think this second-to-last last data point (which is what Hassett is lauding) looks like the TCJA (or anything else) has been a game changer in driving investment. It doesn’t seem like it to us, given that the year-over-year increase in real, private nonresidential investment was substantially higher several times during the Obama recovery that Hassett claims was “anemic.”
Preliminary data show no signs of an investment boom from the TCJA: Year-over-year change in real, nonresidential fixed investment, 2000Q1–2018Q1
| Quarter | Year-over-year change |
|---|---|
| 2000-I | 9.7 |
| 2000-II | 10.2 |
| 2000-III | 8.4 |
| 2000-IV | 8.2 |
| 2001-I | 3.7 |
| 2001-II | -1.8 |
| 2001-III | -4.1 |
| 2001-IV | -7.1 |
| 2002-I | -8.2 |
| 2002-II | -7.4 |
| 2002-III | -6.7 |
| 2002-IV | -5.1 |
| 2003-I | -2.9 |
| 2003-II | 0.8 |
| 2003-III | 3.5 |
| 2003-IV | 6.2 |
| 2004-I | 4.8 |
| 2004-II | 4.6 |
| 2004-III | 5.3 |
| 2004-IV | 6 |
| 2005-I | 8.6 |
| 2005-II | 7.7 |
| 2005-III | 6.8 |
| 2005-IV | 5 |
| 2006-I | 7.5 |
| 2006-II | 7.3 |
| 2006-III | 6.7 |
| 2006-IV | 6.9 |
| 2007-I | 4.9 |
| 2007-II | 5.6 |
| 2007-III | 6 |
| 2007-IV | 7.1 |
| 2008-I | 5.3 |
| 2008-II | 2.7 |
| 2008-III | -1.6 |
| 2008-IV | -8.9 |
| 2009-I | -15.5 |
| 2009-II | -17.7 |
| 2009-III | -16.5 |
| 2009-IV | -12.2 |
| 2010-I | -4.3 |
| 2010-II | 1.5 |
| 2010-III | 4.9 |
| 2010-IV | 8.1 |
| 2011-I | 6.8 |
| 2011-II | 6.1 |
| 2011-III | 8.7 |
| 2011-IV | 9 |
| 2012-I | 12.4 |
| 2012-II | 12.1 |
| 2012-III | 6.7 |
| 2012-IV | 5.2 |
| 2013-I | 3.5 |
| 2013-II | 2.3 |
| 2013-III | 3.4 |
| 2013-IV | 4.8 |
| 2014-I | 5.3 |
| 2014-II | 7 |
| 2014-III | 9.1 |
| 2014-IV | 6.1 |
| 2015-I | 4.8 |
| 2015-II | 3.2 |
| 2015-III | 1.1 |
| 2015-IV | 0.3 |
| 2016-I | -1.2 |
| 2016-II | -1.1 |
| 2016-III | -0.7 |
| 2016-IV | 0.7 |
| 2017-I | 3.5 |
| 2017-II | 4.3 |
| 2017-III | 4.6 |
| 2017-IV | 6.3 |
| 2018-1 | 6.8 |
Source: EPI analysis of data from table 1.1.3 from the National Income and Product Accounts (NIPA) from the Bureau of Economic Analysis (BEA).
The preliminary data for the first quarter of 2018 showed that nonresidential investment growth slowed in the first quarter of 2018 to 6.1 percent. The second round of revisions to this data (another round will come next month) boosted this growth to 6.8 percent—faster than the last quarter of 2017, but still below rates of growth from 2011 and 2014. In short, we do not yet have economy-wide data showing a rapid upsurge of investment due to the TCJA.
While this economy-wide data is quite damning of claims that the TCJA has spurred investment, the law’s proponents have taken some succor in a recent report citing evidence from nonpublic data that tracks investment by S&P 500 firms.8 This report claimed a large pickup in business investment that saw it grow faster in the first quarter of 2018 than at any point since 2011.
But this report should not lead one to think that the official, economy-wide data should be discounted. Besides being nonpublic and hence largely non-replicable, the firms surveyed from the S&P account for well under 10 percent of total private business investment in the U.S. economy.9 As such, even if faster investment occurred in these firms, this more-rapid investment apparently could not pull up the economy-wide numbers that are much more relevant for American living standards.
Further, much investment done by S&P companies is likely done overseas. This does not boost American productivity and does not show up (properly) in U.S. national accounts. It is by now well-known that the TCJA provided incentives for firms to make investments overseas rather than in the United States.10 A much-slower pace of overall American capital investment relative to what S&P firms undertook is consistent with the TCJA doing little-to-nothing to boost American investment, but nudging multinationals to invest offshore. In short, American workers should take no solace at all in S&P firms boosting investments while growth in overall national investments by businesses remains flat.
What past evidence on corporate tax cuts tells us
Again, no side in the debate over the effect of the TCJA should be making large claims about what the data tell us so far; there simply isn’t enough data yet to make a serious evaluation. One can, of course, look at past experience to assess the likely effect of lowering corporate tax rates on investment and wage growth. EPI did that in a number of reports and analyses released during the debate spurred by the introduction of the TCJA.
For example, the Trump administration’s Council of Economic Advisers released a paper last year arguing that cuts in the statutory corporate tax rate would lead to gains in business investment, productivity, and wages.11 We noted in report released shortly thereafter why this was unlikely to be true.12
The simplest reason that cutting corporate taxes will not boost American productivity or wages is that the past history corporate tax cuts in the United States shows no such relationship. Figure 3 shows the top corporate tax rate, productivity growth, and growth in typical workers’ hourly pay since the 1950s. It shows clearly that productivity and pay actually grew more rapidly when tax rates were higher.
Productivity and hourly pay grew faster when corporate tax rates were higher: Statutory corporate tax rate and 5-year average of productivity and real hourly pay growth, 1953–2016
| Year | Statutory corporate income tax rate | Real average hourly compensation growth (2016 dollars) | Net productivity growth |
|---|---|---|---|
| 1953 | 52.00% | 4.17% | 3.91% |
| 1954 | 52.00% | 3.25% | 3.94% |
| 1955 | 52.00% | 3.31% | 3.13% |
| 1956 | 52.00% | 3.97% | 2.55% |
| 1957 | 52.00% | 3.84% | 2.50% |
| 1958 | 52.00% | 2.87% | 2.21% |
| 1959 | 52.00% | 3.08% | 2.65% |
| 1960 | 52.00% | 2.60% | 2.15% |
| 1961 | 52.00% | 2.10% | 2.79% |
| 1962 | 52.00% | 2.24% | 3.03% |
| 1963 | 52.00% | 2.44% | 3.35% |
| 1964 | 50.00% | 2.24% | 3.25% |
| 1965 | 48.00% | 2.33% | 3.55% |
| 1966 | 52.80% | 2.29% | 3.55% |
| 1967 | 52.80% | 1.89% | 2.97% |
| 1968 | 52.80% | 2.03% | 2.86% |
| 1969 | 52.80% | 2.04% | 2.24% |
| 1970 | 49.20% | 1.74% | 1.87% |
| 1971 | 48.00% | 2.08% | 2.01% |
| 1972 | 48.00% | 2.92% | 2.32% |
| 1973 | 48.00% | 2.41% | 2.21% |
| 1974 | 48.00% | 1.41% | 1.77% |
| 1975 | 48.00% | 1.16% | 1.95% |
| 1976 | 48.00% | 0.84% | 1.75% |
| 1977 | 48.00% | 0.20% | 1.43% |
| 1978 | 48.00% | 0.49% | 1.12% |
| 1979 | 46.00% | 0.69% | 1.50% |
| 1980 | 46.00% | 0.19% | 0.87% |
| 1981 | 46.00% | -0.22% | 0.75% |
| 1982 | 46.00% | -0.56% | 0.20% |
| 1983 | 46.00% | -0.78% | 0.61% |
| 1984 | 46.00% | -0.67% | 1.11% |
| 1985 | 46.00% | -0.24% | 1.63% |
| 1986 | 46.00% | -0.03% | 1.61% |
| 1987 | 40.00% | -0.34% | 2.04% |
| 1988 | 34.00% | -0.48% | 1.65% |
| 1989 | 34.00% | -0.35% | 1.27% |
| 1990 | 34.00% | -0.44% | 1.21% |
| 1991 | 34.00% | -0.58% | 0.96% |
| 1992 | 34.00% | -0.17% | 1.61% |
| 1993 | 35.00% | -0.05% | 1.43% |
| 1994 | 35.00% | 0.01% | 1.46% |
| 1995 | 35.00% | 0.05% | 1.17% |
| 1996 | 35.00% | 0.10% | 1.51% |
| 1997 | 35.00% | 0.19% | 1.05% |
| 1998 | 35.00% | 0.63% | 1.40% |
| 1999 | 35.00% | 0.88% | 1.70% |
| 2000 | 35.00% | 1.12% | 2.20% |
| 2001 | 35.00% | 1.40% | 2.02% |
| 2002 | 35.00% | 1.58% | 2.32% |
| 2003 | 35.00% | 1.32% | 2.59% |
| 2004 | 35.00% | 0.93% | 2.66% |
| 2005 | 35.00% | 0.74% | 2.52% |
| 2006 | 35.00% | 0.48% | 2.31% |
| 2007 | 35.00% | 0.23% | 1.86% |
| 2008 | 35.00% | 0.01% | 1.20% |
| 2009 | 35.00% | 0.88% | 1.07% |
| 2010 | 35.00% | 1.15% | 1.32% |
| 2011 | 35.00% | 0.88% | 1.22% |
| 2012 | 35.00% | 0.55% | 1.18% |
| 2013 | 35.00% | 0.65% | 1.21% |
| 2014 | 35.00% | -0.05% | 0.90% |
| 2015 | 35.00% | 0.12% | 0.41% |
| 2016 | 35.00% | 0.58% | 0.42% |
Source: Productivity is the 5-year average annual change in total economy productivity (TEP) measure using unpublished data from the Bureau of Labor Statistics (BLS). Pay growth measures real compensation of production and nonsupervisory workers, using data from the Current Employment Statistics (CES) program of the BLS and Table 7.8 from the National Income and Product Accounts (NIPA) of the Bureau of Economic Analysis (BEA), as described in Josh Bivens and Lawrence Mishel, Understanding the Historic Divergence between Productivity and Typical Workers’ Pay: Why It Matters and Why It’s Real, Economic Policy Institute, September 2, 2015.
The CEA report claimed that the wage-boosting effect of corporate tax cuts was “highly visible in the data” and presented as evidence a graph that showed faster unweighted wage growth over just two years in a set of “low-tax” countries relative to a set of “high-tax” countries. It is deeply puzzling just what this graph was supposed to prove. Most notably, there is no claim that corporate tax policy changed in the years analyzed by the CEA, and that these changes hence could be linked to differing wage outcomes. Even the CEA report itself implicitly confirms that corporate tax policy changes are the correct variable to assess. In a later section of its report, the CEA praises another study for assessing “long-run outcomes…[that should be] thought of as the recurring flow of income after the corporate tax changes have fully taken hold” (emphasis added). Showing a short-run graph that has results that are driven by corporate tax levels rather than changes completely fails to demonstrate that the benefits to wage growth of cutting corporate taxes are “clearly visible in the data.”
Using data from the Organization for Economic Cooperation and Development, we were able to essentially replicate the CEA results. The most striking finding is that the fast wage growth of the “low-tax countries” highlighted by the CEA in 2015 and 2016 was driven disproportionately by three small countries: Estonia (6.6 percent average wage growth in those years), Iceland (7.5 percent average wage growth), and Latvia (6.8 percent average wage growth). These three countries combined account for 30 percent of the unweighted “low-tax” sample but well over half of the wage growth in the low-tax group, yet their GDPs combined represent less than 0.4 percent of U.S. GDP.
Finally, we use this same OECD data to show changes in corporate tax rates and cumulative wage growth from 2000 to 2016 (see Figure 4). This assessment that is longer-run and examines the effect of corporate rate changes on wage growth is much more relevant for testing theoretical predictions about changing corporate rates and wages. This figure shows that there is no obvious correlation between corporate rate changes and wages; again the beneficial effect of cutting corporate taxes on wages is absolutely not “highly visible in the data.” In fact, the simple slope of the line through the scatterplot is positive, indicating that steeper cuts in corporate rates (the farther to the left of zero) were associated with slower wage growth (slightly and insignificantly, to be sure, as rate cuts just don’t affect wages much).
No visible correlation between corporate tax rate changes and real earnings growth: Percentage-point change in overall statutory corporate income tax rate and cumulative annual earnings growth across OECD countries, 2000–2016
| Percentage point corporate rate change | Cumulative real earnings growth | |
|---|---|---|
| Australia | -0.04 | 1.02% |
| Austria | -0.09 | 0.57% |
| Belgium | -0.0618 | 0.23% |
| Canada | -0.1573 | 1.37% |
| Chile | 0.09 | 2.11% |
| Czech Republic | -0.12 | 2.67% |
| Denmark | -0.1 | 1.38% |
| Estonia | -0.06 | 4.07% |
| Finland | -0.09 | 1.05% |
| France | -0.03333 | 1.12% |
| Germany | -0.21858 | 0.72% |
| Greece | -0.11 | -0.19% |
| Hungary | 0.01 | 1.89% |
| Iceland | -0.1 | 1.17% |
| Ireland | -0.115 | 1.70% |
| Israel | -0.11 | 0.13% |
| Italy | -0.09957 | 0.18% |
| Japan | -0.109 | -0.08% |
| Korea | -0.066 | 1.45% |
| Latvia | -0.1 | 4.80% |
| Luxembourg | -0.0823 | 0.86% |
| Mexico | -0.05 | 0.43% |
| Netherlands | -0.1 | 0.77% |
| New Zealand | -0.05 | 1.62% |
| Norway | -0.03 | 2.10% |
| Poland | -0.11 | 1.62% |
| Portugal | -0.057 | -0.33% |
| Slovak Republic | -0.07 | 2.48% |
| Slovenia | -0.08 | 1.77% |
| Spain | -0.1 | 0.40% |
| Sweden | -0.06 | 1.62% |
| Switzerland | -0.03777 | 0.81% |
| United Kingdom | -0.1 | 0.86% |
| United States | -0.00416 | 0.93% |
Source: Corporate tax rates and real annual earnings data come from OECD.Stat website, accessed October 2017. Earnings are in 2016 U.S. dollars on a purchasing power parity (PPP) basis.
The key theory behind claims that corporate rate cuts will boost wages is the idea that these rate cuts will lead to substantially faster investment in productivity-enhancing plants and equipment, boosting the nation’s capital stock and making workers more productive.13 We can assess the first link in that chain of causation below, asking simply “are lower corporate tax rates associated with a larger capital stock”? Figure 5 shows a scatterplot of the relationship between the average statutory corporate tax rate between 2000 and 2014 and the capital-to-labor ratio in 2014. The hypothesis is that low-tax countries should have attracted more capital investment and hence should have accumulated a large stock of capital relative to their workforce by the end of the period. As the trend line through the scatter indicates, the relationship actually goes the wrong way—countries with higher corporate tax rates over this period had larger capital stocks by 2014.
Corporate tax rate and capital/labor ratios, 2000–2014
| K/L ratio | Statutory corporate rate, 2000–2014 | |
|---|---|---|
| Australia | 182.8329 | 30.26667 |
| Austria | 262.5172 | 28 |
| Belgium | 298.089 | 35.358 |
| Canada | 191.871 | 32.74267 |
| Chile | 75.21385 | 17.5 |
| Czech Republic | 193.119 | 24.13333 |
| Denmark | 267.3966 | 27.16667 |
| Estonia | 128.1263 | 23.06667 |
| Finland | 235.0594 | 26.4 |
| France | 300.7382 | 35.71778 |
| Germany | 260.2171 | 35.79182 |
| Greece | 246.2434 | 28.96667 |
| Hungary | 137.8224 | 18.422 |
| Iceland | 173.7514 | 19.73333 |
| Ireland | 293.9928 | 14 |
| Israel | 107.7759 | 30.1 |
| Italy | 318.5824 | 35.23188 |
| Japan | 162.3044 | 39.55467 |
| Latvia | 197.6737 | 27.06 |
| Lithuania | 127.8631 | 17.06667 |
| Luxembourg | 284.8344 | 30.56867 |
| Mexico | 60.78366 | 31 |
| Netherlands | 282.5934 | 29.10667 |
| New Zealand | 110.3023 | 31.06667 |
| Norway | 330.132 | 27.93333 |
| Poland | 64.21466 | 21.46667 |
| Portugal | 240.299 | 29.86 |
| Slovakia | 134.9736 | 21.6 |
| Slovenia | 224.178 | 22.2 |
| Spain | 283.7168 | 32.5 |
| Sweden | 232.1265 | 26.74667 |
| Switzerland | 242.5745 | 22.29283 |
| Turkey | 101.9937 | 24.8 |
| United Kingdom | 227.7329 | 27.86667 |
| United States | 201.734 | 39.2318 |
Source: Data from the Penn World Tables 9.0
This irrelevance of corporate tax rates for the wage growth of typical workers is confirmed by looking across U.S. states as well. These states are in many ways the best possible candidates for providing any evidence that lower corporate taxes actually show up as higher wages. In the jargon of economists, these individual states can be thought of as “small and open” economies—meaning that their wages, prices, and interest rates are highly driven by influences external to the state economy. This is important because economic models that suggest that corporate income tax rate cuts could translate into large wage gains essentially require economies be small and open. If the data show that even individual U.S. states see little correlation between corporate rate cuts and wage growth, it is almost impossible to credibly claim that a cut in the federal corporate rate for the entire—clearly not “small and open”—U.S. economy would deliver wage growth.
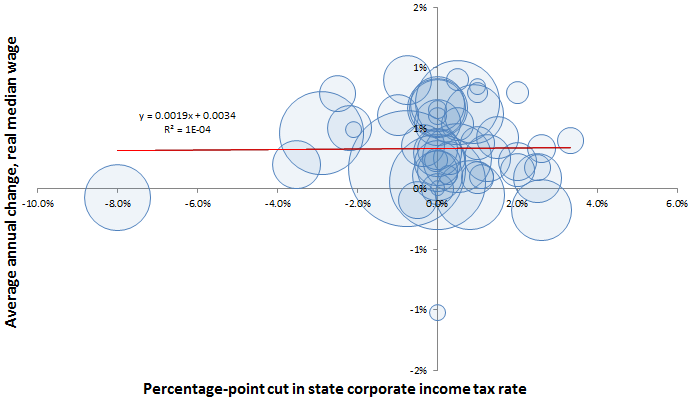
Figure 6 shows the change in state corporate income tax rates from 1980 to 2010 and the change in the inflation-adjusted state median wage in that period. There is no correlation at all visible in the data. This reveals a key truth policymakers should face: boosting wages will require a range of policies, and most of these useful wage-boosting policies will not involve taxes.14
Cutting corporate tax rates is not associated with gains in median wages: Percentage-point change in state corporate income tax rate and annualized growth in median wages, 1980–2010
| Corporate rate | Median wage | Population (weight) |
|---|---|---|
| 1.5% | 0.4% | 4.80E+06 |
| 0.0% | -1.0% | 710231 |
| -3.5% | 0.2% | 6.30E+06 |
| 0.5% | 0.5% | 2.90E+06 |
| -0.8% | 0.2% | 3.70E+07 |
| -0.4% | 0.4% | 5.00E+06 |
| -2.5% | 0.8% | 3.60E+06 |
| 0.0% | 0.7% | 897934 |
| 0.5% | 0.7% | 1.90E+07 |
| 0.0% | 0.7% | 9.70E+06 |
| 0.0% | 0.2% | 1.40E+06 |
| 1.1% | 0.1% | 1.60E+06 |
| 0.8% | -0.1% | 1.30E+07 |
| 2.5% | 0.1% | 6.50E+06 |
| 2.0% | 0.2% | 3.00E+06 |
| 0.3% | 0.3% | 2.90E+06 |
| 0.0% | 0.3% | 4.30E+06 |
| 0.0% | 0.1% | 4.50E+06 |
| 2.0% | 0.8% | 1.30E+06 |
| 0.0% | 0.5% | 5.80E+06 |
| -0.8% | 0.9% | 6.50E+06 |
| 2.6% | -0.2% | 9.90E+06 |
| -2.2% | 0.5% | 5.30E+06 |
| 1.0% | 0.4% | 3.00E+06 |
| 1.3% | 0.3% | 6.00E+06 |
| 0.3% | 0.1% | 989415 |
| 3.3% | 0.4% | 1.80E+06 |
| 0.0% | 0.0% | 2.70E+06 |
| 0.5% | 0.9% | 1.30E+06 |
| 0.0% | 0.7% | 8.80E+06 |
| 2.6% | 0.3% | 2.10E+06 |
| -2.9% | 0.5% | 1.90E+07 |
| 0.9% | 0.6% | 9.50E+06 |
| -2.1% | 0.5% | 672591 |
| -8.0% | -0.1% | 1.20E+07 |
| 2.0% | 0.2% | 3.80E+06 |
| -0.5% | -0.1% | 3.80E+06 |
| 0.5% | 0.3% | 1.30E+07 |
| 1.0% | 0.8% | 1.10E+06 |
| -1.0% | 0.6% | 4.60E+06 |
| 0.0% | 0.6% | 814180 |
| 0.0% | 0.3% | 6.30E+06 |
| 0.0% | 0.1% | 2.50E+07 |
| 1.0% | 0.1% | 2.80E+06 |
| 1.0% | 0.8% | 625741 |
| 0.0% | 0.7% | 8.00E+06 |
| 0.0% | 0.1% | 6.70E+06 |
| 2.5% | 0.2% | 1.90E+06 |
| 0.0% | 0.2% | 5.70E+06 |
| 0.0% | 0.0% | 563626 |
Source: EPI analysis of data on state corporate tax rates from Juan Carlos Suárez Serrato and Owen Zidar, "Who Benefits from State Corporate Tax Cuts? A Local Labor Markets Approach with Heterogeneous Firms," American Economic Review, 106 (9): 2582-2624 [2016 working paper version] (summary data here). Data on state median wages from the Current Population Survey Outgoing Rotation Groups (ORG). Data is deflated using the CPI-U-RS. Data points weighted by state population in 2010.
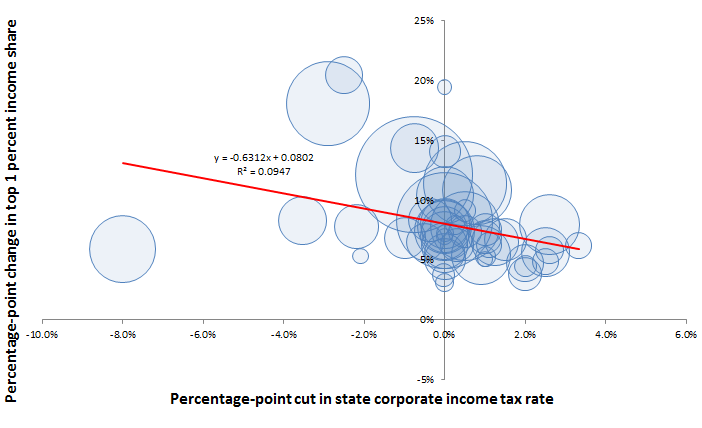
Are we sure that nobody in these states will see any gain from cutting corporate taxes? No. Figure 7 looks at the same 1980 to 2010 period and shows the relationship between the change in state corporate income tax rates and the change in the share of total state income claimed by the richest 1 percent of households. Here the correlation (evidenced by the downward sloping trend line) is clearer: a reduction in the corporate rate is associated with an increase in the share of total income claimed by the top 1 percent.
Cutting corporate rates boosts top 1 percent incomes: Percentage-point change in state corporate income tax rates and top 1 percent income share, 1980–2010
| Corporate rate | Top 1 percent income share | Population (weight) |
|---|---|---|
| 1.5% | 6.7% | 4.80E+06 |
| 0.0% | 7.0% | 710231 |
| -3.5% | 8.3% | 6.30E+06 |
| 0.5% | 7.4% | 2.90E+06 |
| -0.8% | 12.1% | 3.70E+07 |
| -0.4% | 8.3% | 5.00E+06 |
| -2.5% | 20.5% | 3.60E+06 |
| 0.0% | 3.1% | 897934 |
| 0.5% | 11.4% | 1.90E+07 |
| 0.0% | 7.5% | 9.70E+06 |
| 0.0% | 3.8% | 1.40E+06 |
| 1.1% | 6.2% | 1.60E+06 |
| 0.8% | 10.8% | 1.30E+07 |
| 2.5% | 5.7% | 6.50E+06 |
| 2.0% | 3.9% | 3.00E+06 |
| 0.3% | 6.2% | 2.90E+06 |
| 0.0% | 5.6% | 4.30E+06 |
| 0.0% | 5.1% | 4.50E+06 |
| 2.0% | 4.5% | 1.30E+06 |
| 0.0% | 6.2% | 5.80E+06 |
| -0.8% | 14.3% | 6.50E+06 |
| 2.6% | 8.0% | 9.90E+06 |
| -2.2% | 7.8% | 5.30E+06 |
| 1.0% | 6.9% | 3.00E+06 |
| 1.3% | 6.5% | 6.00E+06 |
| 0.3% | 8.0% | 989415 |
| 3.3% | 6.2% | 1.80E+06 |
| 0.0% | 14.1% | 2.70E+06 |
| 0.5% | 9.1% | 1.30E+06 |
| 0.0% | 10.4% | 8.80E+06 |
| 2.6% | 5.8% | 2.10E+06 |
| -2.9% | 18.1% | 1.90E+07 |
| 0.9% | 5.4% | 9.50E+06 |
| -2.1% | 5.3% | 672591 |
| -8.0% | 5.9% | 1.20E+07 |
| 2.0% | 4.8% | 3.80E+06 |
| -0.5% | 6.5% | 3.80E+06 |
| 0.5% | 7.8% | 1.30E+07 |
| 1.0% | 5.3% | 1.10E+06 |
| -1.0% | 6.8% | 4.60E+06 |
| 0.0% | 7.2% | 814180 |
| 0.0% | 7.1% | 6.30E+06 |
| 0.0% | 8.3% | 2.50E+07 |
| 1.0% | 7.6% | 2.80E+06 |
| 1.0% | 5.1% | 625741 |
| 0.0% | 7.8% | 8.00E+06 |
| 0.0% | 8.1% | 6.70E+06 |
| 2.5% | 4.9% | 1.90E+06 |
| 0.0% | 7.6% | 5.70E+06 |
| 0.0% | 19.5% | 563626 |
Source: EPI analysis of data on state corporate tax rates from Juan Carlos Suárez Serrato and Owen Zidar, "Who Benefits from State Corporate Tax Cuts? A Local Labor Markets Approach with Heterogeneous Firms," American Economic Review, 106 (9): 2582-2624 [2016 working paper version] (summary data here). Data on top 1 percent income shares by state from the Frank-Price-Sommeiller state income data. Data points weighted by state population in 2010.
Conclusion
The case that large, deficit-financed corporate tax cuts will boost capital investment, productivity, and wages in the United States is extraordinarily weak. Evidence from past changes in federal taxes, from cross-national comparisons, and from the experiences of individual U.S. states all argue strongly that wages for typical Americans will not benefit from the TCJA.
Claims that the meager data collected so far—data that show no trend break at all in capital investment or wage growth—already indicate a large, positive impact of the TCJA are simply not credible. All in all, the TCJA will serve to boost incomes for the already-rich while doing nothing to help the wages of typical American workers. Additionally, the TCJA is likely to increase incentives to offshore production and profits of American firms. We can certainly do better for America’s workers than the TCJA, and future Congresses should.
Endnotes
1. For this estimate, see Tax Policy Center, Distributional Analysis of the Conference Agreement for the Tax Cuts and Jobs Act, December 18, 2017.
2. These claims and an assessment of them can be found in Josh Bivens and Hunter Blair, Competitive Distractions: Cutting Corporate Tax Rates Will Not Create Jobs or Boost Incomes for the Vast Majority of American Families, Economic Policy Institute, May 9, 2017 and in Josh Bivens, Cutting Corporate Taxes Will Not Boost American Wages, Economic Policy Institute, October 25, 2017.
3. For this number, see “38 Percent of Private Industry Workers Had Access to Nonproduction Bonuses in 2017,” The Economics Daily (from the Bureau of Labor Statistics), December 21, 2017.
4. See Daniel Hemel and David Kamin, “Yes — the Tax Law Could Be Causing Corporations to Pay Bonuses. But It May Be a Tax Game That Won’t Last,” Medium, January 27, 2018.
5. See Kevin Hassett, “The Wages of Tax Reform are Going to America’s Workers,”Wall Street Journal, April 17, 2018.
6. For evidence on this disconnect between economy-wide growth and typical workers’ pay, see Josh Bivens and Lawrence Mishel, Understanding the Historic Divergence between Productivity and Typical Workers’ Pay: Why It Matters and Why It’s Real, Economic Policy Institute, September 2, 2015.
7. For evidence on this, see the references in footnote 2, particularly Figure D in Competitive Distractions: Cutting Corporate Tax Rates Will Not Create Jobs or Boost Incomes for the Vast Majority of American Families.
8. See Akane Otani, Ben Eisen, and Chelsey Dulaney, “Capital Spending Boom Is No Great Boost to Capital Markets,” Wall Street Journal, May 15, 2018.
9. This assumes that the $166 billion total capital investment number from Otani, Eisen, and Dulaney’s 2018 article in the Wall Street Journal (from the previous footnote) is correct. This number is then compared with total private nonresidential fixed investment from the Bureau of Economic Analysis.
10. For evidence on this, see Kimberly Clausing, “Profit Shifting and Offshoring, Then and Now,” and Rebecca Kysar, “Profit Shifting and Offshoring in the New International Regime,” presentations for “Will the Trump Tax Cuts Accelerate Offshoring by U.S. Multinational Corporations,” a conference hosted by the Economic Policy Institute, May 7, 2018.
11. See Council of Economic Advisers, Corporate Tax Reform and Wages: Theory and Evidence, October 2017.
12. See Josh Bivens, Cutting Corporate Taxes Will Not Boost American Wages, Economic Policy Institute, October 25, 2017.
13. Again, we would note a previous EPI report finding that productivity growth alone has not boosted typical workers’ wages in recent decades (see Josh Bivens and Lawrence Mishel, Understanding the Historic Divergence between Productivity and Typical Workers’ Pay: Why It Matters and Why It’s Real, Economic Policy Institute, September 2, 2015). Complementary policies that ensure this productivity growth actually translates into broad-based growth in labor compensation are also needed.
14. For evidence on policies that will work to boost wages, see Ross Eisenbrey and Lawrence Mishel, “How to Raise Wages: Policies That Work and Policies That Don’t,” Economic Policy Institute, March 19, 2015.
