Infographic: How do we know that tough work environments are a factor in the teacher shortage?
This report is the fourth in a series examining the magnitude of the teacher shortage and the working conditions and other factors that contribute to the shortage.
What this series finds: The teacher shortage is real, large and growing, and worse than we thought. When indicators of teacher quality (certification, relevant training, experience, etc.) are taken into account, the shortage is even more acute than currently estimated, with high-poverty schools suffering the most from the shortage of credentialed teachers.
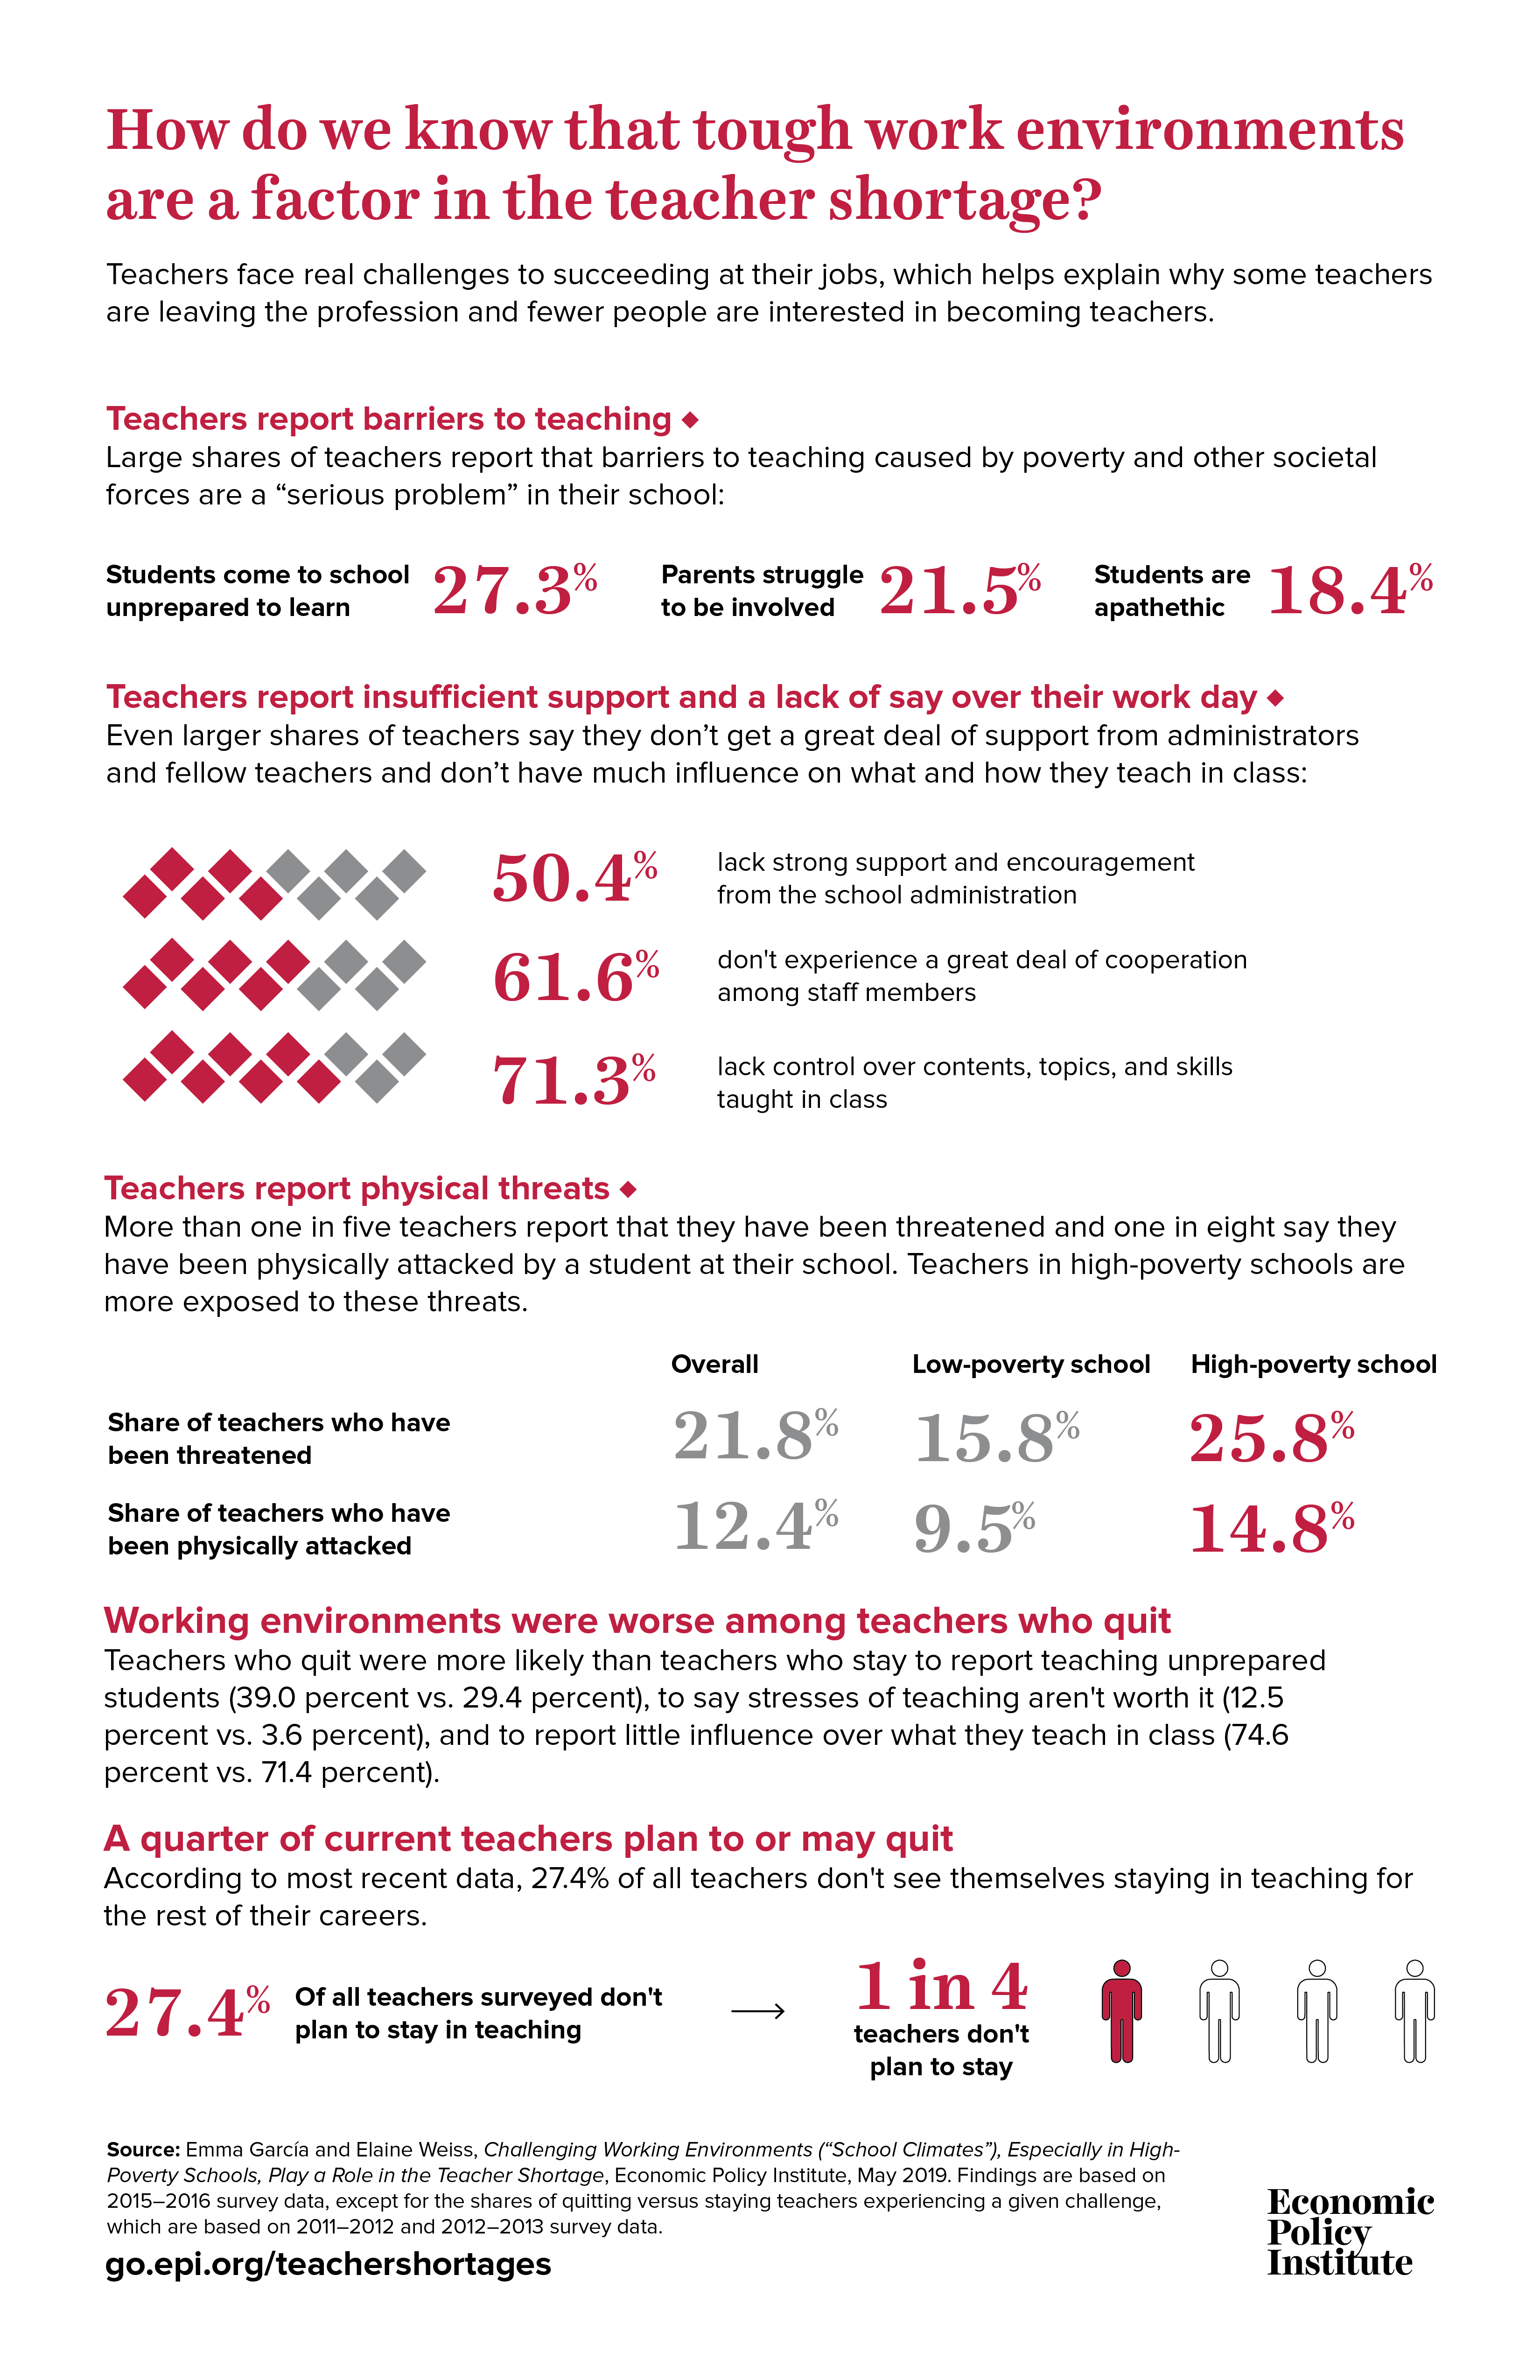
What this report finds: The working environment for teachers—broadly referred to here as “school climate”—is tough. Students are coming to school unprepared to learn (as reported by 27.3 percent of teachers), parents are struggling to be involved (as reported by 21.5 percent of teachers), and other conditions impede teaching. These conditions are largely byproducts of larger societal forces such as rising poverty, segregation, and insufficient public investments. In addition to barriers to teaching, teachers face threats to their safety. More than one in five teachers (21.8 percent) report that they have been threatened and one in eight (12.4 percent) say they have been physically attacked by a student at their current school. Compounding the stress, teachers report a level of conflict with—and lack of support from—administrators and fellow teachers, and little say in their work. More than two-thirds of teachers report that they have less than a great deal of influence over what they teach in the classroom (71.3 percent) and what instructional materials they use (74.5 percent), which suggests low respect for their knowledge and judgment.
Not surprisingly, one in 20 teachers (4.9 percent) say that the stress and disappointments involved in teaching are not worth it. Considerably larger shares of teachers express some level of dissatisfaction with being a teacher in their school (48.7 percent), say they think about leaving teaching at some point (27.4 percent), or are not certain that they would still become teachers if they could go back to college and make a decision again (57.5 percent). (All these data on school climate indicators are for the 2015–2016 school year except for the share of teachers who in 2011–2012 said they are not sure they would become teachers if they could start over again.)
And, paralleling the finding in the series’ previous reports, teachers in high-poverty schools have it worse: relative to their peers in low-poverty schools, larger shares of teachers in high-poverty schools report barriers to teaching, threats to physical safety and attacks, a lack of supportive relationships, and little autonomy in the classroom.
Our data suggest a relationship between tough climates and quitting. When we compare teachers who end up quitting with those who stay, we find that larger shares of quitting teachers had reported, prior to leaving, that they were teaching unprepared students (39.0 percent vs. 29.4 percent), experiencing demoralizing stress (12.5 percent vs. 3.6 percent), lacking strong influence over what they teach in class (74.6 percent vs. 71.4 percent), and not being fully satisfied with teaching at their school (60.5 percent vs. 43.3 percent). Indeed, the share of teachers who felt that the stress and disappointments involved in teaching weren’t really worth it was 3.5 times as large among those who ended up quitting than among those who stayed.
Why it matters: Working environments clearly play a role in the teacher shortage, along with low pay (as shown in our last report) and weak professional development opportunities (as will be shown in our next report). The teacher shortage harms students, teachers, and public education as a whole. In addition, the fact that the shortage is more acute in high-poverty schools challenges the U.S. education system’s goal of providing a sound education equitably to all children.
What we can do about it: Tackle the poor school climate, low relative pay, and other factors that are prompting teachers to quit and dissuading people from entering the teaching profession. With regard to working environments, we need policy interventions and institutional decisions that channel assistance and resources to teachers who press on despite barriers to teaching, stress and physical threats, a lack of support by administrators, little influence over their day-to-day work, and low satisfaction. High-poverty schools and their teachers require extra resources and funding to support students directly and to reduce the teacher shortage.
Update, October 2019: The National Center for Education Statistics (NCES) has announced that weights developed for the teacher data in the 2015–2016 National Teacher and Principal Survey (NTPS) were improperly inflated and that new weights will be released (release date to be determined). According to the NCES, counts produced using the original weights would be overestimates. The application of the final weights, when they are available, is not likely to change the estimates of percentages and averages (such as those we report in our analyses) in a statistically significant way. EPI will update the analyses in the series once the new weights are published but does not expect any data revisions to change the key themes described in the series. Please note that EPI analyses produced with 2011–2012 Schools and Staffing Survey (SASS) data, 2012–2013 Teacher Follow-Up Survey (TFS) data, and 2015–2016 NTPS school-level data are unaffected by NCES’s reexamination.
Introduction
The teacher shortage—the gap between the number of qualified teachers needed and available for hire in a given year—in the nation’s K–12 schools is an increasingly recognized but still poorly understood crisis. The shortage is discussed by the media and policymakers, and researchers have estimated its size (about 110,000 teachers in the 2017–2018 school year, up from no shortage before 2013, according to Sutcher, Darling-Hammond, and Carver-Thomas 2016) and even quantified part of its cost.1 The shortage constitutes a crisis because of its negative effects on students, teachers, and the education system at large. But it is poorly understood because the reasons for it are complex and interdependent. The first report in this series, The Teacher Shortage Is Real, Large and Growing, and Worse Than We Thought (García and Weiss 2019a), established that current national estimates of the teacher shortage likely understate the magnitude of the problem: When issues such as teacher qualifications and the unequal distribution of highly credentialed teachers across high- and low-poverty schools are taken into consideration, the teacher shortage problem is much more severe than previously identified.
The second report in this series, U.S. Schools Struggle to Hire and Retain Teachers (García and Weiss 2019b), built on the research in the first report and used the same quality and equity angles. It showed that schools are having difficulties filling teacher vacancies and are leaving vacancies unfilled despite actively trying to hire teachers to fill them. High-poverty schools are hit hardest: They find it more difficult to fill vacancies than do low-poverty schools and schools overall, and they experience higher turnover and attrition than low-poverty schools. One factor behind staffing difficulties is the high share of public school teachers leaving their posts: 13.8 percent are either leaving their school or leaving teaching altogether, according to most recent data. Another factor is the dwindling pool of applicants to fill vacancies: from the 2008–2009 to 2015–2016 school years, the number of education degrees awarded fell by 15.4 percent and the number of people who completed a teacher preparation program fell by 27.4 percent. Schools are also having a harder time retaining credentialed teachers, as evident in the small but growing share of all teachers who are newly hired and in their first year of teaching (4.7 percent) and in the substantial shares of teachers who quit who are certified and experienced. Retaining credentialed teachers is also more difficult for high-poverty schools.
The third report in the series focused on a likely factor behind why teachers are leaving the profession and fewer people are becoming teachers: teacher pay. Specifically, Low Relative Pay and High Incidence of Moonlighting Play a Role in the Teacher Shortage, Particularly in High-Poverty Schools (García and Weiss 2019c) described how teacher compensation compares with compensation in nonteaching occupations, and called attention to the high share of teachers who supplement their earnings by moonlighting. The report found a correlation between measures of teacher compensation and teachers leaving the profession: specifically, it found that teachers who ended up quitting teaching reported, in the year before they quit, receiving on average, lower salaries; participating less in the kinds of paid extracurricular activities that complement their professional development (activities like coaching students or mentoring teachers); and participating more in working options outside the school system than did teachers who stayed at their schools. In high-poverty schools, teachers face compounded challenges. Relative to teachers in low-poverty schools, teachers in high-poverty schools are paid less, receive a smaller amount from moonlighting, and the moonlighting that they do is less likely to involve paid extracurricular or additional activities for the school system that generate extra pay but also help teachers grow professionally.
This report, the fourth in the series, explores another likely factor behind the exodus of teachers from the profession and the shrinking supply of future teachers: the working environment for teachers, broadly referred to here as the “school climate.” We show that school climate affects teacher satisfaction, morale, and expectations about staying in the profession. We show that school climate is challenging for a number of reasons: Teachers confront widespread barriers to teaching and learning, face threats to their emotional and physical safety, lack influence over school policy and what and how they teach in their classrooms, and suffer from dissatisfaction and low motivation. We also demonstrate that there is a significant relationship between these indicators of difficult working conditions and teachers leaving the profession. And finally, as in previous reports, we provide evidence that working conditions are more challenging in high-poverty schools than in low-poverty schools, which compounds the problems already identified in this series. The findings suggest that efforts to address teacher shortages must be holistic and include initiatives to improve school climates, especially in high-poverty schools where teacher shortages and school climate problems are most serious. The next paper in this series follows up with a discussion about teacher training and supports, which also have the potential to alter the availability of teachers and therefore interact with these other factors to drive shortages.
School climate is an issue across the board and it is implicated in the teacher shortage
The environment in which an employee works has a major impact on not just job satisfaction but also on the ability to do the job well and the desire to continue to remain in the job and the profession. This is certainly true for teachers, who spend much of their time interacting with students, fellow teachers, and other school staff and thus are immersed in their workplace climate to a high degree. Teachers in the vast majority of contexts are prepared—able and trained—to deal with the challenges of their vocation. However, there are certain challenges related to the working environment that teachers should not have to deal with or that they are ill-equipped to handle and still do their jobs well.
This report addresses the challenges that arise from poor school climate, and resulting low motivation and satisfaction. A school’s climate is “the quality and character of school life” (The National School Climate Center 2019). It is composed of several areas, including relationships between teachers and administrators and students, school safety, the institutional environment, and the school improvement process (Thapa et al. 2013).2 In this paper, we look at the shares of teachers who face barriers that impede teaching (such as student poverty and poor student health), threats to their safety, a lack of voice and influence over school policy decisions, and a lack of autonomy in the classroom. We then explore the level of morale and satisfaction among teachers, which could be a result of school climate and of other influences (such as pay) described in our series of reports.
Importantly, most of the factors that together create a school’s climate are themselves shaped by larger societal forces such as rising poverty, ongoing racial and economic segregation of schools, and insufficient public investments. Because these larger societal forces contribute to deteriorating working conditions in schools, they cannot be blamed on students, parents, and teachers. (As just one example, students who come to school in poor health because they do not have access to medical care or to assistance programs that provide them with nutritional foods aren’t as prepared to learn as they could be.3) Thus, addressing the poverty- and inequality-related factors that help create a challenging school climate requires investing not only in excellent educators, but also in social workers, physicians, counselors, nurses, and other professionals operating outside the traditional education policy domains (García 2015; García and Weiss 2017a). Research shows that policies to improve school climate could improve the odds that teachers stay in the profession.4 But a poor school climate is not just a factor in the teacher shortage; it can also impede student learning and school performance, lessen teacher effectiveness and morale, and damage the health of the profession overall.5
School climate is shaped by barriers to teaching and learning
Teacher surveys point to a number of conditions among the student body that impede teaching and negatively influence student performance. These conditions include behaviors and factors such as student tardiness and absenteeism, parents’ struggles to be involved in their children’s schools, student disengagement, poor student health, and insufficient student preparation for instruction.6 Across the board, the National Teacher and Principal Survey (NTPS) data we analyzed show that large shares of teachers see these factors as serious problems in their schools, and increasingly so, since a number of these problems worsened between the 2011–2012 and 2015–2016 school years.
As shown in Table 1, in 2015, the share of teachers reporting that various factors were “serious problems” in their schools ranged from around 5 percent for poor student health and class-cutting to nearly 30 percent for poverty specifically and students’ unreadiness to learn. A third set of barriers whose degree of severity falls between these two extremes includes tardiness, cited as a serious problem by 12.1 percent of teachers; absenteeism, cited by 14.9 percent of teachers; apathy among students, reported by 18.4 of teachers; and lack of parental involvement, which more than one in five teachers (21.5 percent) sees as a serious problem in their school.
Barriers that pose serious problems to teaching and to student learning: Share of teachers reporting that factor is a "serious problem," all schools and in low- and high-poverty schools
| All | Low-poverty | High-poverty | Gap (high- minus low-poverty school) | Ratio high-/low-poverty | |
|---|---|---|---|---|---|
| Poverty | 28.8% | 9.5% | 45.1% | 35.6 ppt. | 4.7 |
| Students come to school unprepared to learn | 27.3% | 12.1% | 38.6% | 26.5 ppt. | 3.2 |
| Lack of parental involvement | 21.5% | 9.1% | 31.2% | 22.1 ppt. | 3.4 |
| Student apathy | 18.4% | 11.1% | 22.3% | 11.3 ppt. | 2.0 |
| Student absenteeism | 14.9% | 8.0% | 19.7% | 11.7 ppt. | 2.5 |
| Student tardiness | 12.1% | 6.1% | 16.6% | 10.5 ppt. | 2.7 |
| Poor student health | 5.1% | 2.0% | 8.1% | 6.1 ppt. | 4.1 |
| Student class-cutting | 5.0% | 2.5% | 6.5% | 4.0 ppt. | 2.6 |
Note: Data are for teachers in public noncharter schools. The table shows for each of the factors listed in the table the share of teachers who answered "serious problem" to the question, “To what extent is each of the following a problem in this school?” (other potential responses were "moderate problem," "minor problem," and "not a problem"). A teacher is in a low-poverty school if less than 25 percent of the student body in his/her classroom is eligible for free or reduced-price lunch programs; a teacher is in a high-poverty school if 50 percent or more of the student body is his/her classroom is eligible for those programs.
Source: 2015–2016 National Teacher and Principal Survey (NTPS) microdata from the U.S. Department of Education's National Center for Education Statistics (NCES)
These data affirm our previous reports’ assertions that it is harder to attract and retain teachers in high-poverty schools (see García and Weiss 2019a; 2019b; 2019c). Across all aspects described in Table 1, the share of teachers viewing a given factor as a “serious problem” is between two and nearly five times as high in high-poverty schools relative to low-poverty schools.7
The degree to which poor student health is a problem is one particularly troubling example of greater challenges in high-poverty schools. In high-poverty schools, 8.1 percent of teachers pointed to this issue as a challenge, compared with just 2.0 percent in low-poverty schools. This illustrates the striking disparity in the conditions in which those two groups of teachers are trying to do their jobs—students who are ill are not only more likely to miss a lot of school, but to struggle to focus when they are in class and thus to learn more slowly.8 The data also provide confirmation of well-documented opportunity gaps by socioeconomic status that are associated with achievement gaps: an alarming 38.6 percent of teachers in high-poverty schools report students coming to their classrooms underprepared to learn, versus 12.1 percent of teachers in low-poverty schools.
In our earlier reports we showed the high-poverty schools can also be characterized as harder-to-staff schools (García and Weiss 2019a; 2019b; 2019c). Table 1 here shows that teachers in hard-to-staff/high-poverty schools face additional challenges relative to teachers in low-poverty schools, including higher rates of class-cutting (6.5 percent vs. 2.5 percent, tardiness (16.6 vs. 6.1 percent), student apathy (22.3 percent vs. 11.2 percent) and parents who struggle to engage with the school (31.2 vs. 9.1 percent).9 Finally, teachers weighed in on a topic that has gained national policy attention: student absenteeism. The shares of teachers who report student absenteeism being a problem vary widely across schools.10 Only 8.0 percent of teachers in low-poverty schools reported absenteeism as a serious problem, versus more than double that, 19.7 percent, of teachers in high-poverty schools reporting absenteeism as a serious problem.
Teachers report stress and a lack of safety
The set of school climate indicators in Table 2 speaks to the emotional and mental health, and physical safety, of teachers in the workplace. Across all teachers, one in 20 teachers reports that the stress and disappointments of teaching “aren’t really worth it”: 4.9 percent of teachers strongly agree with that assertion, and, when we look at the 2011–2012 Schools and Staffing (SASS) survey, we see that the share is up slightly from 4.4 percent in 2011. A much larger share of teachers (13.1 percent) strongly agree that student misbehavior interferes with their ability to teach. Most concerning, more than one in five teachers (21.8 percent) report that they have been threatened by a student at the school where they currently teach, and one in eight (12.4 percent) report that they were physically attacked by a student at their current school. Without discussion, these indicators shape the work environment and conditions, and can contribute to shortages by making the profession less attractive.
Teacher's stress and physical safety: Share of teachers reporting that they have been affected by serious stress and safety issues at school, all schools and in low- and high-poverty schools
| All | Low-poverty | High-poverty | Gap (high- minus low-poverty school) | Ratio | |
|---|---|---|---|---|---|
| Share of teachers who responded “strongly agree” to the statements: | |||||
| The stress and disappointments involved in teaching at this school aren’t really worth it | 4.9% | 3.8% | 5.9% | 2.2 ppt. | 1.6 |
| The level of student misbehavior in this school (such as noise, horseplay or fighting in the halls, cafeteria, or student lounge) interferes with my teaching | 13.1% | 7.2% | 17.1% | 9.9 ppt. | 2.4 |
| Share of teachers who said that in their time at the school they have been: | |||||
| Threatened by a student | 21.8% | 15.8% | 25.8% | 10.0 ppt. | 1.6 |
| Physically attacked by a student | 12.4% | 9.5% | 14.8% | 5.2 ppt. | 1.5 |
Note: Data are for teachers in public noncharter schools. For the two statements listed in the top panel, teachers were asked to check whether they "strongly agree," "somewhat agree," "somewhat disagree," or "strongly disagree." A teacher is in a low-poverty school if less than 25 percent of the student body in his/her classroom is eligible for free or reduced-price lunch programs; a teacher is in a high-poverty school if 50 percent or more of the student body is his/her classroom is eligible for those programs.
Source: 2015–2016 National Teacher and Principal Survey (NTPS) microdata from the U.S. Department of Education's National Center for Education Statistics (NCES)
Like the previous indicators of a difficult school climate, stress and lack of safety are more acute problems in high-poverty schools than in low-poverty schools. For example, the share of teachers strongly agreeing that the stress and disappointments of teaching are not worth it is 2.2 percentage points higher in high-poverty schools than in low-poverty schools (5.9 percent versus 3.8 percent, or 1.6 times as large). The gap in the share of teachers frustrated with disruption due to student misbehavior reaches 10 percentage points. There is also a 10 percentage-point gap between the share of teachers who have been threatened by students in high-poverty schools and teachers threatened in low-poverty schools: more than one in four teachers in high-poverty schools has been threatened, compared with about one in six teachers in low-poverty schools. Finally, the shares of teachers who had been physically attacked (14.8 percent in high-poverty schools and 9.5 percent in low-poverty schools) greatly compounds the stress that makes today’s school climate tougher in high-poverty schools.
School climate is shaped by the relationships between teachers and administrators, colleagues, and parents
The relationships between teachers, a school’s administration, and the community more broadly shape a school’s working environment and climate, with repercussions for teachers and also for students (Bryk et al. 2010). This climate affects how well the school provides a learning community in which administrative supports and leadership are strong, there is time for peer collaboration, and employees share a strong sense of purpose. (In the next report, some of these indicators will be examined from the perspective of career supports and professional development.)
Our analysis shows unsatisfactory relationship patterns across the board. Table 3 presents seven attributes of a collegial and supportive school environment. In six of the seven categories reviewed in the table, less than half of teachers report strongly agreeing that the school has that attribute; in other words, less than half report being fully supported by the school administration, their colleagues, or the community in general. The one exception is a proxy of leadership: whether “the principal knows what kind of school he or she wants and has communicated it to the staff.” More than half (51.6 percent) of teachers surveyed said that principals exhibit that attribute. About half (49.6 percent) of teachers report that they see “supportive and encouraging behavior” by school administrators (a proxy for a positive working environment set by the administration). And slightly less than half (47.9 percent) strongly agrees with the statement, “I make a conscious effort to coordinate the content of my courses with that of other teachers” (a proxy of the community environment created by teachers to facilitate coordination, as will be explored further in the next report in the teacher shortage series). Only slightly more than a third of teachers strongly agree that “there is a great deal of cooperative effort among the staff members” (38.4 percent do) or that their colleagues share their views of what the school’s mission should be (36.0 percent). Fewer than one in three teachers affirm that they are recognized for a job well done (32.4 percent), and only 13.3 percent of teachers affirm that they receive a great deal of support from parents for the work they do. Put another way, the survey responses indicate that high shares of teachers experience some level of conflict or disagreement in their schools. Given this level of conflict, it is not surprising that teaching is an unattractive career option, both for people making decisions about their careers and for veteran teachers who are leaving the profession (García and Weiss 2019b).
Teachers' perceptions of being supported by administrators, colleagues, and parents of students: Shares of teachers who strongly agree and who do not strongly agree with the statements presented, in all schools and in low- and high-poverty schools
| All | Low-poverty | High-poverty | Gap (high- minus low-poverty) | |
|---|---|---|---|---|
| The principal knows what kind of school he or she wants and has communicated it to the staff. | ||||
| Strongly agrees (feels fully supported) | 51.6% | 53.4% | 50.8% | -2.6 ppt. |
| Does not strongly agree (experiences some level of conflict or disagreement) | 48.4% | 46.6% | 49.2% | 2.6 ppt. |
| The school administration’s behavior is supportive and encouraging. | ||||
| Strongly agrees (feels fully supported) | 49.6% | 52.0% | 47.9% | -4.1 ppt. |
| Does not strongly agree (experiences some level of conflict or disagreement) | 50.4% | 48.0% | 52.1% | 4.1 ppt. |
| I make a conscious effort to coordinate the content of my courses with that of other teachers. | ||||
| Strongly agrees (feels fully supported) | 47.9% | 50.0% | 47.4% | -2.6 ppt. |
| Does not strongly agree (experiences some level of conflict or disagreement) | 52.1% | 50.0% | 52.6% | 2.6 ppt. |
| There is a great deal of cooperative effort among the staff members. | ||||
| Strongly agrees (feels fully supported) | 38.4% | 41.0% | 36.6% | -4.4 ppt. |
| Does not strongly agree (experiences some level of conflict or disagreement) | 61.6% | 59.0% | 63.4% | 4.4 ppt. |
| Most of my colleagues share my beliefs and values about what the central mission of the school should be. | ||||
| Strongly agrees (feels fully supported) | 36.0% | 37.3% | 35.6% | -1.7 ppt. |
| Does not strongly agree (experiences some level of conflict or disagreement) | 64.0% | 62.7% | 64.4% | 1.7 ppt. |
| In this school, staff members are recognized for a job well done. | ||||
| Strongly agrees (feels fully supported) | 32.4% | 34.9% | 31.3% | -3.6 ppt. |
| Does not strongly agree (experiences some level of conflict or disagreement) | 67.6% | 65.1% | 68.7% | 3.6 ppt. |
| I receive a great deal of support from parents for the work I do. | ||||
| Strongly agrees (feels fully supported) | 13.3% | 20.6% | 9.4% | -11.2 ppt. |
| Does not strongly agree (experiences some level of conflict or disagreement) | 86.7% | 79.4% | 90.6% | 11.2 ppt. |
Notes: Data are for teachers in public noncharter schools. The table shows, for each of the statements listed, the share of teachers who responded that they “strongly agree” versus the share who checked one of the other options on the survey form: “somewhat agree,” “somewhat disagree,” or “strongly disagree.” The statement “I make a conscious effort to coordinate the content of my courses with that of other teachers” is a proxy for the community environment created by teachers to facilitate coordination; an answer of “strongly agrees” indicates that the teacher belongs to a supportive learning community. A teacher is considered to be in a low-poverty school if less than 25 percent of the students in his/her classroom are eligible for free or reduced-price lunch programs; a teacher is considered to be in a high-poverty school if 50 percent or more of the students in his/her classroom are eligible for those programs.
Source: 2015–2016 National Teacher and Principal Survey (NTPS) microdata from the U.S. Department of Education’s National Center for Education Statistics (NCES)
This scenario of a working environment with a degree of conflict or disagreement (which could be described as a poor learning community) is worse in high-poverty schools. A larger share of teachers in high-poverty schools indicate some level of conflict or disagreement in attitudes or beliefs from the administration or colleagues than do teachers in low-poverty schools. By far the biggest gap between high- and low-poverty schools is in support teachers receive from their students’ parents: almost nine out of 10 teachers in high-poverty schools do not feel fully supported by parents for the work they do compared with a still very high eight in 10 teachers in low-poverty schools. The gap in parental support affirms our previous comment in the discussion of Table 1 that schools’ and teachers’ struggles to engage with parents are especially difficult in high-poverty schools.
School climate is shaped by the voice and influence teachers have in their schools and day-to-day work
For teachers, having a sense of purpose and a say over the working conditions and policies of their school is an essential component of a positive school climate, and enhances teaching professionalism. But as shown in Table 4, meager shares of teachers report having a great deal of influence or control over school policy, suggesting a generalized disrespect for teachers’ knowledge of their jobs and professional judgment. A scant 3 percent of teachers report having a great deal of influence over how teachers are evaluated. Other school policy categories with shares under 10 percent are setting discipline policy and hiring new teachers. The category with the highest share of teachers reporting a great deal of influence is establishing the curriculum, but even then just one in five (20.4 percent) teachers have influence over the curriculum. To put it another way, 80 percent or more of teachers do not have a great deal of influence or control over the policies at their schools.
Teachers' influence over school policy and in the classroom: Shares of teachers reporting that they do and do not have a 'great deal' of influence/control over the factors presented, in all schools and in low- and high-poverty schools
| All | Low-poverty | High-poverty | Gap (high- minus low-poverty) | |
|---|---|---|---|---|
| School policy at this school | ||||
| Establishing curriculum | ||||
| A great deal of influence | 20.4% | 21.4% | 18.6% | -2.8 ppt. |
| Not a great deal of influence | 79.6% | 78.6% | 81.4% | 2.8 ppt. |
| Setting performance standards for students | ||||
| A great deal of influence | 17.6% | 17.8% | 17.5% | -0.3 ppt. |
| Not a great deal of influence | 82.4% | 82.2% | 82.5% | 0.3 ppt. |
| Determining the content of in-service professional development programs | ||||
| A great deal of influence | 11.1% | 11.6% | 10.9% | -0.7 ppt. |
| Not a great deal of influence | 88.9% | 88.4% | 89.1% | 0.7 ppt. |
| Setting discipline policy | ||||
| A great deal of influence | 8.9% | 8.5% | 9.7% | 1.2 ppt. |
| Not a great deal of influence | 91.1% | 91.5% | 90.3% | -1.2 ppt. |
| Hiring new full-time teachers | ||||
| A great deal of influence | 5.3% | 6.2% | 5.1% | -1.1 ppt. |
| Not a great deal of influence | 94.7% | 93.8% | 94.9% | 1.1 ppt. |
| Evaluating teachers | ||||
| A great deal of influence | 3.2% | 2.9% | 3.4% | 0.5 ppt. |
| Not a great deal of influence | 96.8% | 97.1% | 96.6% | -0.5 ppt. |
| Classroom planning and teaching | ||||
| Determining the amount of homework to be assigned | ||||
| A great deal of control | 68.3% | 67.6% | 67.8% | 0.2 ppt. |
| Not a great deal of control | 31.7% | 32.4% | 32.2% | -0.2 ppt. |
| Evaluating and grading students | ||||
| A great deal of control | 61.2% | 62.0% | 59.8% | -2.2 ppt. |
| Not a great deal of control | 38.8% | 38.0% | 40.2% | 2.2 ppt. |
| Disciplining students | ||||
| A great deal of control | 42.3% | 45.0% | 41.0% | -4.0 ppt. |
| Not a great deal of control | 57.7% | 55.0% | 59.0% | 4.0 ppt. |
| Selecting contents, topics, and skills to be taught | ||||
| A great deal of control | 28.7% | 29.2% | 27.0% | -2.2 ppt. |
| Not a great deal of control | 71.3% | 70.8% | 73.0% | 2.2 ppt. |
| Selecting textbooks and other instructional materials | ||||
| A great deal of control | 25.5% | 27.3% | 23.0% | -4.3 ppt. |
| Not a great deal of control | 74.5% | 72.7% | 77.0% | 4.3 ppt. |
Notes: Data are for teachers in public noncharter schools. The table shows the shares of teachers who answered “A great deal of [influence/control]” on the survey instrument versus “moderate,” “minor,” or “no [influence/control]” when asked “How much actual influence do you think teachers have over school policy at this school in each of the following areas?” or “How much actual control do you have in your classroom at this school over the following areas?” A teacher is considered to be in a low-poverty school if less than 25 percent of the students in his/her classroom are eligible for free or reduced-price lunch programs; a teacher is considered to be in a high-poverty school if 50 percent or more of the students in his/her classroom are eligible for those programs.
Source: 2015–2016 National Teacher and Principal Survey (NTPS) microdata from the U.S. Department of Education’s National Center for Education Statistics (NCES)
Although teachers report much more influence in their classrooms than on school policies, they still indicate a surprisingly small level of control over their daily activities. The shares of teachers who report a great deal of influence or control range from 60 to 70 percent when the action is evaluating and grading students or assigning the amount of homework, but falls to a much lower sub-30 percent share when the actions involve selecting textbooks and other instructional materials and controlling topics and skills to be taught. To put it another way, more than seven in 10 teachers do not control the textbooks they use and the topics and skills they teach.
The usual gaps between working conditions in high- and low-poverty schools also appear here. In the areas of school policy, the gaps between teachers’ autonomy or influence in high- and low-poverty schools are small, in general (under 2 percentage points for all categories except establishing the curriculum), and in fact a slightly greater share of teachers in high-poverty schools report having a great deal of control over setting discipline policy and evaluating teachers. In terms of autonomy in their classrooms, the bottom half of the table shows that in all tasks listed except assigning homework, teachers in high-poverty schools have less of a say than their counterparts in low-poverty schools and that the gaps range from 2 to more than 4 percentage points.
Poor school climate depresses teacher satisfaction and motivation, and teachers’ plans to stay in teaching
Figure A summarizes the findings presented in this report—that school climate indicators are tough across the board. Given the challenging school climate for many teachers, it is little surprise that teachers’ satisfaction, motivation, and desire to stay in teaching is low and has even dwindled slightly in the past few years.11 Figure B shows the shares of teachers who say they are satisfied and who say their peers are satisfied. Dissatisfaction is not only the result of a poor school climate but also a factor leading to a poor school climate: when teachers are not as motivated and engaged as they could be it affects the school climate.
School climate indicators are tough across the board
| Quit | |
|---|---|
| Parents struggle to be involved | 21.5% |
| Students are not prepared to learn | 27.3% |
| Have been threatened | 21.8% |
| Have been physically attacked | 12.4% |
| Stress and disappointments outweigh positives | 4.9% |
| Staff cooperation is not great | 61.6% |
| No significant role in setting curriculum | 79.6% |
| No significant say over what I teach in class | 71.3% |
| Not fully satisfied with teaching here | 48.7% |
| Plan to quit teaching at some point | 27.4% |
Note: Data are for teachers in public noncharter schools. See notes to Tables 1–6 for full definitions of the given indicators.
Source: 2015–2016 National Teacher and Principal Survey (NTPS) microdata from the U.S. Department of Education's National Center for Education Statistics (NCES)
Teachers' level of satisfaction: Share of teachers who “strongly agree” and do not "strongly agree" with the statements presented, changes from 2011–2012 to 2015–2016
| Strongly agrees (highest level of satisfaction) | Does not strongly agree (some level of dissatisfaction) | |
|---|---|---|
| 2011–2012 | 54.2% | 45.8% |
| 2015–2016 | 51.3% | 48.7% |
| 2011–2012 | 30.3% | 69.7% |
| 2015–2016 | 28.7% | 71.3% |
| 2011–2012 | 28.4% | 71.6% |
| 2015–2016 | 26.9% | 73.1% |
Note: Data are for teachers in public noncharter schools. The figure shows, for each of the statements listed, the share of teachers who responded that they "strongly agree" versus the share who checked one of the other options on the survey form: "somewhat agree," "somewhat disagree," and "strongly disagree." A teacher is in a low-poverty school if less than 25 percent of the student body in his/her classroom is eligible for free or reduced-price lunch programs; a teacher is in a high-poverty school if 50 percent or more of the student body is his/her classroom is eligible for those programs.
Source: 2011–2012 Schools and Staffing Survey (SASS) and 2015–2016 National Teacher and Principal Survey (NTPS) microdata from the U.S. Department of Education's National Center for Education Statistics (NCES)
Almost half of all teachers (48.7 percent) express some level of dissatisfaction with being a teacher at their current school. Just over a quarter would definitely describe their schools’ teachers as a satisfied group (28.7 percent) and affirmatively say that they like the way things are run at the school (26.9 percent). All of the “strongly agree” shares in the figure are lower than they were in the 2011–2012 school year, pointing to lowered satisfaction and motivation across the board.
Table 5 shows that, as with positive school climate factors, teacher satisfaction is lower in high-poverty schools than in low-poverty schools. The gaps between shares of teachers in high- and low-poverty schools who “strongly agree” with the three statements of satisfaction in the table range from 6.3 to 7.9 percentage points (see the last column of table 5). The data also demonstrate that teachers’ motivation (as represented by the share of teachers who are or are not certain they would choose teaching today if given the opportunity to start over) is quite weak. Only about four in 10 teachers say that if they could go back to college and start over, they would certainly go into teaching, and the share is slightly lower in high-poverty schools than in low-poverty schools (41.4 percent vs. 45.5 percent, this share is from 2011–2012).
Teachers’ level of satisfaction and motivation: Share of teachers who “strongly agree” and do not "strongly agree" with the statements presented and who would become a teacher again if they started over, all schools and in low- and high-poverty schools
| All | Low-poverty | High-poverty | Gap (high- minus low-poverty school) | |
|---|---|---|---|---|
| I am generally satisfied with being a teacher at this school | ||||
| Strongly agrees (highest level of satisfaction) | 51.3% | 56.1% | 48.5% | -7.6 |
| Does not strongly agree (some level of dissatisfaction) | 48.7% | 43.9% | 51.5% | 7.6 |
| The teachers at this school like being here; I would describe us as a satisfied group | ||||
| Strongly agrees (highest level of satisfaction) | 28.7% | 33.7% | 25.8% | -7.9 |
| Does not strongly agree (some level of dissatisfaction) | 71.3% | 66.3% | 74.2% | 7.9 |
| I like the way things are run at this school | ||||
| Strongly agrees (highest level of satisfaction) | 26.9% | 31.0% | 24.7% | -6.3 |
| Does not strongly agree (some level of dissatisfaction) | 73.1% | 69.0% | 75.3% | 6.3 |
| If could go back to your college days and start over again: | ||||
| I would certainly become a teacher | 42.5% | 45.5% | 41.4% | -4.2 |
| Other responses | 57.5% | 54.5% | 58.6% | 4.1 |
Note: Data are for teachers in public noncharter schools. The table shows, for each of the top three statements listed, the share of teachers who responded to the 2015–2016 National Teacher and Principal Survey that they "strongly agree" versus the share who checked one of the other options on the survey form: "somewhat agree," "somewhat disagree," and "strongly disagree." For the last statement, the table shows the share of teachers who responded to the 2011–2012 Schools and Staffing Survey that they “certainly would become a teacher” versus the share who checked one of the other options on the survey form: “probably would become a teacher,” “chances about even for and against,” “probably would not become a teacher,” and “certainly would not become a teacher.” A teacher is in a low-poverty school if less than 25 percent of the student body in his/her classroom is eligible for free or reduced-price lunch programs; a teacher is in a high-poverty school if 50 percent or more of the student body is his/her classroom is eligible for those programs.
Source: 2011–2012 Schools and Staffing Survey (SASS) and 2015–2016 National Teacher and Principal Survey (NTPS) microdata from the U.S. Department of Education's National Center for Education Statistics (NCES)
With respect to plans about staying in the profession, a large share of teachers express their expectation of leaving teaching at some point, as opposed to staying as long as possible or until retirement (Table 6). More than one in four teachers plans to quit teaching at some point, i.e., does not plan to stay in teaching for the rest of his or her career. Here, the gaps between high- and low-poverty schools are small.
When we look at data from the 2011–2012 SASS we see that the drop in teachers’ satisfaction, motivation, and expectations are paralleled by a drop in the share of teachers who plan to continue in teaching for the remainder of their careers: this share decreased from 76.0 percent in 2011–2012 to 72.6 percent in 2015–2016.
Teachers' expectations about remaining in teaching: Share of teachers who plan to remain or quit, all schools and in low- and high-poverty schools
| All | Low-poverty | High-poverty | Gap (high- minus low-poverty school) | |
|---|---|---|---|---|
| Plans to remain in teaching (as of 2015–2016) | 72.6% | 73.3% | 72.4% | -0.9 ppt. |
| Plans to quit teaching at some point (as of 2015–2016) | 27.4% | 26.7% | 27.6% | 0.9 ppt. |
| Plans to remain in teaching (as of 2011–2012) | 76.0% | 77.2% | 75.4% | -1.8 ppt. |
| Plans to quit teaching at some point (as of 2011–2012) | 24.0% | 22.8% | 24.6% | 1.8 ppt. |
Note: Data are for teachers in public noncharter schools. Teachers were asked how long they plan to remain in teaching. Teachers plan to remain in teaching indefinitely if teachers responded that they planned to remain in teaching either as long as they are able, until they are eligible for retirement benefits from their current job or a previous job, or until they are eligible for Social Security benefits. Teachers plan to quit teaching at some point if they answered that they plan to remain in teaching until a specific life event occurs or until a more desirable job opportunity comes along, or that they plan to leave as soon as they can, or said they were undecided. A teacher is in a low-poverty school if less than 25 percent of the student body in his/her classroom is eligible for free or reduced-price lunch programs; a teacher is in a high-poverty school if 50 percent or more of the student body is his/her classroom is eligible for those programs.
Source: 2011–2012 Schools and Staffing Survey (SASS) and 2015–2016 National Teacher and Principal Survey (NTPS) microdata from the U.S. Department of Education's National Center for Education Statistics (NCES)
School climate and the struggle to attract and retain teachers
In the previous reports in this series, we saw that low salaries and excessive moonlighting to complement wages with profession-building activities have made teaching particularly unattractive for both current and potential teachers; in addition, those impediments could explain, in part, the gaps between credentials of the teaching workforce in high- and low-poverty schools because all indicators are worse in high-poverty schools (García and Weiss, 2019a, 2019b, 2019c). The findings in this paper provide parallel evidence regarding school climate: the challenging working environments can make teaching an unattractive profession overall; in addition, the comparatively more difficult working environment for teachers in high-poverty schools can contribute the the fact that high-poverty schools have a harder time attracting and retaining highly credentialed teachers than do low-poverty schools.
In this next section, we explore how aspects of school climate—barriers to teaching, stress and physical threats, satisfaction and motivation—are correlated with the supply of available teachers, and thus, implicated in the teacher shortage. We would expect that, across the board, teachers who quit the profession were more likely to have reported, in the year before they quit, feeling stressed, unsatisfied, unsupported, and not involved in setting school or classroom policies. Figure C lists a subset of the negative school climate indicators and reports the share of “staying” and “quitting” teachers who reported, in their responses to the 2011–2012 Schools and Staffing Survey, they they experienced the indicator. Staying teachers are those who, were still at the same school while quitting teachers are those who had quit by the in the 2012–2013 Teacher Follow-up Survey.
Teachers who quit had higher rates of negative school climate indicators: Shares of staying and quitting teachers who reported the given indicator in the previous year
| Stayed | Quit | |
|---|---|---|
| Parents struggle to be involved | 24.1% | 28.9% |
| Students are not prepared to learn | 29.4% | 39.0% |
| Stress and disappointments outweigh positives | 3.6% | 12.5% |
| Staff cooperation is not great | 61.3% | 66.1% |
| No significant role in setting curriculum | 78.2% | 82.2% |
| No significant say over what I teach in class | 71.4% | 74.6% |
| Not fully satisfied with teaching here | 43.4% | 60.5% |
| Plan to quit teaching at some point | 21.4% | 45.1% |
Note: Data are for teachers in public noncharter schools. Teaching status is determined by the reported status of teachers in the Teacher Follow-up Survey conducted for the 2012–2013 school year, one year after the Schools and Staffing Survey. Teachers who stay at the same school are teachers whose status the year after is “Teaching in this school.” Teachers who left teaching are those who generated a vacancy in the 2012–2013 school year and are not in the profession (they left teaching, were on long-term leave, or were deceased). Not included in the table are teachers who generated a vacancy in the school year but remained in the profession (i.e., left to teach in another school or were on short-term leave and planned to return to the school). See notes to Tables 1–6, and Figure A for full definitions of the given indicators.
Source: 2011–2012 Schools and Staffing Survey (SASS) and 2012–2013 Teacher Follow-up Survey (TFS) microdata from the U.S. Department of Education's National Center for Education Statistics
As the figure shows, larger shares of quitting teachers had reported in the year before they left teaching that key aspects of their school’s climate were problematic than was true among teachers who stayed at their schools. For example, 39.0 percent of teachers who quit felt their students were unprepared to learn, versus 29.4 percent of teachers who stayed at their school. There was a big difference in the stress levels of quitting and staying teachers. The share of quitting teachers who reported being very stressed the year before they quit was 3.5 times as large as the share of staying teachers who reported feeling stressed the previous year. Larger shares of quitting teachers reported that collegiality among teachers was lacking and that they had little influence over school policy or over what they teach in class. Most predictably, the shares of teachers who said they weren’t fully satisfied with teaching and who planned to quit teaching at some point were much higher among those who quit than those who stayed.
The numbers above do not paint a pretty picture about the morale of the current teaching workforce. Among those who stayed, more than one-fifth had reported planning to leave at some point, and over 40 percent had reported some level of dissatisfaction with their jobs. Nearly a third had students who were not prepared to learn, and nearly a fourth were frustrated by the challenge of engaging their students’ parents.12
Conclusion
The various components of a negative working environment—barriers to teaching, stress, physical threats, a lack of say in how to run the classroom, and low levels of satisfaction—interact with one another and make it harder for teachers to do their work, and affect students’ ability to learn. And tough school climates definitely play a role in the teacher shortage: despite their substantial training and ability to deal with the challenges of their job, the negative aspects of the school climate can dissuade young people from becoming teachers and driving some teachers out of our classrooms.
In this report, we show that school climate indicators correlate with teachers’ statuses the year after. Across the board, we note that school climate indicators of teachers who quit were worse than of teachers who stayed the school year before teachers made the decision to quit or stay in the profession.
We also show that, aside from those correlations, certain features that make teaching challenging are so concerning that we would not expect teachers or any professionals to have to handle them without being provided with further supports. When students are unprepared, teachers must spend more time reviewing material and potentially neglecting other students. Students who are in poor health, or who miss school frequently, are not just disruptive on a practical level, but cause concern and emotional distress for teachers who watch them struggle and for other students. These disruptions and distractions lead teachers to feel stressed and disappointed, as does the challenge of engaging parents who, for a variety of reasons, have trouble connecting with teachers in ways that boost their children’s ability to learn. And when the working conditions raise safety concerns—students misbehave, or threaten or attack teachers in the school—it adds to the level of distress.
Our research points to a different source of distress as well: the lack of cooperation and support from the administration and other colleagues, and the limited influence and autonomy teachers have over their daily activities or their schools’ needs, further add to a problematic working environment. Significantly large shares of teachers indicate that their voices go unheard—schools are not fully benefiting from their knowledge, preparation, and expertise.
All of this, of course, depresses satisfaction and drives teachers to consider leaving their schools or the professional altogether. Dissatisfaction increases when poor working conditions are accompanied by weak compensation, lack of professional development opportunities, and the deteriorated prestige of teaching. Clearly, the challenging conditions confronting a growing share of teachers are helping to drive teacher shortages across schools and especially in high-poverty schools.
In sum, the evidence presented in this paper shows that it is imperative that we improve working conditions across the board to stop the teacher exodus and address the substantial pent-up frustration among the existing workforce. As suggested in our companion pieces, only if policymakers think holistically about how to address the teacher shortage will they find the necessary resources to adequately fund our schools, to eliminate the barriers to teaching and learning, and to elevate the respect for teachers’ knowledge, experience, and judgment.
About the authors
Emma García is an education economist at the Economic Policy Institute, where she specializes in the economics of education and education policy. Her research focuses on the production of education (cognitive and noncognitive skills); evaluation of educational interventions (early childhood, K–12, and higher education); equity; returns to education; teacher labor markets; and cost-effectiveness and cost–benefit analysis in education. She has held research positions at the Center for Benefit-Cost Studies of Education, the Campaign for Educational Equity, the National Center for the Study of Privatization in Education, and the Community College Research Center; consulted for MDRC, the World Bank, the Inter-American Development Bank, and the National Institute for Early Education Research; and served as an adjunct faculty member at the McCourt School of Public Policy, Georgetown University. She received her Ph.D. in Economics and Education from Columbia University’s Teachers College.
Elaine Weiss is the lead policy analyst for income security at the National Academy of Social Insurance, where she spearheads projects on Social Security, unemployment insurance, and workers’ compensation. Prior to her work at the academy, Weiss was the national coordinator for the Broader, Bolder Approach to Education, a campaign launched by the Economic Policy Institute, from 2011–2017. BBA promoted a comprehensive, evidence-based set of policies to allow all children to thrive in school and life. Weiss has co-authored and authored EPI and BBA reports on early achievement gaps and the flaws in market-oriented education reforms. She is co-author, with former Massachusetts Secretary of Education Paul Reville, of Broader, Bolder, Better, published by Harvard Education Press in 2019. Weiss came to BBA from the Pew Charitable Trusts, where she served as project manager for Pew’s Partnership for America’s Economic Success campaign. She has a Ph.D. in Public Policy from the George Washington University Trachtenberg School and a J.D. from Harvard Law School.
Acknowledgments
The authors are grateful to Lora Engdahl for her edits and suggested additions to this piece and for her extraordinary contributions to structuring the contents of this series of papers. We also appreciate John Schmitt’s supervision of this project and Lawrence Mishel’s guidance in earlier stages of this research. We acknowledge Julia Wolfe for her assistance with the tables and figures in this report, Kayla Blado for her work disseminating the report and her assistance with the media, John Carlo Mandapat for the infographic that accompanies this report, and the rest of the communications staff at EPI for their contributions to the different components of this report and the teacher shortage series. We appreciate EPI Communications Director Pedro da Costa’s coordination of all the steps required for the publication of this report and of the series.
Data sources used in this report
The analyses presented in this report mainly rely on the Schools and Staffing Survey (SASS) 2011–2012, the Teacher Follow-up Survey (TFS) 2012–2013, and the National Teacher and Principal Survey (NTPS) 2015–2016. The surveys collect data on and from teachers, principals, and schools in the 50 states and the District of Columbia.13 All three surveys were conducted by the U.S. Census Bureau for the U.S. Department of Education. The survey results are housed in the National Center for Education Statistics (NCES), which is part of the Department of Education’s Institute of Education Sciences (IES).
The NTPS is the redesigned SASS, with a focus on “flexibility, timeliness, and integration with other Department of Education data” (NCES 2019). Both the NTPS and SASS include very detailed questionnaires at the teacher level, school level, and principal level, and the SASS also includes very detailed questionnaires at the school district level (NCES 2017). The TFS survey, which is the source of data on teachers who stay or quit, was conducted a year after the 2011–2012 SASS survey to collect information on the employment and teaching status, plans, and opinions of teachers in the SASS. Following the first administration of the NTPS, no follow-up study was done, preventing us from conducting an updated analysis of teachers by teaching status the year after the NTPS. NCES plans to conduct a TFS again in the 2020–2021 school year, following the 2019–2020 NTPS.
The 2015–2016 NTPS includes public and charter schools only, while the SASS and TFS include all schools (public, private, and charter schools).14 We restrict our analyses to public schools and teachers in public noncharter schools.
The 2015–2016 NTPS includes public and charter schools only, while the SASS and TFS include all schools (public, private, and charter schools).15 We restrict our analyses to public schools and teachers in public noncharter schools.
Endnotes
1. For a more detailed review of the media coverage of the shortage, see García and Weiss 2019a. Research on costs come from Carver-Thomas and Darling-Hammond 2017 and the Learning Policy Institute 2017 reports, which estimated that filling a vacancy costs $21,000 on average; and from Carroll 2007, which estimated that the total annual cost of turnover was $7.3 billion per year. According to Strauss 2017, that estimated annual cost of turnover would exceed $8 billion at present.
2. School climate is based on patterns of students’, parents’, and school personnel’s experience of school life; it also reflects norms, goals, values, interpersonal relationships, teaching and learning practices, and organizational structures (The National School Climate Center 2019). In a recent post, Kautz and Ross (2019) explain that “school climate covers both tangible and intangible attributes, including relationships among students and staff, school discipline, student engagement, and safety.” A book on supports for school improvement (Bryk et al. 2010) identifies school climate as one of the essential supports (together with school leadership, parent and community ties, professional capacity of the staff, a student-centered learning climate, and instructional guidance system).
3. A recent book covering the range of supports and the role they play in having children prepared to learn is Weiss and Reville 2019. A seminal book on the opportunity gaps created by poverty and inequality is Rothstein 2004.
4. See summary in Katz 2018.
5. See Darling-Hammond 1999; Ladd and Sorensen 2016; Ronfeldt et al. 2013; Jackson and Bruegmann 2009; Kraft and Papay 2014; Moore-Johnson, Kraft, and Papay 2012; Ladd 2011; Loeb, Darling-Hammond, and Luczak 2005; and Warner-Griffin, Cunningham, and Noel 2018.
6. All of these school climate factors are related to student poverty, some more directly than others. Teachers are also explicitly asked about the extent to which “poverty” is a problem at the school.
7. As poverty is the variable (or proxy of it) that we use to classify our schools into low- and high-poverty schools, we do not stress the gap between the shares of teachers who acknowledge “poverty” as a “serious problem” in the two types of schools (45.1 versus 9.5 percent respectively). This perception of poverty as a problem is, by construction, an expected gap, and thus, we focus on the remaining and worrisome evidence in the table.
8. See Weiss and Reville 2019; Rothstein 2011; and Rothstein 2004.
9. Researchers have explored a number of factors that prevent low-income parents from connecting and partnering with their children’s schools. The reasons range from irregular working schedules, having had bad experiences as students, or even having fewer options of supervised care if they need to participate in school activities (Morsy and Rothstein 2015; Weiss and Reville 2019). García and Weiss 2017b, a study examining early education and parenting practices for the kindergarten classes of 1998 and 2010, found that all families but especially low-income families have, over time, become more involved in their young children’s early education and development. Parents were more likely in 2010 than in 1998 to read regularly to their children; to sing to them; to play games with them; and to enroll them in center-based pre-K programs. Parents in 2010 also had significantly higher expectations for their children’s educational attainment, and mothers themselves were more highly educated—both factors that are associated with higher achievement for those children.
10. See our own analysis on the prevalence of absenteeism and its influence on student performance (see García and Weiss 2018).
11. No one of the overarching factors (pay, as described in García and Weiss 2019c, school climate, as described in this report, or career supports, as described in the next report in this series works in isolation. Rather the factors, along with the broader underinvestments in education, jointly influence voluntary attrition, turnover, and lack of incoming teachers.
12. The gaps between the shares of staying and leaving teachers who report these problems are, in general, wider in high-poverty schools than in low-poverty schools (data not shown in this report). This implies that barriers to teaching, safety, and satisfaction play a different role in schools depending on poverty level. These problems likely played a more important part in driving or keeping teachers away in high-poverty schools (but this hypothesis would need a regression analysis to confirm).
13. The 2015–2016 NTPS does not produce state-representative estimates. The forthcoming 2017–2018 NTPS will support state-level estimates.
14. The forthcoming 2017–2018 NTPS additionally includes the private sector.
15. The forthcoming 2017–2018 NTPS additionally includes the private sector.
References
Bryk, Anthony S., Penny Bender Sebring, Elaine Allensworth, John Q. Easton, and Stuart Luppescu. 2010. Organizing Schools for Improvement: Lessons from Chicago. Chicago: Univ. of Chicago Press.
Carroll, Thomas G. 2007. Policy Brief: The High Cost of Teacher Turnover. National Commission on Teaching and America’s Future.
Carver-Thomas, Desiree, and Linda Darling-Hammond. 2017. Teacher Turnover: Why It Matters and What We Can Do About It. Learning Policy Institute, August 2017.
Darling-Hammond, Linda. 1999. Teacher Quality and Student Achievement: A Review of State Policy Evidence. Seattle: Center for the Study of Teaching and Policy, University of Washington.
García, Emma. 2015. Inequalities at the Starting Gate: Cognitive and Noncognitive Skills Gaps Between 2010–2011 Kindergarten Classmates. Economic Policy Institute, June 2015.
García, Emma, and Elaine Weiss. 2017a. Reducing and Averting Achievement Gaps. Key Findings from the Report ‘Education Inequalities at the School Starting Gate’ and Comprehensive Strategies to Mitigate Early Skills Gaps. Economic Policy Institute, September 2017.
García, Emma, and Elaine Weiss. 2017b. Education Inequalities at the School Starting Gate: Gaps, Trends, and Strategies to Address Them. Economic Policy Institute, September 2017.
García, Emma, and Elaine Weiss. 2018. Student Absenteeism: Who Misses School and How Missing School Matters for Performance. Economic Policy Institute, September 2018.
García, Emma, and Elaine Weiss. 2019a. The Teacher Shortage Is Real, Large and Growing, and Worse Than We Thought: The First Report in the “Perfect Storm in the Teacher Labor Market” Series. Economic Policy Institute, March 2019.
García, Emma, and Elaine Weiss. 2019b. U.S. Schools Struggle to Hire and Retain Teachers: The Second Report in “The Perfect Storm in the Teacher Labor Market” Series. Economic Policy Institute, April 2019.
García, Emma, and Elaine Weiss. 2019c. Low Relative Pay and High Incidence of Moonlighting Play a Role in the Teacher Shortage, Particularly in High-poverty Schools. The Third Report in “The Perfect Storm in the Teacher Labor Market” Series. Economic Policy Institute, May 2019.
Jackson, Kirabo, and Elias Bruegmann. 2009. “Teaching Students and Teaching Each Other: The Importance of Peer Learning for Teachers.” American Economic Journal: Applied Economics 1, no. 4: 85–108.
Katz, Veronica. 2018. Teacher Retention: Evidence to Inform Policy. EdPolicyWorks Policy Brief, October 2018.
Kautz, Tim, and Christine Ross. 2019. “Developing School Climate Surveys for Statewide Accountability in Maryland.” RELevant (Regional Educational Laboratory Mid-Atlantic blog), January 24, 2019.
Kraft, Matthew A., and John P. Papay. 2014. “Can Professional Environments in Schools Promote Teacher Development? Explaining Heterogeneity in Returns to Teaching Experience.” Educational Evaluation and Policy Analysis 36, no. 4: 476–500.
Ladd, Helen. 2011. “Teachers’ Perceptions of Their Working Conditions: How Predictive of Planned and Actual Teacher Movement?” Educational Evaluation and Policy Analysis 33, no. 2: 235–261.
Ladd, Helen F., and Lucy C. Sorensen. 2016. “Returns to Teacher Experience: Student Achievement and Motivation in Middle School.” Education Finance and Policy 12, no. 2: 241–279.
Learning Policy Institute. 2017. What’s the Cost of Teacher Turnover? (calculator). September 2017.
Loeb, Susanna, Linda Darling-Hammond, and John Luczak. 2005. “How Teaching Conditions Predict Teacher Turnover in California Schools.” Peabody Journal of Education 80, no. 3: 44–70.
Moore-Johnson, Susan, Matthew A. Kraft, and John P. Papay. 2012. “How Context Matters in High-Need Schools: The Effects of Teachers’ Working Conditions on Their Professional Satisfaction and Their Students’ Achievement.” Teachers College Record 114, no. 10: 1–39.
Morsy, Leila, and Richard Rothstein. 2015. Five Social Disadvantages That Depress Student Performance: Why Schools Alone Can’t Close Achievement Gaps. Economic Policy Institute, June 2015.
National Center for Education Statistics (NCES) (U.S. Department of Education). 2011–2012. Licensed microdata from the 2011–2012 Schools and Staffing Survey (SASS).
National Center for Education Statistics (NCES) (U.S. Department of Education). 2012–2013. Licensed microdata from the 2012–2013 Teacher Follow-up Survey (TFS).
National Center for Education Statistics (NCES) (U.S. Department of Education). 2015–2016. Licensed microdata from the 2015-2016 National Teacher and Principal Survey (NTPS).
National Center for Education Statistics (NCES) (U.S. Department of Education). 2017. Documentation for the 2011–12 Schools and Staffing Survey. March 2017.
National Center for Education Statistics (NCES) (U.S. Department of Education). 2019. “NTPS Overview” (web page), accessed March 2019.
National School Climate Center. 2019. “What Is School Climate and Why Is It Important?” (web page). National School Climate website. Accessed May 2019.
Ronfeldt, Matthew, Hamilton Lankford, Susanna Loeb, and James Wyckoff. 2013. “How Teacher Turnover Harms Student Achievement.” American Educational Research Journal 50, no. 1: 4–36.
Rothstein, Richard. 2004. Class and Schools: Using Social, Economic, and Educational Reform to Close the Achievement Gap. Washington, D.C., and New York: Economic Policy Institute and Columbia University Teachers College.
Rothstein, Richard. 2011. A Look at the Health-related Causes of Low Student Achievement. Economic Policy Institute, March 2011.
Strauss, Valerie. 2017. “Why It’s a Big Problem That So Many Teachers Quit—and What to Do About It,” Washington Post, November 27, 2017.
Sutcher, Leib, Linda Darling-Hammond, and Desiree Carver-Thomas. 2016. A Coming Crisis in Teaching? Teacher Supply, Demand, and Shortages in the U.S. Learning Policy Institute, September 2016.
Thapa, Amrit, Jonathan Cohen, Shawn Guffey, and Ann Higgins-D’Alessandro. 2013. “A Review of School Climate Research.” Review of Educational Research 83, no. 3: 357–385. https:// doi.org/10.3102/0034654313483907.
Warner-Griffin, Catharine, Brittany C. Cunningham, and Amber Noel. 2018. Teachers’ Perceptions of Autonomy, Satisfaction, Job Security, and Commitment: 1999–2000 and 2011–12. Institute of Education Statistics, National Center for Education Statistics, U.S. Department of Education, Stats in Brief no. 2018-103, March 2018.
Weiss, Elaine, and Paul Reville. 2019. Broader, Bolder, Better. How Schools and Communities Help Students Overcome the Disadvantages of Poverty. Cambridge, Mass.: Harvard Education Publishing Group.
