Robert E. Scott, EPI’s director of trade and manufacturing policy research, testified before the U.S.-China Economic and Security Review Commission at a hearing on U.S. -China Economic Challenges, 608 Dirksen Senate Office Building, Washington, D.C., on February 21, 2014. His testimony responded to Panel 1, questions 1–5 and 7
Question 1. Does U.S. – China trade have an impact on U.S. jobs, wages, and benefits? If so, how has this changed over the last 10 years?
The president has identified reducing inequality as the “defining challenge of our time.” While inequality is a complicated problem, it won’t be solved without raising wages of middle-class Americans, creating more jobs, and reducing unemployment. To do that, we need to increase sales of goods and services made in the United States, which means expanding exports, reducing imports, and shrinking our trade deficit.
Currency manipulation, trade, jobs, and wages
Currency manipulation, by about 20 countries (mostly in Asia), is the most important cause of our trade deficit. These nations have been exploiting our markets and stealing U.S. jobs for over a decade. Ending currency manipulation would reduce U.S. trade deficits by between $200 billion and $500 billion per year within three years, creating between 2.3 million and 5.8 million U.S. jobs (Table 1). It would also increase U.S. GDP by between $288 billion and $720 billion (between 2.0 percent and 4.9 percent), reduce U.S. budget deficits by between $107 billion and $266 billion (34.4 percent to 86.1 percent) and improve state and local budgets by between $40 billion and $101 billion (2.0 percent to 4.9 percent of total state and local spending) (Scott 2014a).
Impact of ending currency manipulation, on U.S. economy and state spending, 2015*
| Scenario** | ||
|---|---|---|
| Change in 2015 | Low impact | High impact |
| Trade deficit (billions of dollars) | -$200 | -$500 |
| Gross domestic product | ||
| in annual billions of dollars | +$288 | +$720 |
| as a share of GDP*** | +2.0% | +4.9% |
| Number of jobs | +2,300,000 | +5,800,000 |
| Federal budget deficit | ||
| in annual billions of dollars | -$107 | -$266 |
| as a share of federal deficit*** | -34.4% | -86.1% |
| State and local budget funds | ||
| in annual billions of dollars | +$40 | +$101 |
| as a share of state spending*** | +2.0% | +4.9% |
| as a share of state/local deficits*** | -27.4% | -68.4% |
*The table estimates the effects of ending currency manipulation over three years, modeled as having begun in 2013.
**The low-impact scenario assumes ending currency manipulation would reduce the trade deficit by $200 billion in 2015 relative to the trade deficit in 2012; the high-impact scenario assumes a $500 billion reduction in the trade deficit.
***Percentages shown are relative to baseline forecasts for 2015.
Note: Dollar calculations are in 2005 dollars.
Source: Author's analysis of Bergsten and Gagnon (2012), the American Community Survey (U.S. Census Bureau 2013), U.S. International Trade Commission (2013), Congressional Budget Office (2013a and 2013b), Bivens (2011), Bivens and Edwards (2010), Kondo and Svec (2009, 10), Bureau of Labor Statistics (2013), Bureau of Labor Statistics Employment Projections program (BLS-EP 2011a and 2011b), and Zandi (2011). For a more detailed explanation of data sources and computations, see text and the appendix to Scott (2014a).
China is by far the largest currency manipulator, and it has increased its holdings of foreign exchange reserves by at least $359 billion per year, on average, between 2006 and 2012 (see Figure A). Gagnon (2013) has shown that there is nearly a perfect, 1-to-1 correlation between a country’s official purchases of foreign exchange reserves and its current account balances. China has acquired over $4 trillion in foreign exchange reserves and other foreign assets since 2000. Those purchases are strongly correlated with the growth of China’s trade and current account surpluses with the United States, and the world.
Change in China's total foreign-exchange reserves, 2006–2013
| Year | Change in total reserves ($ billions) |
|---|---|
| 2006 | 247.0 |
| 2007 | 461.8 |
| 2008 | 419.0 |
| 2009 | 466.8 |
| 2010 | 450.0 |
| 2011 | 336.7 |
| 2012 | 128.3 |
| 2013Q3* | 328.9 |
*The $328.9 billion figure is through the end of the third quarter and includes data through the second quarter from the IMF (2013a) and data for the third quarter from Silk (2013).
Source: Author's analysis of International Financial Statistics (IMF 2013a) and Silk (2013)
Currency manipulators have increased their holding of official foreign assets by nearly $1 trillion per year in recent years. Bergsten and Gagnon (2012) also estimate that the elimination of currency manipulation would result in a 10 percent to 25 percent depreciation in the trade-weighted value of the dollar. The elimination of currency manipulation would result in a somewhat larger appreciation in the Chinese yuan and other manipulated currencies relative to the U.S. dollar.
Currency manipulation can be eliminated by passing new laws (such as H.R. 1276 and S. 1114) and by confronting the perpetrators.1 China is by far the most important currency manipulator. There are approximately 20 other significant currency manipulators, and many others who have been forced to engage in defensive devaluations to maintain their competitiveness with China and other large manipulators (Bergsten and Gagnon 2012, 1). In this regard, it is important to note that official Chinese trade data, which are used by the IMF and other agencies to estimate China’s global trade surplus, substantially and consistently underestimate the overall Chinese trade surplus, as shown by a comparison of Chinese trade statistics with comparable trading partner data on trade with China (Figure B).
China's global goods trade surplus, Chinese vs. trading partner country reports, 2005–2012
| Year | China’s estimate | China’s trade partners’ estimate** |
|---|---|---|
| 2005 | 119.7 | 357.2 |
| 2006 | 196.1 | 449.2 |
| 2007 | 290.8 | 573.4 |
| 2008 | 341.9 | 651.0 |
| 2009 | 235.2 | 465.3 |
| 2010 | 245.5 | 532.4 |
| 2011* | 236.1 | 522.9 |
| 2012* | 317.6 | 548.3 |
*Estimates for 2011 and 2012 are based on incomplete data, with fewer than 152 out of 171 countries reporting.
**The estimates are adjusted for differences in transportation costs, assuming that China pays 10 percent CIF (cost, insurance, and freight) and receives 1/1+.10 in export revenues. See appendix in Scott (2013b) for further details on the methodology.
Source: Author's analysis of United Nations Commodity Trade statistics (UN Comtrade 2013) and IMF (2013a)
Turning to trade, jobs, and wages, the most important cause of growing inequality remains extremely high levels of unemployment, and low levels of labor force participation. The unemployment rate was 12.7 percent in January if underemployed workers are included (BLS 2014). Sustained low unemployment would deliver much higher levels of wage growth to workers in the bottom and middle of the income distribution. When unemployment falls, wages rise much faster at the bottom and middle of the income distribution than at the top. Thus, reducing unemployment would directly improve income inequality. EPI research has also shown how the growth of trade with China and other low-wage nations has contributed directly to growing income inequality.
EPI research on the costs of China trade and the impacts of trade with low-wage countries
Business and government officials frequently claim that export growth is delivering great benefits to the economy. For example, the International Trade Administration (ITA 2013) claimed last year that “Americans are selling more U.S. goods and services to the 95 percent of consumers who live outside of our borders. In 2012, U.S. exports hit an all-time record of $2.2 trillion and supported 9.8 million jobs.”
As recently noted in Scott (2013c), trade is a two-way street.
Exports support domestic jobs, but imports displace jobs that would be located in the United States. But when most U.S. officials talk about the benefits they refuse to discuss imports or their effects on employment. Talking about trade and only discussing the growth of exports and their implications for employment is like keeping score in a baseball game and only counting runs scored by the home team—it might make your team sound good, but it won’t tell you if they’ve won the game.
Exports support jobs, but imports destroy them. The best measure of the net impact of trade on the demand for labor, and on overall GDP in the United States, is the change in the U.S. trade balance, measured in dollars.
The administration continues to tout the supposed benefits of rapid export growth (ITA 2012). However, the rate of growth of exports is not the only, or even the most important, determinant of changes in the U.S. trade balance, as shown in charts for U.S. trade with China. For example, Figure C shows that exports to China grew at a 10.3 percent annual rate in 2013, while imports increased only 3.5 percent. However, as shown in Figure D, the value of U.S. exports to China increased only $11.4 billion in 2013, while the value of imports increased $14.8 billion. Thus, the U.S. trade deficit with China increased $3.4 billion last year (in 2013).
Growth in U.S. exports to and imports from China, 2011, 2012, and 2013
| Year | Exports | Imports |
|---|---|---|
| 2011 | 13.1% | 9.4% |
| 2012 | 6.5% | 6.6% |
| 2013 | 10.3% | 3.5% |
Source: Author's analysis of U.S. International Trade Commission (2013)
Change in value of U.S. exports to, imports from, and trade balance with China, 2011, 2012, and 2013 (in billions of U.S. dollars)
| Year | Exports | Imports | Trade balance |
|---|---|---|---|
| 2011 | $12.0 | $34.4 | -$22.4 |
| 2012 | $6.7 | $26.3 | -$19.6 |
| 2013 | $11.4 | $14.8 | -$3.4 |
Source: Author's analysis of U.S. International Trade Commission (2013)
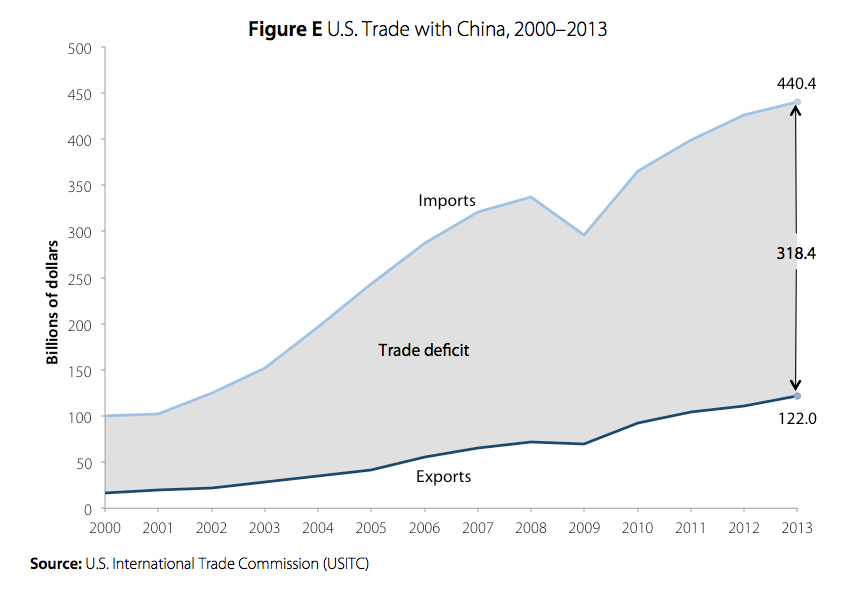
The trade deficit increased, despite more rapid export growth, because the total value of imports exceeded that of exports by a factor of 3.6-to-1 in 2013, (U.S.-China imports, exports, and the trade balance for 2000–2013 are shown in Figure E). Thus, exports would have to grow 360 percent faster than imports just to keep the trade deficit from growing, and they have not. The U.S. trade deficit with China has increased rapidly since that country entered the World Trade Organizations (WTO) in 2001, as shown in Figure E.
The China trade toll: Growing trade deficits, job losses, and wage suppression
Growing U.S. trade deficits with China between 2001 and 2012 eliminated 2.9 million U.S. jobs. More than three-fourths of the jobs lost (nearly 2.3 million, 77.1 percent) were in the manufacturing sector (Scott 2014b, forthcoming). Similar findings have been obtained by Autor, Dorn, and Hanson (2012) and Pierce and Schott (2012).2
Workers displaced by trade were pushed out of good jobs with excellent wages, primarily in manufacturing industries, into lower-paying jobs in nontraded industries, or into unemployment. Growing trade deficits with China between 2001 and 2011 resulted in the net loss of at least $13,505 per displaced worker in 2011 alone. For all displaced workers, using education group averages, net wages losses totaled $37 billion (Scott 2013a).
Direct trade and wage losses are just the tip of the iceberg when it comes to the cost of China trade, and globalization more broadly, for American workers. Using standard models to benchmark the cost of globalization for American workers without a college degree, Bivens (2013) estimated that in 2011, trade with low-wage countries lowered wages by 5.5 percent—roughly $1,800 for a full-time, full-year worker without a college degree.
There are approximately 100 million workers in the United States without a college degree. Overall, the growth of imports from low-wage nations has resulted in a total transfer of $180 billion per year from production to nonproduction workers, directly contributing to the observed rise in inequality. The growth of trade with low-wage countries explains roughly 90 percent of the rise in college wage premium since 1995. Between 1995 and 2011, China alone was responsible for over half (51.6 percent) of the growth in the college/noncollege wage gap. (Bivens 2013)
Question 2. What secondary factors, such as indirect employment effects, or the impact of manufacturing job losses on the business services sector, have affected overall employment in the U.S. economy as a result of the trade imbalance?
The U.S. economy is entering the seventh year of the great recession. Nearly 8 million jobs are needed to absorb the excess workers in the economy and return to unemployment levels that prevailed before the start of the recession (EPI 2013). The U.S. economy was operating 4.5 percent below potential output in 2013 (an output gap of $797.5 billion) (CBO 2014).
The elimination of currency manipulation would directly stimulate the creation of up to 2.3 million direct U.S. jobs (Table 2, high-impact scenario). An additional 1.7 million jobs would be created in indirectly supported industries, including jobs in supplier industries (such as steel, glass, and tires used as inputs to the auto industry), and service industries (such as accounting, scientific, and technical and managerial services). Because the economy has unused resources, the creation of up to 4 million (direct plus indirect jobs) by the elimination of currency manipulation will also result in the creation of additional respending jobs in the economy, as those initial workers spend the wages earned on goods and services. Since wages are high in manufacturing (which makes most traded goods), reducing trade deficits will have a large “multiplier” effect on employment. We estimate that the multiplier for such spending is 0.44. Thus, an additional 1.8 million jobs multiplier jobs would be created by eliminating currency manipulation in the high-impact scenario, as shown in Table 2.
Number of U.S. jobs created by ending currency manipulation, 2015*
| Scenario** | ||
|---|---|---|
| Low impact | High impact | |
| Direct jobs | 1,112,700 | 2,280,800 |
| Indirect jobs | 487,300 | 1,719,200 |
| Respending jobs | 700,000 | 1,800,000 |
| Total | 2,300,000 | 5,800,000 |
*The table estimates the effects of ending currency manipulation over three years, modeled as having begun in 2013.
**The low-impact scenario assumes ending currency manipulation would reduce the trade deficit by $200 billion in 2015 relative to the trade deficit in 2012; the high-impact scenario assumes a $500 billion reduction in the trade deficit.
Source: Author's analysis of the American Community Survey (U.S. Census Bureau 2013), U.S. International Trade Commission (2013), Congressional Budget Office (2013a and 2013b), Bivens (2011), Bivens and Edwards (2010), Kondo and Svec (2009, 10), Bureau of Labor Statistics (2013d), Bureau of Labor Statistics Employment Projections program (BLS-EP 2011a and 2011b), and Zandi (2011). For a more detailed explanation of data sources and computations, see text and the appendix to Scott (2014a).
Jobs supported by eliminating currency manipulation would be concentrated primarily in manufacturing and agricultural states in the Midwest including Wisconsin, Indiana, Iowa, Minnesota, Michigan, Ohio, South Dakota, Kansas, Nebraska, and also Idaho in the West. Growing trade deficits have devastated manufacturing production, which has had a ripple effect on state and local governments throughout these “rustbelt” regions of the country.
Question 3. How would our economic relationship with China need to change for it to produce more U.S. jobs and a better balance of trade?
China has built an export based economy on a foundation of illegal financial, trade, and industrial policies. These include China’s currency manipulation; its many trade-distorting practices including extensive subsidies, illegal barriers to imports, restrictions on critical trade in critical materials (such as taxes and quotas on exports of rare earth minerals), and dumping; suppression of wages and labor rights; and a race to the bottom in environmental, health, and product safety standards that have threatened consumers in the U.S., polluted our air and oceans, and increased global warming.
At the same time, China has suppressed wages and neglected the development of its own domestic consumer markets. From a macroeconomic perspective, China has developed bloated manufacturing and trade goods sectors and suppressed domestic consumption. As a result the structure of China’s economy is distorted, imbalanced, and unsustainable.
China needs to redevelop its economy by reducing its reliance on export-led growth and taking steps to increase domestic consumption. These could include measures to raise domestic wages by raising minimum wages and by recognizing the rights of workers to independently organize and bargain collectively (e.g., form independent trade unions). China can also boost domestic demand by increasing investment in its social safety net and through expanded investments in domestic infrastructure.
Question 4. As China evolves from an economy that makes copies of things to an economy that also invents things, what does the U.S. need to do to ensure that our workers are prepared to compete?
There are a number of policies the United States can and should undertake to redevelopment its economy. All will contribute to rebuilding U.S. manufacturing. For example, underinvestment in infrastructure reduces the efficiency of the economy and the competitiveness of U.S. manufacturing. The United States needs $3.6 trillion in infrastructure investment by 2020 (ASCE 2013). Rebuilding U.S. infrastructure will create huge demands for domestic manufactured products such as steel, concrete, construction equipment, controls and instruments. It will also help rebuild overall demand in the domestic economy.
The remainder of the response to question four pulls directly from a previous EPI research paper (Scott, Jorgenson, and Hall 2013).
Enacting policies to more effectively stimulate demand, including ending currency manipulation, rebuilding infrastructure, investing in clean and renewable technology industries, and eliminating unfair trade policies (such as dumping, subsidies, and other unfair trade barriers) are the most important steps needed to rebuild U.S. manufacturing.
New trade policies to respond to a dynamic and increasingly hostile international environment would move toward a restructuring of the world trading system so that it supports fair, balanced, and sustainable trade. And the massive public investments needed to rebuild U.S. infrastructure and develop new green and clean energy technologies will create domestic and foreign demand for new products that can help rebuild U.S. manufacturing, while increasing the competitiveness of the U.S. economy as a whole. Finally, reforms of health care and tax systems are also needed to increase competitiveness and rebalance public spending and revenues in the United States.
While policies that address the demand side of the equation are critical, supply-side assistance is also crucial; U.S. manufacturing suffers from reduced capacity, in both absolute terms and relative to our trading partners. The United States and its domestic manufacturers are operating in an environment where many other countries, including Germany, Japan, China, and Korea, operate comprehensive, supply-side programs to support their traded goods industries. The United States needs to create a world-class environment to support domestic manufacturing (Ezell and Atkinson 2011 and 2012). This should include greatly enhanced investments in technology development, and manufacturing “extension programs” such as the Manufacturing Extension Partnership, a program of the National Institute of Standards and Technology (NIST) that is vastly underfunded when compared with agriculture capacity-building programs of the USDA and with manufacturing capacity-building programs of other countries such as Canada, Germany, and Japan.
The United States also needs an intermediary institution to provide working and investment capital to small and medium-sized manufacturers, which often lack access to U.S. bank and capital markets that give preference to large multinational companies for bank loans and long-term corporate bonds. This “Mannie Mae” would be modeled on the federal housing enterprises (i.e., Fannie Mae, Freddie Mac, and Ginnie Mae) that channel capital into the nation’s housing finance markets.
In addition, federal and state governments should work with schools, unions, and manufacturers to develop improved school-to-work training programs for noncollege graduates, modeled on German and Danish labor force policies.
Finally, Japan has a Ministry of Economy, Trade, and Industry (METI), a powerful agency that works to ensure that foreign trade policy complements efforts to strengthen domestic manufacturing interests. China through its five-year plans also provides critical strategic support to manufacturing efforts. The U.S. government needs to expand its capacity to develop and implement national trade and competitiveness strategies to respond to, and compete with, Japan’s METI and China’s five-year plans.
Lessons on building strong support systems from the United States and other countries
The major elements of a more effective national trade and industrial policy were outlined in the previous section. A few examples will illustrate the scale of resources and commitments required to raise manufacturing support in the United States to a level on par with other countries.
In the debates about the future of manufacturing, comparisons are frequently drawn between the decline of employment in agriculture and that in manufacturing. However, agriculture has continued to be a major U.S. exporter, and its contribution to the economy has been relatively constant in recent years despite the sharp decline in employment. Agricultural output has continued to grow (in real terms) despite falling employment.
One of the primary reasons for rising output in agriculture is the steady growth of productivity (output per acre). Among the foremost reasons for the large and steady rise in agricultural productivity has been the key role played by the federal government in supporting research and its dissemination and diffusion. Resources dedicated to this task include the U.S. Department of Agriculture and its Agricultural Research Service, the system of land-grant colleges that support a vast base of primary research into agricultural sciences, economics and technology diffusion, and the USDA’s farm extension service, which has disseminated the latest research findings to farmers at the county and farm level.
There is simply no counterpart in manufacturing to the USDA/land-grant college system of agricultural research, development, innovation, and diffusion of new technologies. The entity that comes closest to performing a similar role in manufacturing may be the relatively obscure National Institute of Standards and Technology (NIST). The president’s budget requested $857 million for NIST in fiscal 2013 (NIST 2012).
In comparison, the USDA’s overall 2013 budget request, including mandatory crop subsidy programs and all other research programs, was $155 billion (USDA 2012). Some 72 percent of USDA expenditures are for nutrition assistance (the Women, Infants and Children program), which only indirectly benefits agriculture. Considering only non–nutrition assistance programs, which include farm and commodity programs, conservation and forestry, rural development, research, and other programs, the USDA’s fiscal 2013 request is still $43.4 billion, more than 50 times total spending on NIST programs. However, manufacturing generated 10 times as much output as did agriculture in 2011: $1,731.5 billion of value added in manufacturing versus $173.5 billion in agriculture (Bureau of Economic Analysis 2012). Thus, per dollar of economic output generated, the USDA spends more than 500 times as much to support agriculture and related activities as NIST spends on manufacturing research and related activities.
One of the most visible (and controversial) elements of NIST is the Hollings Manufacturing Extension Partnership (MEP), which was designated to receive $128 million in fiscal 2013 (NIST 2012). Comparative research by Ezell and Atkinson (2011) has shown that U.S. expenditures for the MEP program represent only 0.0014 percent of U.S. GDP. As a share of GDP, Canada spends more than seven times as much as the United States on manufacturing extension and services programs, and Japan spends nearly 23 times more than the United States.
If U.S. spending on the MEP program were to rise to the Japanese level, it would require a budget allocation of approximately $5 billion per year, not large in the context of the USDA budget, or of overall government spending, but a huge, roughly 40-fold increase of the program.
Germany’s Fraunhofer-Gesellschaft, the country’s largest organization for applied research, serves as a compelling model of what the MEP could become. It supports more than 80 research units and 60 Fraunhofer Institutes and in 2011 had a staff of 20,000, more than half of whom are scientists and engineers. It had an annual budget of €1.8 billion euros ($2.4 billion). More than 70 percent of Fraunhofer’s contract research is from contracts with industry and from publicly funded research projects. Almost 30 percent of its funding is provided by the German federal and state (lander) governments. (Fraunhofer 2012)
The U.S. GDP is approximately 4.2 times larger than Germany’s (IMF 2013b). If the U.S. MEP program were operated on the scale of the Fraunhofer-Gesellschaft, it would require total funding of $10.1 billion, of which $3.0 billion would be required from federal and state contributions. Thus, both the German and Japanese examples suggest U.S. spending on the MEP program should be expanded 20- to 40-fold. Expanding to a program of this scale would require time and resources to ensure that the needed capacities were developed and the resources well invested.
But expanding the MEP program would by no means be sufficient to restore U.S. manufacturing competitiveness. The United States would also need to greatly expand its national R&D infrastructure, both through funding programs within federal agencies such as the National Science Foundation, the Department of Energy, the Environmental Protection Agency, and the National Institutes of Health, and by creating a national system of research universities dedicated to developing manufacturing technology and training manufacturing engineers. This training system would serve as the manufacturing equivalent of the USDA’s system of land-grant colleges, but on a larger scale.
International comparisons also provide good models for labor/management relations, for financing small and medium-sized manufacturing firms and other exporting firms, and for training noncollege-educated workers. German manufacturers practice “stakeholder capitalism” in which boards of directors include an equal number of representatives of managers and workers (Meyerson 2011). Germany also has an entire sector of banks devoted to financing small and medium-sized firms, which reduces such firms’ need to rely on private capital markets and lessens the demand for maintaining short-term profits. Additionally, Germany has a highly developed school-to-work job-training system for noncollege-educated workers, which is much more effective than U.S. job training and displaced-labor-assistance programs. As a result, over the past decade Germany has maintained a large and growing trade surplus even relative to low-wage countries outside the eurozone, despite having some of the highest manufacturing compensation rates in the world (BLS 2011). Furthermore, it has maintained its competitiveness in world export markets, and its exports are dominated by autos and other high-value, durable manufactured goods.
There are externalities that lead U.S. private firms to underinvest in training, R&D, and other activities that would be supported by supply-side policies previously suggested. There are also market imperfections in capital markets that need to be addressed with new public institutions, as suggested above. These market imperfections provide an economic justification for investing public resources in activities that would enhance U.S. manufacturing capacity.
While it is beyond the scope of this [statement] to detail a comprehensive program to develop a world-class environment to support U.S. manufacturing, it is clear that such programs are necessary and would greatly aid expansion of manufacturing and other traded industries, creating millions of additional jobs. Rebuilding manufacturing through rebalancing trade can help restructure the U.S. economy, close the output gap, and help return the U.S. economy to full employment. In the absence of such programs, the United States appears destined to suffer through a “lost decade” or more of excessive unemployment and output far below potential (Fieldhouse and Bivens 2012).
On the other hand, implementing more effective trade and industrial policies, coupled with massive investments in infrastructure, clean technologies, and renewable energy, could reduce or eliminate the U.S. trade deficit altogether. This would support millions of additional good jobs, add hundreds of billions of dollars to U.S. GDP, and reduce unemployment and federal budget deficits while greatly improving state and local finances. These policies would be win-win for the United States, its workers, U.S. communities, and manufacturing and other high-wage domestic industries such as construction and utilities.
Question 5. What is the U.S. doing to address worker readiness and education?
It is important to note that at this stage of the recovery, there is very strong evidence suggesting that a shortage of training or skills mismatches are not responsible for current high levels of unemployment. As of December 2013, there were still more than 2.5 unemployed workers for every available job opening in the country. There were between 1.3 and 8.2 times as many unemployed workers as job openings in every industry. In no industry does the number of job openings even come close to the number of people looking for work (Shierholz 2014).
There is some evidence that employer paid training in the United States has increased slightly in 2013. The American Society for Training and Development (ASTD) estimated that organizations spent $164.2 billion on training in 2012, up from $156 billion in 2011 (Cook 2014). An earlier study for the Employment and Training Administration of the U.S. Department of Labor and the ASTD found that in 2006 businesses spent $46–$54 billion per year on training. However, only one-fifth to one-third of employees received training from their employer, and more educated workers were more likely to receive training (Nightingale and Mikelson 2013) . Thus, most workers did not receive job training from their employer.
Question 7. Why negotiate a Bilateral Investment Treaty (BIT) with China? Why seek an agreement that ensures U.S. companies are better able to move jobs to China?
This question illustrates the tension between policies that are good for U.S. companies, and those that benefit the United States as a location for jobs and production. The data on the economic impacts of foreign investment and “insourcing” are quite clear. Between 1990 and 2006, foreign multinational companies (MNCs) operating in the U.S. were responsible for the net loss of 4 million jobs in domestic firms taken over by those companies, due to layoffs, firms that spun off (and including net jobs created in startups owned by those firms) (Scott 2007).
As Scott (2007) notes, one of the major motivations for negotiating a BIT is to encourage foreign multinationals to invest in the United States. Public officials often take credit for the local jobs created or retained by such investments. Millions of dollars in public money are often offered as incentives to attract such investments, in what often becomes a race-to-the bottom among cities and states that engage in “smokestack chasing.” Less attention has been given to what happens after the initial investment takes place. Sometimes foreign MNCs make an initial job-creating investment and then change their mind. Swedish MNC Electrolux, for example, manufactured refrigerators for years in Greenville, Michigan, but recently closed the plant and moved most of its 2,700 jobs to Mexico (Grand Rapids Press 2008).
Insourcing is often deliberately designed to remove jobs from American industries. Foreign multinationals buy U.S. firms, hollow them out, and then outsource production to their home countries. For example, a few years ago the Indian firm GHLC acquired Dan River, a U.S. textile company. News reports confirmed that “Indian firms are attracted in particular to companies whose brands enjoy considerable popularity in their home markets as those brands can be manufactured more cheaply in their Indian plants” (Business Wire 2007). A similar fate likely awaits Smithfield foods, which was recently purchased by China’s Shanghui (IndustryWeek 2013).
Stepping back from the plant-level view of insourcing, Figure F provides data on total trade by U.S. and foreign MNCs for 1997 to 2011. Overall, these firms have been responsible for a growing share of the U.S. trade deficit. Though not shown in the figure, foreign MNCs alone were responsible for nearly half (44.2 percent) of the U.S. goods trade deficit in 2011. It is, in general, true that foreign companies invest in the United States to gain access to this market.
Trade deficit of MNCs* operating in the U.S. as a share of the total U.S. goods trade deficit, 1997–2011
| Year | Total MNC trade balance as a share of total U.S. goods trade balance |
|---|---|
| 1997 | 19.2% |
| 1998 | 26.6% |
| 1999 | 36.8% |
| 2000 | 43.6% |
| 2001 | 46.7% |
| 2002 | 47.3% |
| 2003 | 47.3% |
| 2004 | 48.5% |
| 2005 | 52.5% |
| 2006 | 53.2% |
| 2007 | 57.8% |
| 2008 | 61.3% |
| 2009 | 81.1% |
| 2010 | 73.8% |
| 2011 | 71.1% |
*Multinational companies
Source: Author's analysis of Bureau of Economic Analysis Direct Investment and Multinational Companies interactive tables and National Income and Product Account interactive tables (BEA 2013a and 2013b)
In the 1990s and before, it was true that U.S. MNCs also invested abroad to gain market access. U.S. MNCs used to have a goods trade surplus until 2000. Since then, these firms have developed a large and growing trade deficit. The dominant mode of production for U.S. MNCs is now oriented largely towards outsourcing production of goods destined for sale in the United States. U.S. trade deficits with China and other countries have displaced millions of jobs in the United States. Overall, U.S. and foreign MNCs are responsible for nearly three-fourths (71.1 percent) of the U.S. goods trade deficit in 2011, and shown in Figure F, and hence for most of the jobs displaced by trade in the United States. Thus, the globalization of finance, and the rapid growth of MNCs, have hurt the U.S. economy through the contributions of these firms to growing U.S. trade deficits and trade-related jobs losses. What is good for Wall Street is definitely not good for Main Street in America.
The United States would be better served by using the scarce resources devoted to negotiating new international trade agreements and investment treaties to improve the enforcement of U.S. fair trade laws. The risks associated with a new BIT, especially with China, greatly outweigh any potential benefits.
—The author thanks Ross Eisenbrey for comments and William Kimball for research assistance.
References
American Society of Civil Engineers (ASCE). 2013 Report Card for America’s Infrastructure. http://www.infrastructurereportcard.org/
Autor, David H., David Dorn, and Gordon H. Hanson. 2012. The China Syndrome: Local Labor Market Effects of Import Competition in the United States. National Bureau of Economic Research, Working Paper #18054. http://www.nber.org/papers/w18054
Bergsten, C. Fred, and Joseph E. Gagnon. 2012. Currency Manipulation, the US Economy, and the Global Economic Order. Peterson Institute for International Economics, Policy Brief 12-25. http://piie.com/publications/interstitial.cfm?ResearchID=2302
Bivens, Josh. 2011. Method Memo on Estimating the Jobs Impact of Various Policy Changes. Economic Policy Institute. http://www.epi.org/publication/methodology-estimating-jobs-impact/
Bivens, Josh. 2013. Using Standard Models to Benchmark the Costs of Globalization for American Workers Without a College Degree. Economic Policy Institute, Briefing Paper #354 http://www.epi.org/publication/standard-models-benchmark-costs-globalization/
Bivens, Josh, and Katherine Edwards. 2010. Cheaper Than You Think—Why Smart Efforts to Spur Jobs Cost Less Than Advertised. Economic Policy Institute. Policy Memo #165. http://www.epi.org/publication/pm165/
Bureau of Economic Analysis (BEA). 2012. “Annual Industry Accounts: Gross Domestic Product by Industry” [interactive tables]. http://bea.gov/industry/index.htm#annual
Bureau of Economic Analysis (BEA). 2013a. “Direct Investment and Multinational Companies” [interactive tables]. http://bea.gov/international/index.htm#omc
Bureau of Economic Analysis (BEA). 2013b. “National Income and Product Account (NIPA)” [interactive tables]. http://bea.gov/national/index.htm#gdp
Bureau of Labor Statistics (BLS). 2011. “News Release: International Comparisons of Hourly Compensation Costs in Manufacturing, 2010.” Washington, D.C.: Bureau of Labor Statistics. USDL-11-1778. http://www.bls.gov/news.release/pdf/ichcc.pdf
Bureau of Labor Statistics (BLS). 2013. “Producer Price Indexes: Industry and Commodity data” [Excel files]. http://stats.bls.gov/ppi/
Bureau of Labor Statistics (BLS). 2014. “Table A-15. Alternative Measures of labor underutilization, U-6.” http://www.bls.gov/news.release/empsit.t15.htm
Bureau of Labor Statistics, Employment Projections program (BLS–EP). 2011a. “Special Purpose Files—Employment Requirements; Chain-Weighted (2005 dollars) Real Domestic Employment Requirements Table for 2010” [DAT file, converted to Excel sheet and Stata data file]. http://www.bls.gov/emp/ep_data_emp_requirements.htm
Bureau of Labor Statistics, Employment Projections program (BLS–EP). 2011b. “Special Purpose Files—Industry Output and Employment – Industry Output” [DAT File, converted to Excel sheet and Stata data file]. http://www.bls.gov/emp/ep_data_industry_out_and_emp.htm
Business Wire. 2007. Indian textiles and apparel companies have been motivated by the scope for gaining technical and marketing expertise from foreign partners. June 13, 2007. (Dublin).
Congressional Budget Office (CBO). 2013a. “Baseline Economic Forecast—February 2013 Baseline Projections” [spreadsheets downloaded December 6]. http://www.cbo.gov/publication/43902
Congressional Budget Office (CBO). 2013b. “The 2013 Long-Term Budget Outlook: Supplemental Data” [spreadsheets downloaded October 18]. http://www.cbo.gov/publication/44521
Congressional Budget Office (CBO). 2014. “Baseline Economic Forecast—February 2014 Baseline Projections.” [spreadsheets downloaded February 13]. http://www.cbo.gov/publication/45066
Cook, Dan. 2014. “Employers Spend More on Training.” benefitspro.com; http://www.benefitspro.com/2014/01/16/employers-spending-more-on-training
Economic Policy Institute (EPI). 2013. “Recession Has Left in Its Wake a Jobs Shortfall of Nearly 8 Million.” EPI Economic Indicator, Dec. 6. www.stateofworkingamerica.org
Economic Policy Institute (EPI). 2014. “Missing Workers: The Missing Part of the Unemployment Story.” An EPI Economic Indicator. February 20.
Ezell, Stephen J., and Robert D. Atkinson. 2011. International Benchmarking of Countries Policies and Programs Supporting SME Manufacturers. The Information Technology & Innovation Foundation. http://www.itif.org/publications/international-benchmarking-countries%E2%80%99-policies-and-programs-supporting-sme-manufacturer
Ezell, Stephen J., and Robert D. Atkinson. 2012. Fifty Ways to Leave Your Competitiveness Woes Behind: A National Traded Sector Competitiveness Strategy. The Information Technology & Innovation Foundation. http://www.itif.org/publications/fifty-ways-leave-your-competitiveness-woes-behind-national-traded-sector-competitivenes
Fieldhouse, Andrew, and Josh Bivens. 2012. “True Deficit Hawks Would Be Worried with Jobs and Recovery First.” Working Economics (Economic Policy Institute blog), November 28. http://www.epi.org/blog/deficit-hawks-jobs-recovery/
Fraunhofer. 2012. “Facts and Figures at a Glance.” http://www.fraunhofer.de/en/about-fraunhofer.html
Gagnon, Joseph E. 2013. The Elephant Hiding in the Room: Currency Intervention and Trade Balances. Peterson Institute of International Economics, Working Paper 13-2. http://iie.com/publications/interstitial.cfm?ResearchID=2347
Grand Rapids Press. 2008. “PBS Documentary Features Workers Idled by Electrolux Closing.” April 17. http://blog.mlive.com/grpress/2008/04/pbs_documentary_features_worke.html
Industry Week. 2013. “China’s Shuanghui Buys Meat Processor Smithfield Foods” May 29. http://www.industryweek.com/companies-amp-executives/chinas-shuanghui-buys-meat-processor-smithfield-foods
International Monetary Fund (IMF). 2013a. International Financial Statistics. Washington, D.C.: International Monetary Fund. CD Rom.
International Monetary Fund (IMF). 2013b. World Economic Outlook Database: October 2013 Edition. http://www.imf.org/external/pubs/ft/weo/2013/02/weodata/index.aspx
International Trade Administration (ITA). 2012. “ Powering Export Growth.” http://trade.gov/cs/cs_annualreport12.pdf
International Trade Administration (ITA). 2013. “National Export Initiative.” http://trade.gov/nei/
Kondo, Ayako, and Justin Svec. 2009. “Fiscal Policy Cyclicality and Growth within the U.S. States.” College of Holy Cross, Department of Economics. Faculty Research Series, Paper No. 09-11. (Working paper—draft subject to future revisions). http://college.holycross.edu/RePEc/hcx/Kondo-Svec_FiscalCyclicality.pdf
Meyerson, Harold. 2011. “Back from China.” The American Prospect, vol. 10, no. 22. http://prospect.org/article/back-china
Nightingale, Demetra, and Kelly Mikelson. “Estimating Public and Private Expenditures on Job Training in the U.S.” Presentation for Workforce Innovations 2006 conference cosponsored by the U.S. Department of Labor Education and Training Administration and the American Society for Training and Development, Anaheim Convention Center, Anaheim, Calif., July 11–13, 2006. http://www.doleta.gov/reports/pdf/on_job_training_in_us.pdf
NIST (National Institute of Standards and Technology). 2012. “President’s FY 2013 Budget Request for NIST Targets Advanced Manufacturing, Critical Science and Technology Programs” [press release]. http://www.nist.gov/public_affairs/releases/budget_2013.cfm
OpenCongress.org. 2013a. S.1114 Currency Exchange Rate Oversight Reform Act of 2013. http://www.opencongress.org/bill/s1114-113/show
OpenCongress.org. 2013b. H.R.1276 Currency Reform for Fair Trade Act. http://www.opencongress.org/bill/hr1276-113/shown
Pierce, Justin R. and Peter K. Schott. 2012. The Surprisingly Swift Decline of U.S. Manufacturing Employment. National Bureau of Economic Research, Working Paper #18655. http://www.nber.org/papers/w18655
Scott, Robert E. 2007. The Hidden Costs of Insourcing: Higher Trade Deficits and Job Losses for U.S. Workers. Economic Policy Institute. Issue Brief #236. http://www.epi.org/publication/ib236/
Scott, Robert E. 2013a. Trading Away the Manufacturing Advantage: China Trade Drives Down U.S. Wages and Benefits and Eliminates Good Jobs for U.S. Workers. Economic Policy Institute, Briefing Paper #367. http://www.epi.org/publication/trading-manufacturing-advantage-china-trade/
Scott, Robert E. 2013b. Value-Added Analysis of Trade with China Could Weaken Fair Trade Enforcement and Increase Job Loss. Economic Policy Institute, Briefing Paper #361. http://www.epi.org/publication/bp361-value-added-china-fair-trade-jobloss/
Scott, Robert E. 2013c. “Transatlantic Free Trade Agreement: Job Claims Are Pure Baloney.” Working Economics (Economic Policy Institute blog). http://www.epi.org/blog/transatlantic-free-trade-agreement-job-claims/
Scott, Robert E. 2014a. Stop Currency Manipulation and Create Millions of Jobs: With Gains across States and Congressional Districts. Economic Policy Institute, Briefing Paper #372. http://www.epi.org/publication/stop-currency-manipulation-and-create-millions-of-jobs/
Scott, Robert E. 2014b (forthcoming). China Trade Toll. Economic Policy Institute, Briefing Paper #373.
Scott, Robert E., Helene Jorgensen, and Doug Hall. 2013. Reducing U.S. Trade Deficits Will Generate a Manufacturing-based Recovery for the United States and Ohio. Economic Policy Institute, Briefing Paper #351. http://www.epi.org/publication/bp351-trade-deficit-currency-manipulation/
Shierholz, Heidi. 2014. Four-and-a-Half Years Since Recovery Began, No Jobs for More Than 60% of Job Seekers. Economic Policy Institute, Economic Indicators, February 11. http://www.epi.org/publication/years-recovery-began-jobs-60-job-seekers/
Silk, Richard. 2013. “China’s Foreign Exchange Reserves Jump Again.” Real Time Economics (Wall Street Journal blog). October 15. http://blogs.wsj.com/economics/2013/10/15/chinas-foreign-exchange-reserves-jump-again/
UN Comtrade. 2013. United Nations Commodity Trade Statistics Database. Spreadsheet downloaded December 18, 2013. http://comtrade.un.org/db/dqBasicQuery.aspx
U.S. Census Bureau. 2013. “American Community Survey: Special Tabulation Over 45 industries, Covering 435 Congressional Districts and the District of Columbia (113th Congress Census Boundaries), Plus State and US Totals Based on ACS 2011 1-year file” [spreadsheets received March 6].
U.S. Department of Agriculture (USDA). 2012. FY 2013: Budget Summary and Annual Performance Plan. http://www.obpa.usda.gov/budsum/FY13budsum.pdf
U.S. International Trade Commission (USITC). 2013. USITC Interactive Tariff and Trade DataWeb [Excel files]. http://dataweb.usitc.gov/scripts/user_set.asp
Zandi, Mark. 2011. “At last, The U.S. Begins a Serious Fiscal Debate.” Moody’s Analytics. https://www.economy.com/dismal/article_free.asp?cid=198972
Endnotes
1. H.R. 1276 and S.1114 would allow the Commerce Department to treat currency manipulation as a subsidy in Countervailing Duty trade cases (OpenCongress.org 2013b and 2013a).
2. Autor, Dorn, and Hanson (2012) examine the period from 1990 to 2007. Pierce and Schott (2012) examine data for March 2001 to March 2007.
