This report was produced in collaboration with the Broader, Bolder Approach to Education.
What this study finds: Extensive research has conclusively demonstrated that children’s social class is one of the most significant predictors—if not the single most significant predictor—of their educational success. Moreover, it is increasingly apparent that performance gaps by social class take root in the earliest years of children’s lives and fail to narrow in the years that follow. That is, children who start behind stay behind—they are rarely able to make up the lost ground.
Using data from two academic cohorts, the kindergarten classes of 1998 and 2010, this study examines the relationship between children’s socioeconomic status (SES) and their cognitive and noncognitive skills when starting school. We find that large performance gaps exist between children in the lowest and highest socioeconomic-status (SES) quintiles and that these gaps have persisted from the 1998 cohort to the 2010 cohort. The positive news is that the gaps have not grown, even as economic inequalities between these two groups of students have grown. The negative news is that the gaps have not narrowed, despite the fact that low-SES parents have substantially increased their engagement in their children’s early education.
Why it matters: These performance gaps reflect extensive unmet needs and thus untapped talents among low-SES children. The development of strong cognitive and noncognitive skills is essential for success in school and beyond. Low educational achievement leads to lowered economic prospects later in life, perpetuating a lack of social mobility across generations. It is also a loss to society when children’s talents are allowed to go fallow for lack of sufficient supports. The undeniable relationship between economic inequalities and education inequalities represents a societal failure that betrays the ideal of the “American dream.”
What can be done about it: Greater investments in pre-K programs can narrow the gaps between students at the start of school. And to ensure that these early gains are maintained, districts can provide continued comprehensive academic, health, nutrition, and emotional support for children through their academic years, including meaningful engagement of parents and communities. Such strategies have been successfully implemented in districts around the country, as described in this report, and can serve to mitigate the impact of economic inequalities on children’s educational achievement and improve their future life and work prospects.
For further discussion of policy solutions, see the companion to this report, Reducing and Averting Achievement Gaps: Key Findings from the Report ‘Education Inequalities at the School Starting Gate’ and Comprehensive Strategies to Mitigate Early Skills Gaps.
Executive summary
High and rising inequality is one of the United States’ most pressing economic and societal issues. Since the early 1980s, the total share of income claimed by the bottom 90 percent of Americans has steadily decreased, with the majority of income gains going to the top 1 percent. These trends would not be such a major concern if our education system compensated for these inequities by helping level the playing field and enabling children to rise above their birth circumstances.
But that is hardly the case. Rather, the fraction of children who earn more than their parents (absolute mobility) has fallen from approximately 90 percent for children born in 1940 to 50 percent for children born in the 1980s. And the tight links between economic inequalities and achievement gaps cast doubt on asserted equality of opportunity that promotes social mobility and puts the “American Dream” within viable reach.
Extensive research has conclusively demonstrated that children’s social class is one of the most significant predictors—if not the single most significant predictor—of their educational success. Moreover, it is increasingly apparent that performance gaps by social class take root in the earliest years of children’s lives and fail to narrow in the years that follow.
Much is known about the determinants and mechanisms that drive early skills gaps among children of different backgrounds, but our failure to narrow social-class-based skills gaps from one generation of students to the next calls for further analysis to determine the degree of influence these factors have and how interventions employed in recent years to address these factors have or have not worked and why. Moreover, shifting economic and demographic landscapes emphasize the need for more robust policy strategies to address the gaps. This three-part study thus combines a statistical analysis of early skills gaps among a recent cohort of children and changes in them over time with a qualitative study of multifaceted, school-district-level strategies to narrow them.
What we do: Questions, data and methodology
In this paper, we:
- Use data from the National Center for Education Statistics (NCES): the Early Childhood Longitudinal Study of the Kindergarten Classes of 1998–1999 and 2010–2011 to measure gaps in skills by social class. To measure gaps by social class, we use the socioeconomic status (SES) metric (primarily), a composite of information on parents’ educational attainment and job status as well as household income. We compare the average performance of children in the top fifth of the socioeconomic status distribution (high-SES) with the average performance of children in the bottom fifth (low-SES). Skills measured include reading and mathematics, as well as self-control and approaches to learning as reported by both teachers and parents.
- Examine SES-based gaps at kindergarten entry among the most recently surveyed cohort (the kindergarten class of 2010–2011). We study how gaps manifest in both cognitive and so-called noncognitive skills, as both skill types are important components of children’s development.
- Compare these SES gaps with those of an earlier cohort (1998–1999), with a focus on changes in the skills gaps between children in the high- and low-SES quintiles. We also analyze how sensitive gaps are to the inclusion of key determinants of student performance, such as family composition, children’s own characteristics, pre-K participation, and parental and educational practices at home.
- Review a set of 12 case studies of communities that have employed comprehensive educational strategies and wraparound supports to provide more children (especially low-income children) with strong early academic foundations, and to sustain and build on early gains throughout their K–12 school years.
- Based on examples from these diverse communities, we discuss implications: strategies that districts can employ and district and state policy changes to make those strategies easier to adopt and more sustainable. The report ends with conclusions and recommendations for further research, practice, and policy.
What we find
Our quantitative research produces a broad set of findings:
- Very large SES-based gaps in academic performance exist and have persisted across the two most recent cohorts of students when they start kindergarten. The estimated gaps between children in the highest and lowest fifths of the SES distribution are over a standard deviation (sd) in both reading and math in 2010 (unadjusted performance gaps are 1.2 and 1.3 sd respectively). Gaps in noncognitive skills such as self-control and approaches to learning are roughly between one-third and one-half as large (unadjusted performance gaps are about 0.4 sd in self-control, and slightly over 0.5 sd in approaches to learning in 2010).
- SES-based gaps across both types of skills among the 2010 kindergartners are virtually unchanged compared with the prior academic generation of students (the class of 1998). The only unadjusted cognitive skills gap between children in the high-SES and low-SES fifths that changed significantly over this period was the gap in reading skills, which increased by about a tenth of a standard deviation. Gaps in approaches to learning as reported by teachers and in self-control as reported by parents shrank between 1998 and 2010 by roughly the same amount (0.1 sd). Gaps in mathematics, in approaches to learning as reported by parents, and in self-control as reported by teachers did not change significantly.
- Taking into account children’s individual and family characteristics, we find that parental activities, parental expectations for their children’s attainment, and pre-K participation reduce the gaps between high-SES and low-SES children somewhat but do not come close to eliminating them.
- This means that though part of the SES gap is attributable to differences in these characteristics and in family investments between children in the high and low parts of the SES distribution, a substantial share of SES-related factors is not captured by these controls, but is important to explaining how and why gaps develop, and thus how to narrow them.
- Moreover, the capacity for these other factors to narrow gaps has decreased over time—as a whole, they accounted for a smaller share of the gaps in 2010 than they had in 1998. This suggests that, while such activities as parental time spent with children and center-based pre-K programs cushion the negative consequences of growing up in a low-SES household, they can do only so much, and that the consequences of poverty are increasingly hard to compensate for. This resistance of gaps to these controls is thus a matter of serious concern for researchers and policymakers alike.
- The characteristics of children in the lowest-SES quintile and highest-SES quintile changed between 1998 and 2010.
- Among children in the low-SES quintile, in 2010 a larger share lived in poverty (84.6 percent, up from 71.3 percent in 1998), did not live with two parents (54.9 percent vs. 45.6 percent), and lived in homes where the main language is not English (40.3 percent vs. 31.2 percent). Just over half of these children (50.4 percent) were Hispanic (in 1998, 39.8 percent were).
- These children’s likelihood of attending center-based pre-K did not change significantly across generations (about 44 percent for both cohorts: 44.3 percent in 2010 vs. 43.7 percent in 1998). However, in 2010 their parents reported having a somewhat larger number of books at home for the children, and there was also an increase in both indices of activities (literacy/reading activities and other educational and engagement activities).
- In addition to doing more for their children, low-SES parents have greater expectations for their children’s educational attainment—a much smaller share saw them going no further than high school graduation, while a much greater share anticipated their children attaining bachelor’s and even advanced degrees in 2010.
- Among children in the high-SES quintile, the group in 2010 includes a lower share of white children (falling from 78.8 percent in 1998 to 71.3 percent) and a larger share of Asian children (increasing from 4.7 percent in 1998 to 8.7 percent).
- They were slightly more likely to live with two parents (the share not living with two parents decreased from 11.1 percent in 1998 to 9.6 percent) and to have attended center-based pre-K (the share in center-based pre-K increased from 65.8 in 1998 to 69.9 percent in 2010).
- The share of high-SES homes reporting having more than 200 children’s books slightly increased in 2010, as did parents’ expectations for their children’s educational attainment.
- Among children in the low-SES quintile, in 2010 a larger share lived in poverty (84.6 percent, up from 71.3 percent in 1998), did not live with two parents (54.9 percent vs. 45.6 percent), and lived in homes where the main language is not English (40.3 percent vs. 31.2 percent). Just over half of these children (50.4 percent) were Hispanic (in 1998, 39.8 percent were).
- Although research uses various indicators to measure individuals’ social class, from composite measures such as the socioeconomic status index we use to single indicators such as mother’s education or income, some sensitivity of the results to the indicator used is found. In our analyses, we find that all are equally reliable social-class proxies for the estimation of early achievement gaps, though absolute gaps and trends in them vary slightly depending on the indicator used.
Our qualitative review of community interventions also provides valuable information:
- A growing number of school districts across the country have embraced systems of comprehensive enrichment and supports for many or even all their students, based on the understanding that nurturing healthy child development requires leveraging the entire community. These districts took different approaches to enacting those comprehensive strategies, based on each community’s particular mix of needs and assets, ideological leaning, available sources of funding, and other factors. But all begin very early in children’s lives and align enriching school strategies with a targeted range of supports for children and their families.
- Moreover, school districts embracing what we refer to as “whole-child” approaches to education are seeing better outcomes for students, from improved readiness for kindergarten to higher test scores and graduation rates and narrower achievement gaps. They thus can provide guidance to other districts and to policymakers regarding how to implement such approaches, what to expect in terms of benefits, and which policies at the local and state levels can advance those approaches.
Conclusions
While the persistence of large skills gaps at kindergarten entry is troubling, the fact that, by and large, they did not grow in a generation—despite steadily increasing income inequality compounded by the worst economic crisis in many decades—is a good thing. But we must still be very concerned about these gaps. We would have liked to see evidence that parents’ increased dedication to and investments in their children’s early development, and increased investments in pre-K programs and other early education and economic supports, closed these gaps. However, the data suggest that these efforts simply contained them, and that these positive trends were insufficient to narrow the skills gaps at kindergarten entry. This failure to narrow gaps points to a lack of appropriate policy response at all levels of government, the neglect of decades of research across multiple disciplines on child development, and the resulting waste of critical opportunities to nurture an entire generation of children.
The policy recommendations of this report strengthen the idea that we need much greater investments in pre-K programs and continued comprehensive support for children through their academic years, including meaningful engagement of parents and communities, if we are to substantially improve the odds for disadvantaged children, in light of their extensive unmet needs and untapped talents.
Introduction: Facts about income inequality and its growth over time
One of today’s most pressing economic issues is the worrisome level of income inequality. Since 1979, the total share of income claimed by the bottom 90 percent of Americans has steadily decreased (Bivens 2016). In 1979, that 90 percent received about 67 percent of cash, market-based income (i.e., pretax income). By 2015, their share had decreased to about 52 percent of pretax income. The majority of income gains during this period went to the top 1 percent (EPI 2013; Mishel and Schieder 2016; Saez 2016). Polls reflect widespread concern about income and wage inequalities and associated trends and the desire for policies to address these inequalities (New York Times 2015).
Rising inequality might not be such a major concern if our education, economic, and social protection systems acted as compensatory mechanisms, helping individuals, and especially children, rise above their birth circumstances and improve their mobility. But that is hardly the case. Rather, the fraction of children who earn more than their parents (a measure of what social scientists refer to as absolute mobility) has fallen from approximately 90 percent for children born in 1940 to 50 percent for children born in the 1980s (Chetty et al. 2016). Children of certain ethnic and racial minorities who are disproportionately likely to live in concentrated poverty are also more likely to do so over prolonged periods of time (Sharkey 2013). And the close connections between education inequalities and economic inequalities cast doubt on assertions that America provides “equality of opportunities” that promotes social mobility (Mishel 2015).
The influence of income inequality affects multiple aspects of society’s functioning, from health outcomes and even life expectancy to democratic ideals (Putnam 2015; Schanzenbach et al. 2016; Stringhini et al. 2017). In the education arena, children’s socioeconomic status (SES), of which income is a key component, is considered one of the most significant predictors—if not the most significant predictor—of educational success. A number of studies show the strong relationship between social class (of which socioeconomic status is a frequent measure) and test scores, educational attainment, and college attendance and completion (see Duncan, Morris, and Rodrigues 2011; García 2015; García and Weiss 2015; Lee and Burkam 2002; Mishel et al. 2012; Putnam 2015; among others).
As a result of these trends and associations, achievement gaps by social class have grown substantially since the 1960s, especially between children at the highest end of the income distribution and all of the others (Reardon 2011). Some researchers have identified a large increase in parental investment in education among high-SES parents as one driver of the divergence in education outcomes (Duncan and Murnane 2011), among other contributing factors, such as time parents spend with their children and time parents devote to education-enhancing activities (Morsy and Rothstein 2015; Van Voorhis et al. 2013): Spending on education-enhancing activities by parents in the top income fifth nearly tripled between the 1970s and the 2000s (from $3,500 in 1972 to $8,900 in 2006), while such spending by parents in the bottom income fifth remained low and changed much less (from $800 in 1972 to $1,300 in 2006) (Duncan and Murnane 2011).1 More time can mean more frequent interactions during playtime, more time spent reading to children, and other parenting practices that contribute to children’s learning and development (Barbarin et al. 2010). In general, more leisure and educational time with children can promote their development and school readiness (Brooks-Gunn and Markman 2005; Hart and Risley 1995; Phillips 2011; Rothstein 2004; Van Voorhis et al. 2013; Waldfogel 2006). Given the evidence that parental engagement and spending directly and continuously translate into improvements in children’s achievement and preparation, the presence of the various achievement gaps are not surprising.
Education researchers and policymakers have long been attentive to issues related to equity—by race/ethnicity, SES, gender, and other characteristics. At least since the 1966 publication of the “Coleman Report” by sociologist James S. Coleman and coauthors, researchers and policymakers have understood the critical impacts of race, poverty, and segregation on educational attainment (Coleman et al. 1966). And educational inequities remain a major problem today. Rigorous research demonstrates that inequalities in both opportunity and outcomes along the lines of race and social class begin early and often persist throughout students’ K–12 years and beyond, and that they are much larger in the United States than in comparable countries (Bradbury et al. 2015; Putnam 2015). Some of the research carefully describes the specific contexts and challenges that minority and lower-social-class students face and how these challenges create early education gaps. Other studies illustrate the consequences of these gaps for children’s later learning and development (Duncan et al. 2007; Duncan and Magnuson 2011).2 And though this body of research is smaller, a few studies have looked at trends in inequalities across cohorts (Carnoy and García 2017; Magnuson and Duncan 2016; Reardon 2011; Reardon and Portilla 2016), with mixed or inconclusive findings regarding the changes in the gaps.3 In addition, these latter studies, however, do not address causes that could drive changes in the gaps over time. As such, there is a need both for a better understanding of these causes and for strategies to counter them.
In this paper, we describe recent skills gaps and trends in them by social class, as measured by socioeconomic status; analyze some of the major factors driving the gaps; and explore a set of diverse school district-level initiatives that are helping to narrow gaps. The paper is structured in three sections.
- First, we examine social-class-based gaps at kindergarten entry among the most recently surveyed kindergarten cohort (the kindergarten class of 2010–2011). We study how gaps manifest in both cognitive and so-called noncognitive skills, as both skill types are important components of children’s development.
- Next we compare these gaps with those of an earlier kindergarten cohort. We look at changes from 1998 to 2010 in the skills gaps between children in the top and bottom social-class quintiles (primarily using SES as the proxy for social class). We also analyze how sensitive gaps are to the inclusion of several key determinants of student performance, such as children’s own characteristics, family composition, and parental and education practices at home.
- Then we review a set of case studies of school districts that have employed comprehensive educational strategies to provide more children (especially low-income children) with strong early academic and life foundations, and to sustain and build on early gains throughout the K–12 school years.
- Finally, we look at the implications of our findings, and, based on the case study examples from diverse communities, we discuss strategies that districts can employ along with district and state policy changes that will make those strategies easier to adopt and more sustainable.
For the first two analyses, we use two nationally representative studies from the National Center for Education Statistics (NCES): the Early Childhood Longitudinal Study of the Kindergarten Classes of 1998–1999 and 2010–2011. These data provide information about children’s skills and about the children themselves, such as their race/ethnicity, socioeconomic status, language spoken at home, etc. The data also provide information on the children’s experiences in their early years, such as how actively their parents engaged them in enriching activities, whether they attended prekindergarten care, and the number of books the child has (see Appendix A). This information allows us to test the associations between children’s characteristics and their educational outcomes at school entry. For the second analysis, we draw on 12 case studies of community and school districts employing comprehensive educational strategies (Weiss 2016a–h). We explore the qualitative information provided on investments these districts have made in early childhood education, on both within-school and broader K–12 supports for children, and on evidence that these investments are delivering both improved academic achievement and broader gains for children. Based on this evidence, the report ends with conclusions and recommendations for further research, practice, and policy. Appendices A and B provide detailed discussions of the data and methodology used in this paper.
How large are recent performance gaps at kindergarten entry?
This section documents inequalities among the most recently tracked cohort of students as they entered kindergarten in 2010. It provides us with the most recently available view of the various aspects of gaps at the school starting gate, all of which are critically important for understanding the implications of those gaps. The findings below draw on the Early Childhood Longitudinal Study of the Kindergarten Class of 2010–2011, and we use data from the fall measurement in the kindergarten year. (This section partly builds on our previous work; see García 2015 and García and Weiss 2015. See Appendices A and B for details on the variables and methodology used.)
Our decision to examine performance in both cognitive and noncognitive skills reflects growing acceptance that children’s development is a complex process in which both skill types build on and interact with each other, and on evidence of the roles that both types of skills play in the education process and adulthood outcomes (see García 2015; García and Weiss 2016; Levin 2012a, 2012b). Traits and skills such as critical thinking, creativity, problem-solving, persistence, and self-control are vitally important to children’s full development, and are nurtured through life and school experiences. These skills, sometimes referred to as noncognitive or social and emotional skills, tend to develop—or lag—in tandem with cognitive skills. Noncognitive or social and emotional skills are thus linked to academic achievement, and also to outcomes in adult life, such as productivity and collegiality at work, good health, and civic participation.
For these analyses, we use a measure of socioeconomic status that has three components: the educational attainment of parents or guardians, parents’ occupational prestige (determined by a score), and household income (see more details about the SES construct in Tourangeau et al. 2013, 7-56 to 7-60). We divide children of the 2010–2011 kindergarten class into five groups based on SES quintile. To measure the gaps in performance by socioeconomic status, we compare the average performance of children in the top fifth of the SES distribution with the average performance of children in the bottom fifth. This provides an estimate of the relative advantage of a child in the top fifth of the SES distribution (referred to in this report as “high-SES”) with respect to a child in the bottom fifth (“low-SES”).
Children are not equally prepared for school when they enter kindergarten, and our analyses show that students’ social class strongly determines their relative position in the performance distribution. Most socioeconomically disadvantaged children lag substantially in both reading and math skills, and these skills levels rise along with socioeconomic status (sometimes referred to as socioeconomic gradients). Children in the highest socioeconomic group score significantly higher in reading and math than children in the lowest socioeconomic group. As Table 1 shows, the relative unadjusted gaps in reading and math, i.e., the advantages of high-SES children relative to low-SES children in 2010 are 1.17 and 1.25 sd, respectively (Table 1 also shows that, after controlling for clustered data, the gaps are 0.94 and 0.91 sd, respectively).4 Reading and math skills advantages of children in the middle of the SES distribution relative to the lowest SES group are roughly half as large as the advantages of high-SES children to the lowest SES group.5
Children in the lowest socioeconomic quintile also lag substantially in noncognitive skills, based on assessments by both parents and teachers, although these gaps are smaller than those in reading and math. Socioeconomic-based gaps in self-control and approaches to learning are approximately one-third to one-half as large as gaps in reading and math.6 In 2010, children in the high-SES quintile scored 0.38 sd and 0.51 sd higher in self-control and approaches to learning as reported by teachers (0.36 sd and 0.56 sd after clustering; see Table 1) than children at the low-SES quintile (see Figure A). Using parents’ assessments of the same skills, the gaps are 0.39 sd and 0.56 sd, respectively (0.33 sd and 0.46 sd after clustering; see Table 1).
Our analyses also document stark socioeconomic disparities in inputs, child and family characteristics, and other factors that can affect school readiness (Table 2). Here too we find a correlation between socioeconomic status and other factors that impede educational development. Low-SES students are more likely than their high-SES peers to be immigrants and less likely to speak English at home, to live with two parents, to have participated in center-based pre-K care activities in the previous year, and to have engaged in early literacy practices at home. Among children in the low-SES group, half (50.4 percent) are Hispanic, 23.1 percent are white, 19.6 percent are black, and 2.5 percent are Asian.7
Though these gaps in both cognitive and noncognitive skills are troubling and call for policy recommendations, better policy solutions can be designed if we understand how these gaps have changed over time and what factors have played a role in those changes. Education outcomes are the product of a combination of multiple factors, which can reinforce or mitigate relative advantages or disadvantages in a dynamic fashion. We examine these issues in the rest of the paper.
How do the performance gaps in the 2010–2011 kindergarten class compare with the gaps in the prior generation?
The analyses presented in this section compare the inequities in inputs and the performance gaps between high-SES and low-SES students who began kindergarten in 2010 with the gaps among high-SES and low-SES schoolchildren in the prior academic generation, the 1998 cohort. We also analyze factors that have had major influences on the changes in performance of kindergartners, and briefly discuss the research and policy implications of our findings.
How have the characteristics of the children in the lowest and highest SES groups changed in a generation?
We first analyze children’s characteristics by SES quintiles in the two cohorts. This enables us to identify differences in the characteristics of low-SES kindergartners in 2010 versus in 1998. These changes may help explain why the performance gaps we are studying grow or shrink (for example, if children in the low-SES quintile in 2010 were more likely than their 1998 peers to have access to public programs such as pre-K, they might be more prepared for kindergarten, and thus the relative advantage of high-SES children might shrink).8
Table 2 shows the student and family characteristics of the kindergarten classes of 1998–1999 and of 2010–2011, by SES quintile. The table also includes pre-K care arrangements and two indices of developmental activities parents undertake with their children—indices of “literacy/reading activities” and “other activities”).9 The table also summarizes parents’ expectations regarding their children’s educational attainment. To some extent, expectations are based on hope, but they can also respond to behavioral patterns children are exhibiting that hint at their future success. Expectations can also influence outcomes by representing how motivated parents are for their children’s education. The ECLS-K survey does not ask parents how their expectations (and changes in their expectations) affect their provision of educational activities or support, but their answers to the expectations question can be used as a reasonable proxy of the degree to which parents are aware of their children’s education and willing to support it.10
The most significant changes in children’s characteristics by SES quintile are for children in the bottom of the distribution. In 2010, a greater share of children in this group are Hispanic (50.4 percent, an increase of 10.6 percentage points relative to the 1998 share of 39.8 percent), live in homes where the main language is not English (40.3 percent, an increase of 9.1 percentage points from 31.2 percent in 1998), and are immigrants (49.8 percent, an increase of 19.5 percentage points from 30.3 percent in 1998). In 2010, a greater share of children do not live with two parents (54.9 percent, an increase of 9.3 percentage points from 45.6 percent in 1998), and live in poverty (84.6 percent, an increase of 13.3 percentage points from 71.3 percent in 1998). These substantially greater disadvantages for children at the bottom of the SES scale could all be reflections of both the much weaker national economic context in 2010 versus 1998 and the growing inequality described above.
These children’s likelihood of attending center-based pre-K did not change significantly across generations (about 44 percent for both cohorts), but they were more likely to be looked after by parents or relatives (with the share increasing from 46.4 percent in 1998 to 50.9 percent in 2010). These children’s parents also reported having a somewhat larger number of books at home for the children, and there were increases in their indices of educational and engagement activities (two composite measures, with the literacy/reading index measuring how frequently parents read books to their child, tell stories, sing songs, and talk about nature and how frequently the child reads picture books and reads outside of school, and the “other” index measuring how frequently parents and children play games or do puzzles, play a sport or exercise together, and build something or play with construction toys; and how often parents help children do arts and crafts and involve children in household chores). These parents’ expectations about their children’s educational attainment also changed significantly: the share who expected their children to attain no more than a high school diploma decreased by more than half (from 24.1 percent in 1998 to 11.4 percent in 2010), and the share of parents who expected their children to attain at least a bachelor’s degree increased, markedly for those expecting their children to obtain an advanced degree (a master’s degree, Ph.D., or M.D.).
Among children in the high-SES quintile, the group in 2010 includes a lower share of white children (falling from 78.8 percent in 1998 to 71.3 percent) and a larger share of Asian children (increasing from 4.7 percent in 1998 to 8.7 percent). Children in the high-SES group became slightly more likely to live with their two parents (the share of children who lived with one parent decreased from 11.1 percent in 1998 to 9.6 percent), and to have attended center-based pre-K (65.8 percent in 1998 and 69.9 percent in 2010). We only see a small increase in the reported number of books at home.11 The share of homes reporting having more than 200 books—the maximum—increased slightly in 2010, across all SES quintiles except for the middle quintile). As was true of low-SES parents, those in the highest quintile raised their expectations for their children’s educational attainment from 1998 to 2010. Compared with the 1998 cohort, a larger proportion of high-SES children in the 2010 cohort were expected by their parents to attain an advanced degree (master’s degree or higher), while a lower share expected their children to attain a bachelor’s degree only.
How did the performance gaps between the children in the lowest and highest SES groups change in a generation?
Changes over time in the input factors by socioeconomic status (child and family characteristics, early-education practices, and parents’ expectations) explored above have been found by researchers to have major impacts on the outcomes (test scores on reading and math, and measures of noncognitive skills) explored in this section.12 In other words, we would expect that changes in the unadjusted skills gaps (gap measures that do not include controls for child and family characteristics, early-education practices, and parents’ expectations) would partially reflect the compositional differences between the class of 2010–2011 and the class of 1998–1999. For example, we would anticipate that if the more recent generation’s low-SES parents read to their children more frequently, helped them do more arts and crafts, or had higher expectations for them, these factors would correlate with narrowing skills gaps. Also, we would expect that the adjusted skills gaps (gap measures that are net of the influence of child and family characteristics, early-education practices, and parents’ expectations, and thus reflect the SES gaps) would be different for the two cohorts if the correlations between inputs and outcomes had changed over time or if the share of children’s outcomes the adjustments account for had changed over time.
To understand these factors’ potential influence on gaps, we examine both unadjusted and adjusted gaps in the tables in this section. We also examine gaps by some of the components of the SES index, such as household income or mother’s educational attainment, and by other variables that are sometimes used as proxies of the child’s socioeconomic background, such as number of books in the home. If the gaps by SES components and proxies somewhat differ, this tells us that researchers’ choices about how to divide children into groups and compare them matter—both for their findings and for their policy recommendations.
Table 3 shows the unadjusted and adjusted gaps between the standardized scores in reading and math of kindergarten children in the top SES quintile relative to the bottom SES quintile in 1998 and the change in that gap by 2010.13 Table 4 performs the same analysis for gaps in measured noncognitive skills. The tables show two somewhat perplexing patterns. On the one hand, the cognitive and noncognitive skills gaps between high-SES and low-SES children are large and statistically significant in both cohorts. But while significant social-class-based performance gaps persist from one kindergarten generation to the next, there is not the same consistency in how the high-SES to low-SES gaps change. For some cognitive and noncognitive skills, the performance gaps grow, while for others the gaps shrink, or remain the same from one generation to the next (which may complicate the process of understanding why performance gaps have changed over time).
Beginning with our unadjusted model (data column one), the only substantial increase in the gap between high- and low-SES children from 1998 to 2010 was in reading skills, which increased by one-tenth of a standard deviation. There were no significant changes in gaps in math skills, which, as the literature indicates, are less sensitive than reading skills to parents’ activities at home (see Rothstein 2004, 2010). Similarly, gaps in approaches to learning as reported by parents and in self-control as reported by teachers did not change significantly, and gaps in approaches to learning as reported by teachers and in self-control as reported by parents shrank by roughly the same amount as the reading gap (about a tenth of a standard deviation—0.12 and 0.08 sd, respectively). Figure A provides a graphic illustration of the unadjusted gaps in cognitive and noncognitive skills of high- and low-SES children across the two cohorts.
The additional models estimated for each outcome and shown in Tables 3 and 4 offer other key findings. In Model 1, we used the full samples for the two cohorts but did not include any controls that capture characteristics of children or their parents or the early education practices in which families engage. Model 2 partitions the data into schools and classes, or clusters, so that the subjects in the clusters are more similar to one another than to those in other groups. Under this adjustment, the gaps shrink substantially, by between 15 and 25 percent across the skills, and the regression fit improves significantly (see increased adjusted R-squared, i.e., this model explains more of the total variation in the outcomes than the first model). This clustering takes into account school segregation, that is, that children are not randomly distributed but tend to concentrate in schools or classrooms with children of the same race, social class, etc. Clustered estimates provide a comparison of the skills gaps of peer students—those in the same schools and classrooms—rather than a comparison across schools. García (2015) and Magnuson and Duncan (2016) offer these estimates too.
How do child and family characteristics, activities, and expectations affect SES-based performance and performance gaps?
We next examine the contribution of the certain variables of interest to SES-based performance gaps. We approach this in two ways. First, we examine the changes in the gaps (Tables 3 and 4, Models 3 and 4) and the overall reduction in the gaps that results from controlling for children and their family characteristics, early literacy practices, and parental expectations of educational achievement (Table 5). Second, we assess the influence of select early educational practices on performance and how that influence has changed over time by looking at the associations between these inputs and performance (Table 6).
Models 3 and 4 in Tables 3 and 4 use the samples that result from removing observations without full information for the controls of interest.14 Adding controls is important because performance gaps based on socioeconomic status may be explained by differences in variables other than the child’s socioeconomic status. In other words, we aim to determine which part of the gap is attributable to children’s SES, net of other factors that matter for performance. Thus, in the third data column (Model 3), we add controls for individual and family characteristics (gender, race/ethnicity, whether English is the primary language spoken at home, disability, age, whether children live with two parents) and early educational and play activities (center-based pre-K care, indices for literacy/reading activities and other activities, and total number of books the child has). Model 3 also includes the interactions between the early education variables with time.15 In the fourth data column (Model 4), we control for the same factors as in Model 3 but add controls for parental expectations of children’s educational attainment (whether they expect their children’s highest level of education attained will be high school diploma or less, some college or vocational studies, bachelor’s degree, or advanced degree) and their interaction with time.16 We describe these results in the next section.
Including covariates changes the estimates of SES-based skills gaps in various ways. First, the gaps between the top- and bottom-SES quintiles shrink, showing that SES-based gaps are partially explained by the variation in the controls (which is not visible in the tables).17 Second, controls do not significantly change the SES-based gaps over time, in general; i.e., the coefficients associated with changes in the gaps between high- and low-SES children remain almost the same, or change very minimally, depending on the skill measured. The statistical significance of the SES-based skills gaps in 1998 is not affected by the inclusion of the controls (see rows “Gap in 1998–1999” in tables), but the statistical significance of the changes in the gaps between 1998 and 2010 (see rows “Change in gap by 2010–2011” in tables) is somewhat affected by the inclusion of the controls (note that the sizes of the coefficients measuring gaps in 1998 change after the inclusion of the controls, but that the sizes of the coefficients measuring changes in them between 1998 and 2010 do not change significantly). In reading, the change in the gap between 1998 and 2010 diminishes and becomes statistically insignificant in the last model (the relative gap increases by 0.08 sd but this change is not statistically significant), meaning that adding parental expectations of education accounts for some of the increase in the gap detected in Models 1 to 3. The only SES-based skills gap that shows a statistically significant increase from 1998 to 2010 once parental expectations are controlled for is the gap associated with parents’ assessment of approaches to learning, which increases by 0.11 sd. Gaps between high- and low-SES children in cognitive and noncognitive skills after adjustments are made are shown in Figure B.
As mentioned above, the fact that the skills gaps decrease after controls are taken into consideration affirms that SES-based gaps are due in part to variation in the controls among high- versus low-SES children. This trend can be seen in Table 5, which, as noted above, shows the overall reduction in gaps that results from controlling for child and family characteristics, early literacy practices, and parental expectations of educational achievement. With respect to cognitive skills, the 1998 gaps shrink by 46 percent and 53 percent, respectively, after the inclusion of the covariates. About half of the gaps are thus due to other factors that are associated both with SES status and with the outcomes themselves. The reduction in the 1998 gaps for noncognitive skills varies from 28 percent (approaches to learning as reported by teachers) to 74 percent (approaches to learning as reported by parents). (For self-control as reported by teachers, the reduction is 51 percent versus 35 percent when reported by parents.)
While the gaps hold after the inclusion of controls across outcomes, gaps in 2010 are less sensitive to the inclusion of the covariates than they were in 1998. This trend can also be seen in Table 5.18 Declining values from 1998 to 2010 indicate that factors such as early literacy activities and other controls are not, as a group, explaining SES-based gaps as much as they had a decade prior. This change could be due to the failure of the index to fully capture parents’ efforts to nurture their children’s development and/or the index becoming somewhat out-of-date. In any event, the resistance of gaps to these controls should worry researchers and policymakers. The waning influence of these controls makes it harder to understand what drives SES gaps. It also suggests that the gaps may be growing more intractable or, at least are less easily narrowed via the enactment of known policy interventions.
Finally, we examine the association of performance outcomes (not performance gaps) with selected early educational practices, including having attended center-based pre-K, literacy/reading activities and other activities, and total number of children’s books in the home (Table 6).19 We are mainly interested in two potential patterns: whether these factors are associated with outcomes (and, if so, how intense the associations are), and whether the relationships have changed over time.
In keeping with established research, having attended center-based pre-K is positively associated with children’s early reading and math skills. For 1998, the estimated coefficients are 0.11 sd for reading skills and 0.10 sd for math skills, substantial associations that do not change significantly over time. In other words, attending pre-K in 1998 improved kindergartners’ reading skills by 0.11 sd and improved kindergartners’ math skills by 0.10 sd relative to not attending pre-K. However, while center-based pre-K continues to reduce self-control as reported by teachers in 2010, the effect is less negative in 2010 (the 0.06 improvement from 1998 to 2010 shown in the bottom panel of the table shows us that the effect in 2010 was -0.07 [-0.13 plus 0.06], compared with -0.13 sd in 1998). We find no independent effect of center-based prekindergarten schooling (i.e., no effect in addition to SES, in addition to other individual and family characteristics, or in addition to other SES-mediated factors), on approaches to learning or on self-control as reported by parents.20
The number of books children have at home likewise supports their skills at the beginning of kindergarten. Indeed, this factor is positively associated with all outcomes but self-control reported by parents. The coefficients are very small, of about 0.01 to 0.02 sd (associated with changes in outcomes for each 10 additional/fewer books the child has, as expressed by the continuous scale with which number of books in the home is measured, which is divided by 10 for the analyses (as mentioned in Appendix A), and these relationships do not change over the time period.
The two types of parenting activities that are summarized by the indices “reading/literacy activities” and “other activities” show interesting correlations with performance and patterns over time. On the one hand, the “reading/literacy activities” index (a composite of how frequently parents read books to their child, tell stories, sing songs, and talk about nature, and how frequently the child reads picture books and reads outside of school) is strongly and positively associated with all outcomes other than children’s self-control as reported by the teacher. The associations with cognitive skills, especially with reading, are strong and statistically significant—0.17 sd for reading performance and 0.07 sd for math—and these associations did not change significantly between 1998 and 2010. For noncognitive skills, the relationships are strong for those assessed by parents, though they shrink by about half over time: self-control is 0.14 sd in 1998 and decreases by 0.08 sd by 2010; approaches to learning is 0.32 sd in 1998 and decreases by 0.17 sd by 2010). The relationship is much weaker, though still statistically significant, for teachers’ assessed approaches to learning (it is 0.03 sd in 1998 and does not change significantly by 2010).
On the other hand, the index that measures other enrichment activities that parents do with their children (a composite of how frequently parents and children play games, do sports, build things, work on puzzles, do arts and crafts, and do chores) shows significant correlations with all of the skills, but they may be either positively correlated or negatively correlated, depending on the skill. For cognitive skills, the associations are statistically significant and negative, though stronger and somewhat more meaningful or more intense with reading achievement (-0.12 sd in 1998) than with math achievement (-0.04 sd).21 These associations did not intensify nor weaken over time. For noncognitive skills the associations are highly positive and statistically significant, and very strong for parents’ assessment of approaches to learning (0.29 sd in 1998). As explained by García (2015), these correlations between “other activities” and noncognitive skills as assessed by parents could be bidirectional: engaging children in enrichment activities might enhance their noncognitive skills, but, at the same time, parents who are more inclined to participate in their children’s early play and educational time are probably more likely to perceive or judge that their engagement has an impact on their children’s skills. But the fact that both the frequency with which parents engage in most of these activities and the importance of this index for parent-assessed skills increased noticeably from 1998 to 2010 (by 0.22 sd for self-control and 0.27 sd for approaches to learning) suggests that parents are growing more informed and involved in their children’s early education over time. It also indicates that parents are increasingly acting on this knowledge and that this involvement will continue to grow, albeit potentially with decreasing marginal returns to time and resources invested. The association between “other activities” and teachers’ assessments of children’s noncognitive skills is also positive but weaker than that of parents’ assessments (about 0.03 sd for approaches to learning and 0.05 sd for self-control), and remained unchanged during the time period studied.
Finally, we find a strong association between parental expectations for their children’s educational attainment and all measured skills. In other words, net of socioeconomic status, the higher the expectations, the higher cognitive skills children have, and the higher the assessments by parents and teachers of children’s noncognitive skills. The parental expectations portion of the table measures children’s performance relative to children whose parents’ expectations are the lowest (high school diploma or less). While the expectation that a child will pursue some vocational education or complete college has a statistically positive influence on all skills measures except for reading, the expectation that their children will complete a bachelor’s degree or more education has a stronger influence, including on reading skills: between 0.11 to 0.16 sd higher in reading and between 0.17 to 0.22 sd higher in math in 1998. High expectations for children’s educational attainment also have a statistically positive effect on noncognitive skills. When the expectation is for an advanced degree (master’s or higher), coefficients vary from 0.12 sd in self-control by teachers to 0.38 sd in approaches to learning by parents in 1998. In addition, most of these associations—particularly the cognitive gradients—grow in 2010. Relative to children whose parents have low expectations, children whose parents have the highest expectations for their children’s attainment (graduate studies) perform much better in reading and math than in 1998 (relative gaps grow by 0.19 and 0.12 sd respectively). A similarly stronger association is noted for noncognitive skills assessed by teachers (though not for parents’ assessments of their children’s skills).
Sensitivity analyses: Do performance gaps vary based on which proxy for social class (socioeconomic status) is used?
Part of the challenge to making conclusive statements about trends in education gaps by social class is the existence of multiple valid proxies for measuring children’s social class or socioeconomic status.22 Although researchers treat these proxies as equivalent, and even interchangeable, the lack of a comparison of results obtained using various indicators limits our capacity to extract major conclusions on social-class trends and their drivers, and hence hinders the plausibility and effectiveness of the policy recommendations that build on any specific indicator’s findings (net of other methodological and instrumental differences that may exist across studies).
We thus conduct analyses using several of the main proxies employed to measure socioeconomic status. The purpose of these analyses is twofold. The first purpose is to test the sensitivity of the estimated relative gaps, and of trends in them, to changes in the measurement of this key predictor of education performance. (In other words, if all the indicators are reliable proxies of SES, gaps and trends obtained using the various metrics should be similar.) The second purpose is to increase the comparability of the results of studies addressing trends in education inequalities that use various metrics of social class. This is an important issue; in addition to helping reconcile diverse results found in the literature, these analyses may reveal why patterns differ, and have significant policy implications.
As such, instead of the SES composite measure we use to estimate SES-based gaps in this report, we use three alternative indicators to run our analyses: mother’s educational attainment, household income, and number of books the child has in the home. Unlike the SES composite measure, two of these measures offer the advantage of being directly comparable over time. Both mother’s educational attainment and number of books the child has are objective categories. As a limitation, and mainly associated with the information that is available in the raw data, none of these categories can be transformed into a percentile-variable without major transformations. (The adjustments to ensure comparability over time are explained in Appendix A. See Reardon and Portilla 2016 for an analysis with a transformation of the income variable that offers a proper percentile comparison, based on the methodology developed by Reardon 2011.) Still, they are variables associated with social class and can be ordered in groups or categories that identify high- and low-social-class statuses. Thus, with the necessary caution when interpreting and using the findings, we offer this comparison of results as a sensitivity analysis.
We create five categories with these indicators, maintaining the structure of comparing “high-SES” (top quintile) with “low-SES” (bottom quintile) as in Tables 1–5 (note that we are using “SES” interchangeably with “social class” here). For simplicity, Tables 7–9 show only the results from two models: one without covariates (Model 1, baseline estimates) and one with all covariates (Model 4, fully adjusted estimates). We focus on the findings for the baseline relative gaps in 1998 and 2010 first (Figures C–E). The overall patterns found in the results suggest that all social-class gaps are statistically significant and sizable. However, the exact sizes of the gaps vary depending on the social-class indicator used and the outcome being assessed. Also, the changes in the gaps over time vary depending on the indicator used to capture children’s social class.
In addition to these general findings, we note some more detailed ones. For 1998, gaps by mother’s educational attainment (Figure C; Table 7) are the largest across all indicators (except for the gap in self-control as assessed by teachers, which is slightly smaller than the gaps as measured using household income and number of books the child has), while gaps by number of books (Figure E; Table 9) are the smallest across all indicators (except for the gap in approaches to learning as assessed by parents, which is slightly larger than the gap for household income). Again, according to the 1998 data, the coefficients of gaps by mother’s educational attainment are generally larger—and in three cases much larger—than those obtained using number of books in the home as the indicator of social class. For example, the relative gap is 1.29 sd in reading and 1.46 sd in math when mother’s education is the SES proxy, compared with gaps of 0.74 sd and 0.97 sd when number of books in the home is the SES proxy.
It is also important to note that gaps by mother’s educational attainment (Figure C; Table 7) and income (Figure D; Table 8)—two of the five components of the SES construct—are very close to the ones obtained by our SES composite measure (as shown in Figure A). All in all, results seem internally consistent as well as generally consistent with prior results on this topic (Reardon and Portilla 2016).
In terms of changes in the performance gaps over time (unadjusted), the findings vary depending on which indicators of social class are used, with mother’s education and household income being the indicators associated with the largest changes in the gaps. Changes in the performance gaps in cognitive skills between 1998 and 2010 by our composite SES measure and books are similar: an increase in the reading gap between children in the top and bottom quintiles of about a tenth of a standard deviation (0.10 sd with the composite SES measure [Figure A] and 0.08 sd if SES is proxied with books), and no significant change in mathematics (there are some differences in the noncognitive outcomes).
However, by mother’s educational attainment, there are no changes in relative reading and approaches to learning gaps reported by parents over time, and a significant reduction in the gaps in the remaining outcomes. Meanwhile, income-based gaps for the two cognitive skills—reading and math—decreased by -0.13 and -0.23 sd respectively, and for approaches to learning as reported by teachers by -0.13 sd. No significant changes occurred for the remaining noncognitive skills.
In sum, this sensitivity analysis demonstrates that all of the indicators are reliable proxies of SES for the estimation of early achievement gaps, though absolute gaps may vary slightly depending on the indicator used. However, the proxies are not equally reliable when we assess trends in the gaps by SES or their drivers. As such, aside from differences in the definitions and procedures used to construct each SES proxy, the proxies should not be treated as fully equivalent. The decomposition conducted here helps clarify the different weights that various components of SES may have in driving changes in gaps by social class. For example, variation in income across groups over time is associated with decreased performance gaps in the cognitive skills between 1998 and 2010, and variation in educational attainment quintiles or categories over time is associated with decreased performance gaps across cohorts in most noncognitive skills. But variation in books in the home over time and among groups is associated with increased gaps in reading and in parents’ assessed approaches to learning. Such findings also point to very different policy solutions: if mothers’ education is the main driver, enhancing that will improve children’s prospects. On the other hand, findings that indicate that income inequality is the larger culprit would point to the need for policies that reduce such inequalities. Future research should consider and look more closely into these questions.
What can we learn from these analyses?
The multiple factors and relationships examined in this section can now be examined from a policy perspective. If the aim is to increase equity, to improve children’s development across the board, and to improve our understanding of children’s development, there are two major policy recommendations:
- Directly support less-resourced families so that they have greater access to educational and economic resources (for the latter, see García and Weiss 2017). All the early educational and play activities measured, which include center-based pre-K care and literacy/reading and other activities, as well as the number of books a child has, are positively associated with children’s readiness, and in part account for social-class gaps, but are much less accessible to children of lower socioeconomic status. Virtually all of the associations between these factors and outcomes were strong and positive (with a handful of exceptions), and some even grew over time. A related research recommendation of particular interest would be to examine whether the intensity of these activities or practices has any threshold level of effectiveness (after which point they no longer affect children’s development).23 Also, it would be helpful to understand why parents’ expectations of their children’s educational attainment increased so much and how this has affected children’s development. For example, do parents have a better understanding of the relationship between educational attainment and prospects for success in life and the workforce? Are children performing better because their parents expect more, or because parents who expect more are also delivering more in the form of enriching activities?
- Design and implement strategies that compensate at the community level for children’s lack of access to key foundational resources (economic and educational). These strategies can be considered indirect supports for less-resourced families that reduce inequities and complement the direct supports described above. Examples of communities that have enacted such comprehensive support initiatives provide a good starting point to explore how and why they emerge; the types of supports they provide (from preschool programs and home visits with parents to enriching summer programs, school-based health clinics, and more); the challenges of scaling them up and sustaining them; the benefits they deliver for students, and particularly for disadvantaged students; and their implications for policy at the local, state, and even federal levels. The next section of this report thus presents an analysis based on qualitative data from promising initiatives in a dozen school districts across the country (Weiss 2016a–h).
What are pioneering school districts doing to combat these inequities and resulting gaps?
This section of the report draws on a set of case studies published by the Broader, Bolder Approach to Education (BBA), a national campaign that advances evidence-based strategies to mitigate the impacts of poverty-related disadvantages on teaching and learning.24 The case studies feature school districts that have employed comprehensive educational strategies to ensure that more children, especially low-income children, have strong early academic and life foundations, and that resulting early gains are sustained and built on through children’s K–12 years. (These strategies are often referred to as “whole-child” approaches to education, in reflection of their holistic nature.) We explore the premise that school districts that take a whole-child approach to education and a whole-community approach to delivering it are likely to enjoy larger gains in academic achievement and to narrow their race- and income-based achievement gaps. In doing so, we are building on evidence suggesting that consistent, strong supports for children and their families—both in and out of school—can avoid the “fade-out” seen among graduates of many pre-K programs and even enhance those programs’ early benefits.
This section is thus divided into four parts: (1) an introduction to the case study districts, followed by discussions of (2) how these districts invest in early childhood care and education, (3) how the districts’ investments in K–12 strategies sustain and boost the early childhood investments, and (4) how academic gains and narrowing achievement gaps indicate that the investments are paying off. Table 10 provides basic information on the 12 school districts/communities studied; Appendix E at the end of this report provides more information on key characteristics of these districts.25
Introduction to the case studies: Why these districts enacted whole-child strategies
Large and growing disparities in the economic well-being of children in America and extensive evidence linking those disparities to widely diverging educational outcomes have prompted action among a growing number of communities and school districts. Heeding the evidence that out-of-school factors play even larger roles than school-based factors in school performance, these districts are seeking ways to mitigate the poverty-related impediments to effective teaching and learning.
These districts have benefited from a substantial body of research on strategies with promise to address core challenges that students and schools face—strategies that have been shown to shrink achievement gaps by narrowing major disparities in opportunity (Carter and Welner 2013). The first, and perhaps best-documented, of these strategies is high-quality early child care and education, especially when it engages parents early and in meaningful ways. High-quality early childhood education programs not only narrow achievement gaps at kindergarten entry but also deliver long-term benefits to children, their families, and society as a whole (Chaudry et al. 2017; Rolnick and Grunewald 2003).
Programs that support students’ physical and mental health and improve their nutrition are also known to reduce chronic absence and keep students focused and learning, and thus improve their academic performance (CDC 2016). Well-designed after-school and summer-enrichment programs likewise boost achievement, both directly and indirectly by enhancing students’ engagement in and attachment to school (Peterson 2013).
Whole-child approaches integrate these and other strategies into a comprehensive set of aligned interventions, leveraging the whole community’s resources to meet the broad range of student needs. While the impact of such comprehensive approaches has not been studied as extensively as the individual components, considerable theoretical and emerging empirical research point to the strong potential of such strategies to boost achievement and narrow gaps (Child Trends 2014; Oakes, Maier, and Daniel 2017; Weiss 2016i).
This section of the report seeks to add to that knowledge base by sharing qualitative information on how such comprehensive approaches have emerged and grown, what they look like when they are successfully implemented, and what types of outcomes and benefits result and how outcomes vary across diverse communities.
How are whole-child initiatives launched?
Each of the districts studied has distinct circumstances, and thus distinct reasons for coming to the conclusion, as a community, that it needed to take a comprehensive approach to education. At the same time, demographic trends that are affecting virtually every state—and many, if not most, school districts across the country—have played major roles in that decision in every case.26 Indeed, community and school leaders in all of these districts cited students’ poverty (and, in some districts, demographic shifts) as posing challenges that required looking beyond the school walls to address.
How these factors triggered the initiative’s launch varied, but poverty was at the core in each community’s decision. For example, in 2008, community leaders identified East Durham as one of Durham, North Carolina’s, most distressed areas, based on a community risk assessment conducted by Duke University’s Children’s Environmental Health Initiative. The 120-block area’s 11,000 residents had a 40 percent poverty rate and a homeownership rate of just 19 percent, along with high rates of crime and unemployment, putting its 3,000 children and youth at high risk of academic failure (Weiss 2016e).
Across the country, in Vancouver, Washington, the share of children eligible for subsidized school meals rose from 39 percent to over 50 percent in less than a decade, such that, by 2015, in some central-city schools, more than four in five students qualified for subsidized school meals in 2015 (Weiss 2016b). In another distressed community, in north Minneapolis, median family income was just $18,000 in 2011, and fully one-fourth of the 5,500 Northside students were homeless or “highly mobile” (in such unstable housing that they were at risk of homelessness) (Weiss 2016d). In Pea Ridge, Arkansas, schools “had difficulty finding resources that met the needs of kids,” says superintendent Rick Neal. “We knew that we were not identifying all the needs that were there. I think that’s the way a lot of districts are” (Weiss 2016f). And in the early 1990s, the Tangelo Park neighborhood in Orlando, Florida—an isolated enclave of 3,000 residents, almost all low-income and African American—caught the attention of hotelier and philanthropist Harris Rosen, who was looking for a neighborhood in which to invest (Alvarez 2015).
Each of these districts took different approaches to enacting those comprehensive strategies, based on the community’s specific mix of needs and assets, ideological leaning, available sources of funding, and other factors. One of the most politically progressive of the districts studied, Montgomery County Public Schools (MCPS) in Maryland, paved the way for a whole-child approach in the early 1970s when it enacted housing policy that uses mixed-income residential developments to create communities with families of different income levels. In the 1990s, the county developed Linkages to Learning, a “community schools”–type approach targeted to engaging and partnering with low-income and immigrant parents and families and connecting them with a broad range of community resources (MCPS 2016). (Community schools are known for building partnerships with community agencies and private service providers to meet student and family needs.) Austin Independent School District (AISD), also in a politically progressive jurisdiction, began its whole-child efforts through parent- and community-organizing in schools. It has since invested in social and emotional learning and in a community schools strategy (CASEL 2017).
At the other end of the spectrum are whole-child approaches in Joplin, Missouri, and Pea Ridge, Arkansas, districts located in more politically conservative southern states. These districts operate under the umbrella of Bright Futures USA (a spinoff national nonprofit that began with Joplin’s Bright Futures initiative). The Bright Futures districts take a more individualistic angle, asserting that every member of the community has “time, talent, or treasure” to offer that can help children overcome disadvantage and ensure more equal opportunity (Weiss 2016a).
Two other districts have modeled their efforts on the Harlem Children’s Zone (HCZ). The Northside Achievement Zone in Minneapolis is funded through a grant from the federal Promise Neighborhoods initiative, enacted by the Obama Administration to help more communities dramatically improve the academic success for low-income children by adopting HCZ-like strategies. The East Durham Children’s Initiative in North Carolina is entirely privately funded so far (Weiss 2016e).
In both Kalamazoo, Michigan, and Orlando, Florida, pledges of “Promise” college scholarships have evolved into broader whole-child efforts (Alvarez 2015; Miller-Adams 2015).
Districts also take different approaches based on density. New York City—home to dozens of full-service community schools supported by the Children’s Aid Society and rapidly expanding to more—and Boston—home to the City Connects initiative—leverage a broad range of their respective cities’ arts and cultural offerings, along with health and nutrition and other social services (Weiss 2016g, 2016h). Cultural offerings to supplement other well-rounded services are also part of the full-service community schools district initiative in Vancouver, Washington. In contrast, Partners for Education, which serves the isolated region surrounding Berea College in Kentucky, was the first rural organization to receive a Promise Neighborhood grant and, thus, is a pioneer in exploring how well the model works outside the urban context (Berea College 2013).
What do whole-child initiatives do?
The sections below describe commonalities across these different approaches in terms of investments in children’s earliest years (before school starts), building on these investments throughout children’s K–12 years (both in and out of school), and the gains students and schools enjoy as a result of those investments.27
How the case study districts invest in early childhood care and education
In keeping with their whole-child approaches to education policy and practice, every one of the 12 districts highlighted as a BBA case study has made investments in early childhood care and education, many of them substantial. These districts’ efforts begin long before children enter school and go beyond pre-K offerings to equip parents in the effort to ensure their children’s readiness for school.
One-on-one engagement with new parents
Investing in babies by engaging parents can include providing new parents with key information about child development and how to keep children healthy and safe. In Joplin, Missouri, Bright Futures Joplin partners with two of the area’s hospitals to deliver new baby “kits” with child development and early literacy information and is trying to raise funds to sustain the project long term and to expand it to reach every new parent (Weiss 2016a). In Vancouver, Washington, 6,000 “literacy packets” are delivered annually to families with children up to age five, providing child-development activities and lessons that families can complete at home (Weiss 2016b).
The districts leverage partnerships to connect parents with a range of school and community resources that support children from birth through kindergarten entry. In Eastern Kentucky, the whole-child program called Partners for Education works with Community Early Childhood Councils to host events such as Week of the Young Child, the Dolly Parton Imagination Library, and Kindergarten Transition Programs (Weiss 2016c). In Montgomery County, Maryland, “Judy Centers”—early child care and family education centers—leverage partnerships with social service agencies and local community nonprofits to increase parents’ access to mental health, nutrition, and other key services (Maryland State Department of Education 2017).
Educating and engaging parents early helps prepare children for school both academically and more broadly for healthy development. Those are the twin goals of the Minneapolis Northside Achievement Zone (NAZ), where currently only one in four preschoolers in the zone is ready for kindergarten based on standardized tests. To improve those odds, the zone has a team of “NAZ Navigators” who work with families to set and track progress toward goals in early childhood and to link this area of family support to goals in academics, housing, career and finance, and behavioral health (Weiss 2016d).
Parenting classes
Parents are children’s first and most important teachers. Like the one-on-one strategies described above, classes for parents provide information on child development, early literacy, health, and constructive disciplinary practices, and offer more specific guidance tailored to specific parents’ needs. Almost every district studied provides new-parent classes. The 1-2-3 Grow and Learn program is a weekly 90-minute literacy-rich program for young children and their parents offered at 12 elementary schools in high-poverty Vancouver neighborhoods. It lays the foundations for school readiness through social and education experiences. In addition, the district’s Family and Community Resource Centers offer parent workshops, groups, and courses to help parents support their children’s learning, while empowerment and skill-enhancement programs—such as job preparation, housing assistance, and parent leadership advisory groups—strengthen parents’ basic skills. Family Academy classes in the North Minneapolis Northside Achievement Zone include “College Bound Babies” (for parents of children up to three years old), which teaches early literacy, numeracy, and positive discipline skills, and “Foundations,” which empowers parents to feel confident talking with their children’s teachers and advocating for their children and their children’s schools.
In many cases, districts employ a combination of one-on-one and group supports, along the lines of Early Head Start.28 The East Durham Children’s Initiative, a private program modeled loosely after the Harlem Children’s Zone, includes Durham Connects, a home visiting program that supports zone families with children up to age 3 and is followed by weekly or biweekly in-home parent education and support provided by two nonprofit social service providers, Healthy Families Durham and Jumpstart (Weiss 2016e). In Montgomery County, Maryland, family social workers collaborate with classroom teachers to help them develop Family Partnership Agreements, which are based on the strengths, needs, and personal goals of each family. A social worker–led team follows up by phone and with visits. In two of the district’s highest-poverty schools, these supports are complemented by early child care and family education centers (Judy Centers), which provide comprehensive early childhood education and support to children from birth to age five and their families (Marietta 2010).
Big investments in prekindergarten programs
Almost every state in the country now invests at least minimally in pre-K programs for disadvantaged children, and a growing share of states make these programs widely available.29 Most of the districts we studied, however, have gone far beyond state programs through one or more strategies and funding mechanisms.
A few of these districts benefit from high-quality state pre-K programs that serve a large share of children, freeing the districts to invest in other aspects of early childhood enrichment. The Partners for Education initiative based in Berea, Kentucky, leverages the state pre-K program, which serves all three- and four-year olds who are either low-income or have other risk factors. This enables Partners for Education to use Promise Neighborhood grant funds to place early childhood specialists in pre-K classrooms throughout the four-county region (the region is a Promise Neighborhood region, which means that federal funds are available for a variety of education- and health-related investments). The specialists also provide coaching, professional development, and support for Head Start classrooms, as well as in-home tutoring over the summer.
In East Durham, North Carolina, strong state early education programs are supplemented by partner-led low-cost half-day preschool and a summer kindergarten readiness program, and home visits by parent advocates provide a range of supports, such as connections to state pre-K. In Kalamazoo, Michigan, the Pre-Kindergarten Early Education Program (PEEP) offers half- or full-day pre-K classes in elementary schools for four-year-olds at or below 250 percent of the federal poverty level, per state law, but it adds transportation and meals for those children. PEEP also works with other programs such as Head Start to provide families who are ineligible for PEEP with other options for low- or no-cost quality early education (KPS 2017).
Other districts with less comprehensive state support use federal resources to expand local options. For example, Vancouver draws on both state and federally funded early learning programs to provide pre-K in seven schools, along with district-supported programs for children in Title I schools. As of fall 2015, Vancouver’s new early learning center serves up to 100 additional children or more, with hot meals and playground space from an adjacent elementary school. Montgomery County also enhances state and federal programs with district-level investments: it provides the same literacy-rich curriculum in its Head Start classrooms as in district pre-K classrooms. And Montgomery County uses a blend of federal Title I and Head Start dollars to offer full-day Head Start in 18 of the poorest schools, serving 460 children (Marietta 2010). The Northside Achievement Zone in north Minneapolis uses federal Race to the Top Early Learning Fund money for scholarships for three- and four-year-olds to attend high-quality pre-K, serving 127 children in 2012–2013 and 156 in 2013–2014.
Local programs can also fill in where state programs are weak. Austin, Texas, uses local funds to provide enriching, hands-on full-day programs for the four-year-olds who would otherwise participate in lower-quality half-day state programs. Austin also provides a half-day program for three-year-olds who aren’t served by the state. Families who qualify for both state pre-K and Head Start also receive nutrition, health, and other services (AISD 2017).
Pea Ridge is another community using local resources to supplant state resources. A lack of available seats for children who are eligible for the state’s high-quality Arkansas Better Chance (ABC) pre-K program prompted Pea Ridge to seek a grant to open its own program, which serves 40 children: 20 at-risk children, who receive tuition scholarships, and 20 others whose parents can pay tuition (Weiss 2016f). Missouri’s pre-K program also has too few slots, so Bright Futures Joplin is building a new early childhood learning center that will be funded jointly by the district and the state.
Strengthening the transition to kindergarten
Featured districts also build on pre-K gains and help narrow school-readiness gaps with such programs as full-day kindergarten. Montgomery County Public Schools first started full-day kindergarten in “red zone schools,” those deemed to be most affected by high rates of student poverty, in 2000. Full-day kindergarten has since expanded to every school in the district (Marietta 2010). And Vancouver offers Kindergarten Jump Start, a school readiness program, at all 21 elementary schools, and full-day kindergarten; both programs seek to enhance the transition from pre-K into formal schooling.
Other investments in young children and their families
In addition to the above range of supports for infants, toddlers, and preschoolers and their parents, several of the districts studied by BBA have made additional investments in young children and their families. The Community Storywalk in Clay County, Kentucky, and the Born Learning Trail in Joplin, Missouri, provide opportunities for parents and paid caregivers to learn with their children in a hands-on way through outdoor and physical activities. In Eastern Kentucky, Partners for Education’s Promise Neighborhood grant supports work by national nonprofit Save the Children to improve the health and education outcomes of the region’s children through a literacy program that provides kids ages 5–12 with books and tools to develop strong reading skills. The Promise Neighborhood grant also allows Partners for Education to offer the Children’s Healthy Choices program, which provides healthy snacks and 30 minutes of daily physical activity for children in districts across Eastern Kentucky.
Joplin’s Little Blue Bookshelf program gives age-appropriate books to those children whose families cannot afford them, making the goal of 1,000 hours of reading by kindergarten a viable reality for every child. And the city’s Lend & Learn Libraries provide stimulating toys and socialization time for young children and their parents.
How the school districts invest in K–12 strategies to sustain and boost their early childhood investments
The whole-child approaches these communities embrace for children from birth to five years old continue as those children transition to kindergarten and through elementary, middle, and high school. This represents a sharp difference from most other districts, which focus heavily on narrow academic factors and assessments and thus neglect characteristics emphasized in pre-K, such as building strong teacher–student relationships and attending to the full range of children’s assets and needs. As these examples illustrate, students continue to benefit from a more comprehensive approach to education and there is an array of strategies school districts can use to deliver that comprehensive approach.
Enriching K–12 curricula and activities to sustain pre-K’s whole-child emphasis
A broad set of investments and activities can help sustain pre-K’s whole-child approach, including enhancing classroom experiences, aligning classroom lessons with out-of-school activities that expand children’s worldviews, and using targeted strategies to improve students’ readiness for college, careers, and civic engagement.
Schools that ensure hands-on learning both in and out of the classroom make the most of this opportunity. Joplin and Pea Ridge students and their teachers enjoy service learning projects that are a core component of the Bright Futures strategy. These range from kindergartners organizing coat drives and canned food drives for their neighbors to high school students designing and implementing water research projects and reporting on the health and safety of Joplin’s water supply to the city’s water management agency. In East Durham, partnerships with community agencies and nonprofits enable clubs, field trips to museums, and other enrichment activities.
After-school and summer programs help students build on what they learned during the school year, broaden students’ worldviews and skills, and reduce summer learning loss. In most of the districts studied, schools partner with organizations such as the YMCA, Boys and Girls Clubs, Boy Scouts, and Girl Scouts to provide out-of-school enrichment programs that range from organized sports and help with homework to math and book clubs, theater, and robotics. In addition to boosting student engagement, some focus in particular on academic and college preparatory help, and many also provide snacks or even full meals. Summer camps in Boston and East Durham and book deliveries and clubs in Pea Ridge and Eastern Kentucky—where online options help bridge long distances in rural areas—keep students reading, engaged, and on track for fall classes.
In several districts, the focus on nurturing not only students’ academic skills but also their social and emotional skills strengthens the transition to kindergarten and development throughout the K–12 years. Vancouver’s schools teach and model social and emotional learning in classrooms as part of the district’s work to improve school climate and track student data on engagement and mental health. Under City Connects—the whole-child collaboration among Boston College, Boston Public Schools, and community agencies—school coordinators meet at the start of the year with teachers to discuss the particular strengths and needs of each student and develop plans to support teachers with academic and enrichment activities and meet student needs with small-group sessions on healthy eating and dealing with bullies, referrals to mental health providers, and a range of other supports (Weiss 2016g).
Two districts have made social and emotional learning a particularly high priority. Austin is one of eight districts working with the Collaborative for Academic, Social, and Emotional Learning (CASEL) to comprehensively embed social and emotional learning in teacher training, teacher standards, curricula, and metrics for assessing student and school progress (CASEL 2017). In Montgomery County, former superintendent Joshua Starr drew on the Common Core’s emphasis on problem-solving and critical thinking to lead the design of a new curriculum and classroom practices that nurture social and emotional skills. These are complemented by enhanced support for teachers to nurture social and emotional learning in daily classroom practice, by standards-based report cards that track key social and emotional skills, and by constructive disciplinary policies that reengage students and build their soft skills instead of punishing them for infractions.30
Several of the districts focus in particular on helping students—many of whom will be the first in their families to go to college—prepare for and make that leap. Strategies include middle-to-high-school transition programs in Joplin and Vancouver and clubs and specialized courses that advance students’ social and organizational skills in Vancouver and Montgomery County. In East Durham, three initiatives (Communities in Schools Durham, Student U, and Citizens in Schools) support youth who are preparing for graduation. They offer site-based mentoring from current undergraduates. Middle and high school students in the North Minneapolis Northside Achievement Zone receive similar assistance. And Vancouver’s GRADS Teen Parent program helps teen parents stay in school, graduate, and be more effective parents. De-tracking, an intentional decision to not separate students who are achieving at different levels into different classrooms or types of courses, which is the norm in Austin and in some Montgomery County high schools, helps ensure that college preparatory classes serve students of all income levels rather than just wealthier, nonminority students.31
College readiness is also a high priority for many Bright Futures districts. In Joplin, programs such as Operation College Bound enhance students’ understanding of and access to postsecondary education, complementing initiatives that help students navigate transitions to higher education and other sensitive periods of their academic lives. And in Pea Ridge, specialized high schools such as the Manufacturing and Business Academy and Pea Ridge Academy provide targeted support for students who want to go straight to jobs and careers or need special academic supports.
Mentoring and tutoring to get and keep students engaged
In the case study districts, the whole-child approach includes understanding the critical importance of one-on-one relationships with caring adults who support children’s academic and broader needs. Strategies can be as simple as the car and bus “buddies” who greet children in Pea Ridge each morning as they arrive at school, or as intensive as the volunteer “lunch buddies” who meet regularly with Joplin and Pea Ridge students to eat with them, talk about their days, and offer guidance. Northside Achievement Zone in North Minneapolis partners with Big Brothers Big Sisters to connect students with mentors, and over 500 volunteer mentors in Vancouver, Washington, support students in Family and Community Resource Centers.
These relationships are key to efforts in large urban districts and remote rural ones. The Children’s Aid Society has partnered with the New York City Department of Education to integrate a strong school curriculum with out-of-school enrichment programming, as well as provide child and family support services designed to remove barriers to students’ learning (Weiss 2016h). Children’s Aid community schools offer both tutoring and mentoring among their after-school options, as do Boston’s City Connects schools. In Eastern Kentucky, to bridge the long distances between one school and community and another, mentors use Skype to connect with eighth- and ninth-graders in Promise Neighborhood area schools.
Supports for student health and family wellness as a tool for sustaining early gains
Several of the districts studied have established health clinics in some or all of their schools, including Montgomery County, Vancouver, and New York City. In some other districts, such as Austin, school coordinators can arrange for mobile clinics to come to schools. These clinics provide basic preventive care through immunizations and check-ups, along with prescriptions and other care for sick children, physical and mental health screenings, follow-up counseling, mental health care, and even crisis intervention when needed.
Nutrition is another critical factor that affects physical and mental health and thus learning. In East Durham, Back Pack Buddies and summer lunch programs prevent hunger and keep kids nourished. Food and clothing pantries plus social media outreach in Pea Ridge and Joplin enable counselors and teachers to meet targeted immediate needs so students can focus and learn. Montgomery County has expanded its breakfast-in-the-classroom program to serve all students in a growing share of schools (MCPS 2017).
Many of these districts look beyond meeting students’ basic health and nutrition needs to advancing their and their families’ wellness and strengthening their ties to the community. Vancouver’s GoReady! back-to-school festivals provide backpacks, school supplies, shoes and socks, immunizations and dental screenings, and even haircuts, plus resources from community partners. In Eastern Kentucky, physical and mental health supports provided through state-supported Family Resource and Youth Service Centers are complemented by school–community collaborative activities through a run/walk club, a summer fitness program, a Jump Start program, and gardening and food preservation activities. And the East Durham Children’s Initiative runs a Healthy Living Initiative that refers families to nutrition counseling programs, Zumba classes, cooking demonstrations, and walking groups; it also distributes children’s bicycles and partners with local farmers markets to provide families with fresh produce.
Though research has long affirmed the importance of parental engagement, many schools struggle to meaningfully engage parents. The case study districts show how it can be done. In the rural regions around Berea, Kentucky, where physical distance makes engagement difficult, Partners for Education’s Families and Schools Together project convenes parents, school staff, and local agency professionals to help parents build social networks. In the North Minneapolis Northside Achievement Zone (NAZ), a high-poverty heavily minority area, regular one-on-one meetings between parents and “connectors”—specialized social workers who grew up in the area, are familiar with its challenges, and are a core component of the NAZ strategy—provide opportunities to conduct family needs assessments and provide referrals to relevant services. These regular meetings lead to deeper parental engagement in their children’s schools.
And full-service community schools such as those in Vancouver and New York City specialize in parent outreach and engagement. Community schools in these districts draw on parental input to shape school policies and practices and provide parents with an opportunity to meet one another. For example, a “parents’ coffee room” in a New York City school with a large Dominican population evolved from simply providing a space for parents to hang out after student drop-off to a center for parent-led workshops, parent–student collaborative plays, and more.
Other targeted supports provide added help for the most vulnerable students and their families. In Vancouver, for example, student advocates conduct home visits to parents of kindergartners and first-graders who are at risk of chronic absenteeism. In these visits, the advocates emphasize the importance of attendance and brainstorm with parents ways to reduce specific barriers to attendance. Complementary in-school efforts reward strong attendance. High-risk Montgomery County Public Schools students benefit from an unusual, but very effective, system of targeted support. Specifically, the districts’ funding system redistributes money from wealthier schools to higher-poverty schools, enabling the latter to provide smaller classrooms, more individualized attention, and more specialists in English language learning, special education, and other areas (Elmore, Thomas, and Clayton 2006).
How academic gains, including smaller achievement gaps, indicate that the investments are paying off
Providing children from birth through 12th grade and their families with targeted supports both within and outside of school has enabled these communities to make progress toward a range of goals. First, compared with students in peer districts, these districts’ students tend to have better outcomes on traditional measures of academic achievement such as test scores and graduation rates. Second and just as, if not more, important, these districts have improved students’ kindergarten readiness, engagement, and health and well-being, and helped the students be better prepared for college, careers, and civic engagement. This is true in large part due to these districts’ intentional bucking of a growing trend of diverging practices in which students in high-poverty schools are subject to narrow academic drilling while students in wealthy schools benefit from a broader set of activities and learning experiences beyond a narrow focus on preparing for standardized tests. These districts ensure enrichment for all students, regardless of socioeconomic status. Finally, in contrast with the national trend in recent decades of rapidly growing achievement gaps between wealthy and poor students, these districts are also narrowing race- and income-based achievement gaps: while all students are gaining ground, those who started off behind tend to see the largest gains.
Most of the data presented in this section do not come from experimental studies; with a few exceptions (which are noted in the case studies), they rely on nonexperimental comparisons with a similar nontreatment group, such as other low-income children in the district or other high-poverty districts in the state. However, they are gathered from official district, state, or federal resources in all cases, except for the minority of cases in which such data are not publicly available. Perhaps most importantly, in contrast with many other programs that have reported substantially improved outcomes for very vulnerable groups of students, these programs do not cherry-pick students to get these results. Rather, these initiatives serve all students in the enrollment area for a school, a cluster of schools, or, in many cases, an entire district; as described above, they are serving some of the nation’s most vulnerable students and their families.32 Moreover, many of these efforts are, for lack of a better term, “turnarounds.” That is, students in an existing system that is considered to be failing are offered a new approach in the same school building, making the large gains reported particularly striking given the notable lack of similar progress from much-larger-scale, more publicized attempts at employing other turnaround strategies.33
Establishing more expansive goals and implementing ways to track progress toward those goals also offers timely guidance, given that the Every Student Succeeds Act (ESSA) asks states, districts, and schools to do just that. These districts have not only set broader goals, they are demonstrating real progress toward achieving these goals. Because of their success, many now serve as role models for other districts or entire regions, and a few are beginning to influence state policy as well.
Higher rates of kindergarten readiness predict school success
Some of the kindergarten readiness efforts described above have translated into improved readiness to learn and, thus, greater odds of success in kindergarten and throughout the K–12 years. In Eastern Kentucky, East Durham, and Minneapolis, children who participated in early learning programs significantly increased their rates of kindergarten readiness across a range of metrics and developmental domains. A study of Montgomery County Public Schools found much larger gains in reading for children in the full-day Head Start program than for children in the half-day program, with full-day students more than doubling their reading scores over the year and especially pronounced gains for the most vulnerable students: Hispanics and English language learners (Marietta 2010).
Rising test scores and narrowing gaps in core academic subjects are an important sign of sustained early gains
While only one of many indicators, rising test scores and narrowing gaps in core academic subjects are an important sign that schools in case study districts have sustained and enhanced early gains. Despite serving a higher percentage of low-income, black, Hispanic, and English language learner students than the district average, Austin’s Alliance Schools—schools in which community organizers have worked to empower parents in conjunction with teacher advocacy efforts—saw substantial gains in scores on the Texas Assessment of Academic Skills, the state’s main standardized test, in the three years after parent-organizing efforts began. Increases varied from four points to 15–19 points, with the latter increases occurring in schools with the highest levels of parental engagement (Henderson 2010). Subsequent rollout of social and emotional learning in district schools (some of which were also Alliance schools) produced gains in the share of students deemed proficient on the State of Texas Assessment of Academic Readiness (STAAR, the next-generation state assessments) in the years following that rollout, with students in the first set of schools with social and emotional learning programs scoring higher on state math and reading exams than those in later school cohorts. The small group of Minneapolis Northside Achievement Zone students who were tested increased their proficiency on the Minnesota Comprehensive Assessments (MCA) exam, with the share scoring as proficient rising from 14 percent in the 2012–2013 academic year to 22 percent in 2013–2014.34 Students who had enrolled in the Northside Achievement Zone in 2013 had larger gains than those who enrolled in 2014, and, overall the largest proficiency gains were among first- and second-graders, with the smallest gains in middle schools.
Despite serving a much poorer and socially and economically isolated student body than in state schools overall, the Eastern Kentucky schools served by Partners for Education have seen substantially higher increases in test scores: from 2012 to 2015, math test scores in the Promise Neighborhood region rose 7.0 percentage points compared with 4.4 percentage points across the state, and reading scores rose 7.3 percentage points, compared with 5.8 percentage points statewide.
An independent study of middle school students who participated in the after-school programs run by Children’s Aid Society community schools in New York City had bigger gains in math and reading test scores than peers who did not participate. They also had higher relative increases in school attendance and in teacher-reported “motivation to learn.” And while the Children’s Aid Society did not make early childhood education investments a core component of its strategy, its Zero-to-Five program, which connects the federal Early Head Start and Head Start programs, produced relative test score gains among participants. Specifically, a study found that participants outperformed their peers 97 percent of the time on third-, fourth-, and fifth-grade standardized tests in math and reading, demonstrating a significant long-term positive effect (Caspe and Lorenzo Kennedy 2014).
Increases (or lack of decreases) in reading scores over the summer months (between the end of the school year and the start of the following year) can be an especially important indicator of sustainable academic achievement, since low-income students tend to lose substantial ground when they are out of school for the summer. Students who attended the North Minneapolis Northside Achievement Zone’s extended learning summer programs increased their reading test scores between the end of one school year and the beginning of the next, a period when scores normally decrease. And an evaluation of students who attended the East Durham Children’s Initiative’s summer camp in the summer of 2014 found that they lost no ground in literacy over those months.
Case study districts with more mature initiatives and those offering higher or more intensive doses of whole-child interventions are producing particularly large academic gains. Students enrolled in City Connects elementary schools in Boston score significantly higher on tests of both academic and noncognitive skills in elementary and secondary school, with the highest-risk students, such as English language learners, showing especially large gains. Scores of City Connects elementary school students on the Stanford Achievement Test version 9 increased between one-fourth and one-half a standard deviation greater than scores of their non–City Connects peers. And graduates of City Connects secondary schools are more likely to attend one of Boston’s three most selective public high schools.
Better student attendance and engagement are also predictors of academic gains
Chronic absenteeism depresses achievement, particularly among low-income students. A 2009 study found that New York City Children’s Aid Society’s community schools had “far higher” attendance than peer schools, and that schools with health centers tended to have higher attendance than those without health centers (Clark et al. 2009). Students attending City Connects high schools in Boston have significantly lower rates of chronic absenteeism than their peers (Boston College Center for Optimized Student Support 2012). In Joplin, Missouri, attendance rates among high school students increased 3.7 percentage points, rising from 91.3 percent in 2008 to 95.0 percent in 2012; black and Hispanic students closed gaps with their white peers over that period. At the same time, reportable disciplinary incidents—which keep students out of school and are found to drive at-risk students to disengage—dropped by over 1,000, from 3,648 in 2008 to 2,376 in 2012.35
Every infant and toddler in East Durham whose family participated in the Healthy Families Durham home visiting program is up to date on immunizations; this helps at-risk children avoid missing school due to illness. In Pea Ridge, collaboration with one of the city’s doctors enabled the district to provide physical exams for high school students who would otherwise go without them. This not only improved their health but enabled them to participate in the kinds of extracurricular sports activities that boost student engagement. And City Connects’ practice of helping families draw on Medicaid coverage and of referring eligible students to insurance-eligible providers increases students’ access to both physical and mental health care. Given extensive evidence linking reduced absenteeism and improved physical and mental health to academic gains, these initiatives’ records of boosting both attendance and health represent another pathway to student success.36
Increases in advanced coursework and completion of associated exams suggest improved college and career readiness
Because most of the initiatives studied have been in place for less than 10 years, and a few for five or fewer, there is less evidence of their impact on high school graduation and college enrollment. Nonetheless, the degree to which low-income and minority students in these districts perform better and have seen greater gains on these key indicators than their peers in comparable districts or across the state highlights the promise of comprehensive education approaches and, in some instances, their capacity to sustain and even boost children’s early gains.
Parent-organizing in Austin helped establish a program to get more low-income and minority middle school students into rigorous science and math programs, enabling them to successfully compete for slots in the prestigious LBJ High School Science Academy. From the 2007–2008 to the 2014–2015 academic year, the number of Kalamazoo Public School students taking Advanced Placement (AP) courses more than doubled, with low-income and African American students experiencing the largest absolute gains in participation and Hispanic students experiencing the largest percentage gains. Black and low-income students roughly quadrupled their participation in such courses; 263 black students and 193 low-income students took AP classes during the 2014–2015 academic year, up from 63 and 53 respectively in 2007–2008 (Miller-Adams 2015). Over the same period, the number of Hispanic students taking AP courses increased by a magnitude of 10—from just 8 to 78. And in Vancouver, which also made socioeconomic diversity of students in advanced courses a priority, enrollment in AP courses rose by 67 percent overall from 2007–2008 to 2013 –2014, and nearly three times as fast, by almost 200 percent, among low-income students.
Higher graduation rates and increasing college attendance of disadvantaged students are another measure of success of comprehensive strategies
In the early 2000s, the graduation rate at Austin’s Reagan High School fell below 50 percent and enrollment dropped to just 600 students. By 2015, with the benefit of a community schools strategy, the school was serving more than 1,200 students and had a graduation rate of 85 percent.
In the first six years of Bright Futures, Joplin’s graduation rate rose from 73 to 87 percent; from 2012 to 2015 it rose 13 percentage points, versus just 5 percentage points across the state as a whole. At the same time, the cohort dropout rate fell from 6.4 percent to 2.8 percent, with the dropout rate for black students falling slightly more. And in Kalamazoo, incentives to finish high school have proven to be powerful tools for disadvantaged students when combined with mentoring, tutoring, and after-school options. The district’s graduation rate rose from 64 percent in 2009 to 69 percent in 2014, with “five-year cohort graduation rates consistently higher than four-year rates, suggesting that some students may be opting to stay in school an extra year (or even just for the summer) to complete the credits necessary to get a high school diploma” (Miller-Adams 2015, 67). Moreover, African American girls in Kalamazoo graduate at higher rates than their peers across the state, and 85 percent of those graduates go to college.
Initiatives that have had time to mature have made particularly large gains. Montgomery County’s Linkages to Learning initiative began in 1993 and it substantially expanded its pre-K program around a decade later; a county policy responsible for improved racial integration has been in place even longer, since the early 1970s. Hispanic, low-income, and African American students in Montgomery County Public Schools are much more likely than their counterparts across the state to graduate from high school—80.0 vs. 77.5 percent, 81.0 vs. 77.8 percent, and 86.4 versus 80.5 percent, respectively. And from 2011 to 2014, a period when the share of students in poverty and the share of minority students rose in the district, overall graduation rates rose 2.9 percentage points, from 86.8 to 89.7 percent. There were much larger gains for Hispanic and black students, whose graduation rates rose (respectively) by 4.7 percentage points (from 75.3 to 80.0 percent) and 5.1 percentage points (from 81.3 to 86.4 percent), thus narrowing their gaps with their white peers by 3.4 and 3.8 percentage points, respectively (MCPS 2015). Participation in Boston’s City Connects program, which began in 2001, cuts a student’s odds of dropping out of high school nearly in half: 8.0 percent versus 15.2 percent for comparison students (Boston College Center for Optimized Student Support 2014). In Vancouver, the four-year graduation rate rose from 64 percent in 2010 to almost 80 percent in 2013, and the five-year rate rose from 69 percent in 2010 to over 80 percent in 2013. Vancouver’s Hispanic students had five-year graduation rate gains of over 15 percentage points.
Strong parent and community engagement is another sign of progress
The comprehensive, whole-child, whole-community approaches in the featured school districts have built strong school–community partnerships. Two indicators of the strength of the partnerships are the levels of parent and community engagement. In Joplin, 194 more adults are now serving as mentors and tutors than five years ago. And the American Association of School Administrators, National School Public Relations Association, and Blackboard Connected selected Vancouver Public Schools Superintendent Steve Webb and Chief of Staff Tom Hagley for their 2011 Leadership through Communication Award for their successful efforts to increase family engagement in high-poverty VPS schools.
Parental engagement boosts student achievement both directly and through other improvements to families’ situations. As they work actively with their “connectors,” Northside Achievement Zone parents in North Minneapolis become more likely to make academics a priority, to engage with their children’s schools, and to be focused on sending their children to college. The support also helps more families connect with stable housing, substantially reducing the number of times that some vulnerable families move. In 2014–2015, up to 300 Austin families benefited from help with legal, employment, health, and housing issues at the family resource center, which also provides classes for parents, including English language learning classes. And Montgomery County Public Schools social workers who specialize in early childhood education make an average of 200 home visits, 1,000 phone contacts, and 300 direct contacts with parents at school or conferences each month. These lead to roughly 1,000 monthly referrals to community services—many of them emergency interventions dealing with food, clothing, and housing—that help families meet their children’s basic needs and, thus, support their children’s education (Marietta 2010).
In some cases, engagement enhances school leadership. Through access to supports such as social services and adult education, parents of students in New York’s Children’s Aid Society community schools got more involved in their children’s schools, took more responsibility for their children’s schoolwork, reported feeling more welcome within the schools, and were observed to be a greater presence in the community schools than in comparison schools. And over 2,000 Kentucky parents have undergone training at the Berea Commonwealth Institute for Parent Leadership since its creation in 1997. Many of these parents have gone on to join school boards, serve on school councils, and engage in day-to-day educational advocacy.
Expansion of these initiatives shows that other districts, and even state policymakers, consider them successful
After City Connects succeeded in improving student achievement in over a dozen of Boston’s highest-poverty schools, the initiative caught the attention of state policymakers, who recruited City Connects to help turn around schools in Springfield, home to another large high-poverty urban district in Massachusetts. Aided by federal School Improvement Grant funds, City Connects has operated in Springfield since 2010, expanding from six to 13 schools in its first four years there. In New York City, the Children’s Aid Society played a central role in Mayor Bill de Blasio’s 2016 decision to employ a community schools strategy to turn around 100 of the city’s most struggling schools. And in both Vancouver and Austin, district leaders have led advocacy efforts to bring community schools to other communities in the region and to support the introduction of state-level legislation to enhance the work.
Bright Futures began in Joplin, Missouri, in 2009 but is now a national organization. Bright Futures USA has 50 affiliates in eight states, many of which—such as Pea Ridge—are just two or three years old. The newest affiliate, in Fairbanks, Alaska, has just been made official. In Virginia, Dave Sovine, superintendent of a second-year affiliate, Frederick County Public Schools, is reaching out to several of his counterparts across the region to create the first regional Bright Futures initiative (Gizriel 2016). If established, this would allow for the kind of cross-district collaboration identified by Bright Futures founder C.J. Huff as critical to breaking down the silos created by arbitrary boundaries that reflect political preferences rather than children’s daily realities.37
Conclusions
As this report demonstrates, very large social-class-based gaps in academic performance exist and have persisted across the two most recently studied cohorts of students starting kindergarten. The estimated gap between children in the top fifth and the bottom fifth of the SES distribution is over a standard deviation in both reading and math in 2010 (unadjusted performance gaps are 1.17 and 1.25 sd respectively). Gaps in noncognitive skills such as self-control and approaches to learning—which are critical not only as foundations for academic achievement but also more broadly for children’s healthy development—are about half as large (about 0.4 sd in self-control, and slightly over 0.5 sd in approaches to learning in 2010).
Another important finding from our study is that gaps were not, on average, sensitive to the set of changes that may have occurred between 1998 and 2010: gaps across both types of skills are virtually unchanged compared with the prior generation of students—those who entered school in 1998. The only cognitive gap that changed substantially was in reading skills, which increased by about a tenth of a standard deviation. The gaps by SES in mathematics, in approaches to learning as reported by parents, and in self-control as reported by teachers did not change significantly. And relative gaps in approaches to learning as reported by teachers and in self-control as reported by parents shrank between 1998 and 2010, by about a tenth of a standard deviation.38
We also find that, while taking into account children’s personal and family characteristics, parental activities, and other factors reduces the gaps somewhat, it does not come close to eliminating them. This means that there is a substantial set of SES-related factors that are not captured by the traditional covariates used in this study but that are important to understanding how and why gaps develop. Moreover, the capacity for these other factors—child and family characteristics, early education investments, and expectations—to narrow gaps has decreased over time. This suggests that, while such activities as parental time spent with children and center-based pre-K programs cushion the negative consequences of growing up in a low-social-class context, they can do only so much, and that the overall toxicity of lacking resources and supports is increasingly hard to compensate for. The resistance of gaps to these controls should thus be a matter of real concern for researchers and policymakers.
These troubling trends point to critical implications for policy and for our society: clearly, we are failing to provide the foundational experiences and opportunities that all children need to succeed in school and thrive in life. The failure to narrow gaps between 1998 and 2010 suggests, too, that investments in pre-K programs and other early education and economic supports were insufficient to counter rising rates of poverty and its increasing concentration in neighborhoods where black and Hispanic children tend to live and learn.
But there is also good news. The case study review in the previous section of this report explores district-level strategies to address these gaps, strategies that are being implemented in diverse communities across the country. The most effective ones begin very early in children’s lives and are sustained throughout their K–12 years and beyond. The communities studied all employ comprehensive educational approaches that align enriching school strategies with a range of supports for children and their families. Their implementation is often guided by holistic data and, to the extent possible, this report provides a summary, as well, of student outcomes, using both traditional academic measures and a broad range of other measures.
These findings also point to further research questions that need to be addressed, including why gaps changed or did not change, for whom they changed (or did not change), and what is the absolute change in children’s skills over time.39
Parents are doing what they need to do, and a growing number of communities are, too, but as a society, we are still falling far short
Over the period studied, parents across all social class groups became more involved in their young children’s early education and development, with increases in involvement being especially pronounced among low-SES parents. Parents were more likely in 2010 than in 1998 to read regularly to their children; to sing to them; to play games with them; and to enroll them in center-based pre-K programs. Parents in 2010 also had significantly higher expectations for their children’s educational attainment, and mothers themselves were more highly educated—both factors that are associated with higher achievement for those children. In other words, parents’ actions show that they are doing more of what the brain science indicates they need to do, which either suggests that information about children’s needs during those years is more widely disseminated than it was for the prior cohort we studied, or that parenting styles have changed in a way that benefits the development in the early years.
And, as the case studies indicate, the number of communities that have embraced systems of comprehensive enrichment and supports (“Broader, Bolder Approaches to Education”) is growing. As these communities have shown, such comprehensive education policies are feasible; embedded in these policies is an understanding that children’s development involves nurturing a variety of competencies throughout the stages of development, that there are many individuals participating in these processes, and that coordinated efforts by various stakeholders are needed to put these processes to work. Key principles that span across the case studies include very early interventions and supports, parental engagement and education, pre-K, kindergarten transitions, whole-child approaches to curricula, and wraparound supports that are sustained through the K–12 years. Given the significant need for more such strategies, it is important to understand the factors that drove their enactment in a diverse set of communities, and to continue to monitor both the challenges these communities (and others like them) encounter and the outcomes/benefits of the initiatives.
However, despite the abundance of child development information available to researchers and parents—about the serious impacts of child poverty, about what works to counter those effects, about the importance of the first years of life for children, and about the value of education—our data indicate insufficient policy response at all levels of government. Pre-K programs have expanded incrementally and unevenly, with both access and quality still wildly disparate across states and overall availability severely insufficient. There is a dearth of home visiting programs and of quality child care (Bivens et al. 2016). Child poverty has increased (see Proctor, Semega, and Kollar 2016 for recent trends in child poverty rates). And the schools these children enter face increasing economic and racial segregation but with even fewer resources than they had in 1998 to deal with them (Adamson and Darling-Hammond 2012; Baker and Corcoran 2012; Carnoy and García 2017). And while a growing number of districts have embraced Broader, Bolder approaches, that number is failing to keep up with high and growing need.
In sum, it is actually positive, and somewhat impressive, that gaps by and large did not grow in the face of steadily increasing income inequality, compounded by the worst economic crisis in many decades (EPI 2012, 2013; Saez 2016). But it is disappointing and troubling that new policy investments made in the previous decade were insufficient to make even a dent in these stubborn gaps. We cannot ensure real opportunities for all our children unless we tackle the severe inequities underlying our findings. And while momentum to enact comprehensive and sustained strategies to close gaps is growing, such strategies are not being implemented nearly as quickly as children need them to be.
Next policy steps
These data on large, stubborn gaps across both traditional cognitive and noncognitive skills should guide the design of education policies at the federal, state, and local levels; the combined resources and support of government at all three levels are needed if we are to tackle these inequalities effectively.40
Policymakers can begin by learning from the small-scale, district-level strategies presented in the review of case studies above (see the section “What are pioneering school districts doing to combat these inequities and resulting gaps?” above). Looking at these case studies, policymakers can ask: What are the key strategies these communities employed, what main components characterize these strategies, and how did these communities effectively implement the strategies? What challenges did these communities face, what was needed to overcome the challenges, and how can we shape policies that better support other communities’ abilities to respond to such challenges and, to the extent possible, avert them? The latter set of questions is particularly pertinent to issues of scalability, financing, and sustainability, all of which have posed significant challenges for the districts studied and others like them. Policymakers can further ask: What other sources or examples might we learn from? Obvious ones include other districts that employ “community schools” strategies (as Vancouver, New York City, and Austin do) and Promise Neighborhood initiatives beyond Berea/Eastern Kentucky and the Northside Achievement Zone. Bright Futures affiliates now exist in 50 districts across eight states—and the program continues to grow—offering another set of communities to look to.
Also, new opportunities under the Every Student Succeeds Act (ESSA)—from funding to expand and align early childhood education programs to broader and more supports-based educator- and school-accountability systems—provide another avenue for exploration and educational improvement. This is already the focus of states and districts across the country—as well as of education policy nonprofits and associations—and is a focus that has the potential to inspire viable larger-scale models (Cook-Harvey et al. 2016).
We must take action, in particular, in those areas of policy related to early education in which we have seen little or no progress over the past decade. These include child care: comprehensive supports that engage parents as partners in their children’s education must start early and be of high quality to prevent the emergence of gaps and provide time to close any gaps that emerge (Bivens et al. 2016, among others). Quality preschool, among the most-agreed-upon strategies to avert and narrow early gaps, continues to be much talked about but far too little invested in and far too infrequently and shoddily implemented. The advantages of preschool have been known for decades, and significant progress has been made in preschool enrollment over that time; however, preschool enrollment stagnated soon after 2000 (Barnett et al. 2017; U.S. ED 2015) and there continue to be significant inequities in access (see Table 2; García 2015) and, just as important, in quality (NIEER 2016). And the gains made through these early, whole-child-oriented supports must be sustained through children’s K–12 years, with attention to issues of funding levels and equity, racial and socioeconomic integration, and enriching opportunities in the hours after school and in the summer months.
Altogether, this report adds to the strong evidentiary base that identifies strategies to reduce the education consequences of economic inequality. It also sheds light on the need to conduct further research on the channels that drive or cushion changes in readiness. A close follow-up of these trends in the near future and of the measures adopted to really tackle inequities will not only determine what type of society we will be, but will also say a lot about what type of society we actually are. This study, affirming a growing number of other studies on these issues, points to an “American Dream” that is alive in public pronouncements but dormant and pale in reality.
About the authors
Emma García is an education economist at the Economic Policy Institute, where she specializes in the economics of education and education policy. Her areas of research include analysis of the production of education, returns to education, program evaluation, international comparative education, human development, and cost-effectiveness and cost-benefit analysis in education. Prior to joining EPI, García conducted research for the Center for Benefit-Cost Studies of Education and other research centers at Teachers College, Columbia University, and did consulting work for the National Institute for Early Education Research, MDRC, and the Inter-American Development Bank. García has a Ph.D. in economics and education from Teachers College, Columbia University.
Elaine Weiss served as the national coordinator for the Broader, Bolder Approach to Education (BBA) from 2011 to 2017, in which capacity she worked with four co-chairs, a high-level task force, and multiple coalition partners to promote a comprehensive, evidence-based set of policies to allow all children to thrive. Weiss came to BBA from the Pew Charitable Trusts, where she served as project manager for Pew’s Partnership for America’s Economic Success campaign. Weiss was previously a member of the Centers for Disease Control and Prevention’s task force on child abuse and served as volunteer counsel for clients at the Washington Legal Clinic for the Homeless. She holds a Ph.D. in public policy from the George Washington University and a J.D. from Harvard Law School.
Acknowledgments
An earlier version of this paper was prepared for “Strong Foundations: The Economic Futures of Kids and Communities,” the Federal Reserve System Community Development Research Conference, Washington, D.C., March 23–24, 2017. We appreciate the feedback we received from our discussant Richard Todd and from the audience. The authors gratefully acknowledge Rob Grunewald and Milagros Nores for their insightful comments and advice on earlier drafts of the paper. Special gratitude is expressed to Sean Reardon, for his advice and thorough guidance on the sensitivity analyses affecting the measurement of the cognitive skills and their implications for our study, and for sharing useful materials to help test our results. We thank Ben Zipperer and Yilin Pan for their advice on issues associated with multiple imputation of missing data. We are also grateful to Lora Engdahl and Krista Faries for editing this report, and to Margaret Poydock for her work preparing the tables and figures and formatting the report. Finally, we appreciate the assistance of communications staff at the Economic Policy Institute who helped to disseminate the study, especially Dan Crawford, Kayla Blado, and Elizabeth Rose.
Address correspondence to: Economic Policy Institute, 1225 Eye St. NW, Suite 600, Washington, D.C., 20005. Email: egarcia@epi.org; eweiss@boldapproach.org.
Figures and tables
Unadjusted cognitive and noncognitive skills gaps between high-SES and low-SES children at the beginning of kindergarten in 1998 and change in gaps by the beginning of kindergarten in 2010
| Gap between high-SES (fifth) and low-SES (first) quintiles in 1998 | Change in gap from 1998 to 2010 | |
|---|---|---|
| Reading | 1.07 | 0.10 |
| Math | 1.26 | -0.01 |
| Self-control (by teachers) | 0.39 | -0.01 |
| Approaches to learning (by teachers) | 0.63 | -0.12 |
| Self-control (by parents) | 0.47 | -0.08 |
| Approaches to learning (by parents) | 0.54 | 0.02 |
Notes: SES refers to socioeconomic status. The gaps are the baseline unadjusted standard deviation scores for high-SES children relative to low-SES children. The gap in 2010 equals the gap in 1998 plus the change in the gap from 1998 to 2010. For example, the gap in approaches to learning as reported by teachers in 2010 is 0.51 sd (0.63 – 0.12). For statistical significance of these numbers, see Tables 3 and 4, Model 1.
Source: EPI analysis of ECLS-K, kindergarten classes of 1998–1999 and 2010–2011 (National Center for Education Statistics)
Fully adjusted cognitive and noncognitive skills gaps between high-SES and low-SES children at the beginning of kindergarten in 1998 and change in gaps by the beginning of kindergarten in 2010
| Gap between high-SES (fifth) and low-SES (first) quintiles in 1998 | Change in gap from 1998 to 2010 | |
|---|---|---|
| Reading | 0.60 | 0.08 |
| Math | 0.61 | 0.05 |
| Self-control (by teachers) | 0.18 | 0.09 |
| Approaches to learning (by teachers) | 0.44 | -0.04 |
| Self-control (by parents) | 0.29 | 0.00 |
| Approaches to learning (by parents) | 0.13 | 0.11 |
Note: SES refers to socioeconomic status. The gaps are standard deviation scores for high-SES children relative to low-SES children after adjusting for all family and child characteristics, pre-K schooling, and enrichment activities with parents, and parental expectations for children’s educational attainment. The gap in 2010 equals the gap in 1998 plus the change in the gap from 1998 to 2010. For statistical significance of these numbers, see Tables 3 and 4, Model 4.
Source: EPI analysis of ECLS-K, kindergarten classes of 1998–1999 and 2010–2011 (National Center for Education Statistics)
Unadjusted cognitive and noncognitive skills gaps between high-SES and low-SES children at the beginning of kindergarten in 1998 and change in gaps by the beginning of kindergarten in 2010, using mother's educational attainment as a proxy for socioeconomic status
| Gap between top and bottom quintiles in 1998 | Change in gap from 1998 to 2010 | |
|---|---|---|
| Reading | 1.29 | -0.02 |
| Math | 1.46 | -0.15 |
| Self-control (by teachers) | 0.32 | -0.10 |
| Approaches to learning (by teachers) | 0.64 | -0.24 |
| Self-control (by parents) | 0.47 | -0.14 |
| Approaches to learning (by parents) | 0.66 | -0.08 |
Notes: The gaps are the baseline unadjusted standard deviation scores for high-SES children relative to low-SES children where high-SES children have mothers in the top quintile of the education distribution and low-SES children have mothers in bottom quintile of the education distribution. The gap in 2010 equals the gap in 1998 plus the change in the gap from 1998 to 2010. For statistical significance of these numbers, see Table 7, Model 1.
Source: EPI analysis of ECLS-K, kindergarten classes of 1998–1999 and 2010–2011 (National Center for Education Statistics)
Unadjusted cognitive and noncognitive skills gaps between high-SES and low-SES children at the beginning of kindergarten in 1998 and change in gaps by the beginning of kindergarten in 2010, using household income as a proxy for socioeconomic status
| Gap between top and bottom quintiles in 1998 | Change in gap from 1998 to 2010 | |
|---|---|---|
| Reading | 1.09 | -0.13 |
| Math | 1.31 | -0.23 |
| Self-control (by teachers) | 0.42 | 0.05 |
| Approaches to learning (by teachers) | 0.60 | -0.13 |
| Self-control (by parents) | 0.44 | 0.04 |
| Approaches to learning (by parents) | 0.44 | 0.03 |
Notes: The gaps are the baseline unadjusted standard deviation scores for high-SES children relative to low-SES children where high-SES children are in households with incomes in the top quintile of the income distribution and low-SES children are in households with incomes in bottom quintile of the income distribution. The gap in 2010 equals the gap in 1998 plus the change in the gap from 1998 to 2010. For statistical significance of these numbers, see Table 8, Model 1.
Source: EPI analysis of ECLS-K, kindergarten classes of 1998–1999 and 2010–2011 (National Center for Education Statistics)
Unadjusted cognitive and noncognitive skills gaps between high-SES and low-SES children at the beginning of kindergarten in 1998 and change in gaps by the beginning of kindergarten in 2010, using number of books the child has in the home as a proxy for socioeconomic status
| Gap between top and bottom quintiles in 1998 | Change in gap from 1998 to 2010 | |
|---|---|---|
| Reading | 0.74 | 0.08 |
| Math | 0.97 | -0.02 |
| Self-control (by teachers) | 0.32 | -0.07 |
| Approaches to learning (by teachers) | 0.46 | -0.06 |
| Self-control (by parents) | 0.28 | -0.04 |
| Approaches to learning (by parents) | 0.58 | 0.09 |
Notes: The gaps are the baseline unadjusted standard deviation scores for high-SES children relative to low-SES children where high-SES children have a number of books in the home in the top quintile of the books-in-the-home distribution and low-SES children have a number of books in the home in the bottom quintile of the books-in-the-home distribution. The gap in 2010 equals the gap in 1998 plus the change in the gap from 1998 to 2010. For statistical significance of these numbers, see Table 9, Model 1.
Source: EPI analysis of ECLS-K, kindergarten classes of 1998–1999 and 2010–2011 (National Center for Education Statistics)
Reading and math achievement gaps, and principal noncognitive skills gaps between high-SES and low-SES children at the beginning of kindergarten in 2010–2011, under unadjusted and clustered models
| Reading | Mathematics | Self-control (by teachers) | Approaches to learning (by teachers) | Self-control (by parents) | Approaches to learning (by parents) | |||||||
|---|---|---|---|---|---|---|---|---|---|---|---|---|
| 1 (unadjusted) | 2 (clustered) | 1 (unadjusted) | 2 (clustered) | 1 (unadjusted) | 2 (clustered) | 1 (unadjusted) | 2 (clustered) | 1 (unadjusted) | 2 (clustered) | 1 (unadjusted) | 2 (clustered) | |
| Gap in 2010–2011 | 1.169*** | 0.944*** | 1.250*** | 0.911*** | 0.386*** | 0.363*** | 0.513*** | 0.562*** | 0.391*** | 0.326*** | 0.563*** | 0.460*** |
| (0.024) | (0.036) | (0.024) | (0.034) | (0.029) | (0.041) | (0.027) | (0.041) | (0.028) | (0.041) | (0.028) | (0.044) | |
| Controls | ||||||||||||
| Demographics | No | No | No | No | No | No | No | No | No | No | No | No |
| Education and engagement | No | No | No | No | No | No | No | No | No | No | No | No |
| Parental expectations | No | No | No | No | No | No | No | No | No | No | No | No |
| School fixed effects | No | Yes | No | Yes | No | Yes | No | Yes | No | Yes | No | Yes |
| Observations | 14,090 | 14,090 | 14,040 | 14,040 | 12,180 | 12,180 | 13,280 | 13,280 | 12,890 | 12,890 | 12,900 | 12,900 |
| Adjusted R2 | 0.165 | 0.281 | 0.190 | 0.276 | 0.021 | 0.114 | 0.034 | 0.105 | 0.018 | 0.028 | 0.037 | 0.118 |
Note: Using the full sample. For statistical significance, *** denotes p < 0.01, ** denotes p < 0.05, and * denotes p < 0.1. The number of observations is rounded to the nearest multiple of 10. Sizes may differ from those inferred from Tables 3–6, and from those in García 2015, due to differences in the sample sizes or to rounding.
Source: EPI analysis of ECLS-K, kindergarten class of 2010–2011 (National Center for Education Statistics)
Child and family characteristics, main developmental activities, and parental expectations for children, kindergarten classes of 1998–1999 and 2010–2011, by socioeconomic status (SES)
| 1998–1999 | Low-SES (quintile 1) | Low-middle SES (quintile 2) | Middle SES (quintile 3) | High-middle SES (quintile 4) | High-SES (quintile 5) | All quintiles | |
|---|---|---|---|---|---|---|---|
| Child and family characteristics and main developmental activities | |||||||
| Race/ethnicity | White | 26.40% | 53.70% | 61.20% | 68.10% | 78.80% | 57.70% |
| Black | 26.20% | 17.80% | 15.50% | 12.00% | 6.40% | 15.60% | |
| Hispanic | 39.80% | 21.20% | 15.80% | 12.70% | 6.80% | 19.20% | |
| Hispanic English language learner (ELL) | 28.40% | 9.50% | 4.80% | 3.10% | 1.40% | 9.40% | |
| Hispanic English speaker | 11.50% | 11.70% | 10.90% | 9.60% | 5.40% | 9.80% | |
| Asian | 2.30% | 1.70% | 2.30% | 2.70% | 4.70% | 2.70% | |
| Other | 5.30% | 5.60% | 5.30% | 4.40% | 3.40% | 4.80% | |
| Poverty status | Lives in poverty | 71.30% | 22.30% | 10.60% | 4.20% | 1.10% | 21.80% |
| Language | Child’s language at home is not English | 31.20% | 12.00% | 7.00% | 6.10% | 5.30% | 12.30% |
| Family composition | Not living with two parents | 45.60% | 30.50% | 23.80% | 15.80% | 11.10% | 25.10% |
| Number of family members | 4.84 | 4.55 | 4.42 | 4.36 | 4.40 | 4.51 | |
| First- or second-generation immigrant | 30.30% | 15.10% | 12.80% | 13.10% | 15.40% | 17.30% | |
| Pre-K care arrangements | Pre-K care | 64.20% | 70.90% | 76.50% | 81.00% | 87.80% | 76.20% |
| Pre-K care, center-based | 43.70% | 45.00% | 50.20% | 55.40% | 65.80% | 52.20% | |
| Parental care | 30.50% | 22.60% | 17.20% | 15.40% | 9.90% | 18.90% | |
| Care by relative | 15.90% | 18.30% | 16.20% | 11.80% | 6.60% | 13.70% | |
| Care by nonrelative | 5.30% | 8.20% | 10.90% | 11.60% | 13.70% | 10.00% | |
| Care by multiple sources | 4.60% | 5.90% | 5.50% | 5.80% | 3.90% | 5.20% | |
| Activities indices | Literacy/reading | -0.221 | -0.059 | -0.010 | 0.070 | 0.193 | -0.003 |
| Other educational and engagement activities | -0.114 | -0.011 | 0.014 | 0.042 | 0.071 | 0.002 | |
| Number of books | Average number | 32.4 | 58.1 | 74.3 | 87.9 | 107.3 | 72.5 |
| Number of books, grouped by least to most | 0–25 | 61.70% | 31.60% | 20.20% | 11.30% | 5.00% | 25.50% |
| 26–50 | 23.10% | 34.80% | 30.80% | 30.60% | 21.40% | 28.20% | |
| 51–100 | 11.30% | 23.40% | 32.90% | 36.00% | 41.00% | 29.10% | |
| 101–199 | 1.80% | 4.00% | 5.70% | 6.60% | 9.50% | 5.60% | |
| More than 200 | 2.10% | 6.20% | 10.30% | 15.50% | 23.00% | 11.50% | |
| Parents’ expectations for their children’s educational attainment | |||||||
| Highest education level expected | High school or less | 24.10% | 15.20% | 7.70% | 3.70% | 1.20% | 10.20% |
| Two or more years of college, vocational school | 16.40% | 21.80% | 21.40% | 11.60% | 3.80% | 14.90% | |
| Bachelor’s degree | 33.20% | 38.70% | 46.70% | 58.80% | 57.20% | 47.10% | |
| Master’s degree | 9.20% | 9.40% | 10.30% | 13.60% | 22.80% | 13.10% | |
| Ph.D. or M.D. | 17.10% | 15.00% | 13.90% | 12.30% | 15.00% | 14.60% | |
| 2010–2011 | Low-SES (quintile 1) | Low-middle SES (quintile 2) | Middle SES (quintile 3) | High-middle SES (quintile 4) | High-SES (quintile 5) | All quintiles | |
| Child and family characteristics, and main developmental activities | |||||||
| Race/ethnicity | White | 23.10% | 45.50% | 56.80% | 69.00% | 71.30% | 52.90% |
| Black | 19.60% | 17.00% | 13.40% | 9.40% | 5.80% | 13.20% | |
| Hispanic | 50.40% | 28.30% | 19.70% | 12.20% | 8.60% | 24.10% | |
| Hispanic English language learner (ELL) | 36.10% | 11.90% | 5.20% | 2.10% | 0.90% | 11.40% | |
| Hispanic English speaker | 14.30% | 16.30% | 14.40% | 10.10% | 7.70% | 12.60% | |
| Asian | 2.50% | 2.80% | 3.20% | 4.40% | 8.70% | 4.20% | |
| Others | 4.40% | 6.40% | 7.00% | 4.90% | 5.60% | 5.70% | |
| Poverty status | Lives in poverty | 84.60% | 35.70% | 10.90% | 3.10% | 0.60% | 25.50% |
| Language | Child’s language at home is not English | 40.30% | 15.60% | 8.00% | 5.00% | 7.00% | 15.30% |
| Family composition | Not living with two parents | 54.90% | 41.70% | 34.10% | 19.30% | 9.60% | 31.80% |
| Number of family members | 4.81 | 4.62 | 4.53 | 4.44 | 4.46 | 4.57 | |
| First- or second-generation immigrant | 49.80% | 25.70% | 18.90% | 17.20% | 21.60% | 26.10% | |
| Pre-K care arrangements | Pre-K care | 66.60% | 75.60% | 81.60% | 85.00% | 88.30% | 79.30% |
| Pre-K care, center-based | 44.30% | 47.00% | 53.10% | 61.60% | 69.90% | 55.10% | |
| Parental care | 34.90% | 25.40% | 19.10% | 15.40% | 12.00% | 21.40% | |
| Care by relative | 16.00% | 19.70% | 17.40% | 12.70% | 8.60% | 14.90% | |
| Care by nonrelative | 3.30% | 5.50% | 7.40% | 7.30% | 6.90% | 6.10% | |
| Care by multiple sources | 1.50% | 2.40% | 3.10% | 2.90% | 2.70% | 2.50% | |
| Activities indices | Literacy/reading | -0.231 | -0.038 | 0.033 | 0.094 | 0.171 | 0.008 |
| Other educational and engagement activities | -0.049 | 0.022 | 0.029 | 0.026 | 0.001 | 0.006 | |
| Number of books | Average number | 35.2 | 57.6 | 74.1 | 90.8 | 106.3 | 73.1 |
| Number of books, grouped by least to most | 0–25 | 59.30% | 33.60% | 19.40% | 11.50% | 5.00% | 25.50% |
| 26–50 | 24.70% | 31.70% | 32.50% | 26.90% | 22.40% | 27.70% | |
| 51–100 | 11.20% | 24.80% | 32.30% | 39.00% | 41.70% | 30.00% | |
| 101–199 | 1.70% | 3.10% | 5.50% | 6.50% | 7.70% | 4.90% | |
| More than 200 | 3.10% | 6.80% | 10.30% | 16.20% | 23.20% | 12.00% | |
| Parents’ expectations for their children’s educational attainment | |||||||
| Highest education level expected | High school or less | 11.40% | 6.20% | 5.00% | 2.40% | 1.00% | 5.20% |
| Two or more years of college, vocational school | 16.70% | 25.00% | 17.20% | 9.80% | 3.20% | 14.40% | |
| Bachelor’s degree | 34.80% | 39.10% | 47.00% | 57.10% | 53.10% | 46.30% | |
| Master’s degree | 10.70% | 12.30% | 14.60% | 16.80% | 26.60% | 16.20% | |
| Ph.D. or M.D. | 26.40% | 17.30% | 16.20% | 13.90% | 16.10% | 17.90% | |
Note: SES refers to socioeconomic status.
Source: EPI analysis of ECLS-K, kindergarten classes of 1998–1999 and 2010–2011 (National Center for Education Statistics)
Reading and math skills gaps between high-SES and low-SES children at the beginning of kindergarten in 1998 and change in gaps by the beginning of kindergarten in 2010, under unadjusted to fully adjusted models
| Reading models | Mathematics models | |||||||
|---|---|---|---|---|---|---|---|---|
| 1 (unadjusted) | 2 | 3 | 4 (fully adjusted) | 1 (unadjusted) | 2 | 3 | 4 (fully adjusted) | |
| Gap in 1998 | 1.071*** | 0.846*** | 0.641*** | 0.596*** | 1.258*** | 0.932*** | 0.668*** | 0.610*** |
| (0.024) | (0.032) | (0.031) | (0.031) | (0.022) | (0.033) | (0.030) | (0.031) | |
| Change in gap by 2010 | 0.098*** | 0.122*** | 0.096* | 0.080 | -0.008 | 0.025 | 0.053 | 0.051 |
| (0.033) | (0.046) | (0.051) | (0.052) | (0.032) | (0.045) | (0.047) | (0.048) | |
| Controls | ||||||||
| Demographics | No | No | Yes | Yes | No | No | Yes | Yes |
| Education and engagement | No | No | Yes | Yes | No | No | Yes | Yes |
| Parental expectations | No | No | No | Yes | No | No | No | Yes |
| School fixed effects | No | Yes | Yes | Yes | No | Yes | Yes | Yes |
| Observations | 30,950 | 30,950 | 26,050 | 26,050 | 31,850 | 31,850 | 26,890 | 26,890 |
| Adjusted R2 | 0.152 | 0.243 | 0.289 | 0.293 | 0.189 | 0.265 | 0.331 | 0.336 |
Notes: Models 1 and 2 use the full sample; Models 3 and 4 use the complete cases sample. Robust standard errors are in parentheses. For statistical significance, *** denotes p < 0.01, ** denotes p < 0.05, and * denotes p < 0.1. The number of observations is rounded to the nearest multiple of 10. SES refers to socioeconomic status.
Source: EPI analysis of ECLS-K, kindergarten classes of 1998–1999 and 2010–2011 (National Center for Education Statistics)
Noncognitive skills gaps between high-SES and low-SES children at the beginning of kindergarten in 1998 and change in gaps by the beginning of kindergarten in 2010, under unadjusted to fully adjusted models
| Self-control (reported by teachers) models | Approaches to learning (reported by teachers) models | |||||||
|---|---|---|---|---|---|---|---|---|
| 1 (unadjusted) | 2 | 3 | 4 (fully adjusted) | 1 (unadjusted) | 2 | 3 | 4 (fully adjusted) | |
| Gap in 1998 | 0.394*** | 0.304*** | 0.217*** | 0.182*** | 0.630*** | 0.630*** | 0.493*** | 0.435*** |
| (0.025) | (0.037) | (0.037) | (0.038) | (0.024) | (0.035) | (0.036) | (0.037) | |
| Change in gap by 2010 | -0.009 | 0.065 | 0.078 | 0.085 | -0.117*** | -0.066 | -0.042 | -0.043 |
| (0.037) | (0.054) | (0.060) | (0.061) | (0.035) | (0.053) | (0.057) | (0.057) | |
| Controls | ||||||||
| Demographics | No | No | Yes | Yes | No | No | Yes | Yes |
| Education and engagement | No | No | Yes | Yes | No | No | Yes | Yes |
| Parental expectations | No | No | No | Yes | No | No | No | Yes |
| School fixed effects | No | Yes | Yes | Yes | No | Yes | Yes | Yes |
| Observations | 29,500 | 29,500 | 25,080 | 25,080 | 31,260 | 31,260 | 26,460 | 26,460 |
| Adjusted R2 | 0.019 | 0.117 | 0.173 | 0.175 | 0.040 | 0.117 | 0.199 | 0.204 |
| Self-control (reported by parents) models | Approaches to learning (reported by parents) models | |||||||
|---|---|---|---|---|---|---|---|---|
| 1 (unadjusted) | 2 | 3 | 4 (fully adjusted) | 1 (unadjusted) | 2 | 3 | 4 (fully adjusted) | |
| Gap in 1998 | 0.467*** | 0.424*** | 0.357*** | 0.291*** | 0.539*** | 0.479*** | 0.215*** | 0.132*** |
| (0.025) | (0.036) | (0.039) | (0.040) | (0.025) | (0.032) | (0.033) | (0.033) | |
| Change in gap by 2010 | -0.076** | -0.084 | -0.032 | 0.001 | 0.024 | -0.024 | 0.096* | 0.112** |
| (0.037) | (0.054) | (0.060) | (0.061) | (0.036) | (0.053) | (0.055) | (0.056) | |
| Controls | ||||||||
| Demographics | No | No | Yes | Yes | No | No | Yes | Yes |
| Education and engagement | No | No | Yes | Yes | No | No | Yes | Yes |
| Parental expectations | No | No | No | Yes | No | No | No | Yes |
| School fixed effects | No | Yes | Yes | Yes | No | Yes | Yes | Yes |
| Observations | 30,400 | 30,400 | 27,220 | 27,220 | 30,420 | 30,420 | 27,240 | 27,240 |
| Adjusted R2 | 0.022 | 0.037 | 0.075 | 0.079 | 0.035 | 0.057 | 0.218 | 0.228 |
Notes: Models 1 and 2 use the full sample; Models 3 and 4 use the complete cases sample. Robust standard errors are in parentheses. For statistical significance, *** denotes p < 0.01, ** denotes p < 0.05, and * denotes p < 0.1. The number of observations is rounded to the nearest multiple of 10. SES refers to socioeconomic status.
Source: EPI analysis of ECLS-K, kindergarten classes of 1998–1999 and 2010–2011 (National Center for Education Statistics)
Reductions in skills gaps between high-SES and low-SES children after accounting for missingness and covariates, 1998 and 2010
| Year | Reduction | Change in reduction from 1998 to 2010 (in percentage points) | |
|---|---|---|---|
| Reading | 1998 | 45.5% | |
| 2010 | 42.9% | -2.6 | |
| Math | 1998 | 52.6% | |
| 2010 | 48.6% | -4.1 | |
| Self-control (reported by teachers) | 1998 | 50.8% | |
| 2010 | 32.6% | -18.1 | |
| Approaches to learning (reported by teachers) | 1998 | 28.3% | |
| 2010 | 20.3% | -8 | |
| Self-control (reported by parents) | 1998 | 35.3% | |
| 2010 | 34.3% | -1.1 | |
| Approaches to learning (reported by parents) | 1998 | 73.5% | |
| 2010 | 56.0% | -17.5 |
Note: SES refers to socioeconomic status. Declining values from 1998 to 2010 indicate that factors such as early literacy activities and other controls were not as effective at shrinking SES-based gaps in 2010 as they were in 1998.
Source: EPI analysis of ECLS-K, kindergarten classes of 1998–1999 and 2010–2011 (National Center for Education Statistics)
Summary of association between cognitive and noncognitive skills at kindergarten entry and selected early educational practices, fully adjusted differences (Model 4)
| Reading | Math | Self-control (reported by teachers) | Approaches to learning (reported by teachers) | Self-control (reported by parents) | Approaches to learning (reported by parents) | |
|---|---|---|---|---|---|---|
| Correlations between selected practices and skills measured at kindergarten entry in 1998 | ||||||
| Center-based pre-K | 0.106*** | 0.097*** | -0.125*** | -0.001 | -0.006 | 0.018 |
| (0.016) | (0.015) | (0.018) | (0.018) | (0.019) | (0.016) | |
| Number of books | 0.012*** | 0.016*** | 0.004** | 0.008*** | 0.002 | 0.006*** |
| (0.002) | (0.002) | (0.002) | (0.002) | (0.002) | (0.002) | |
| Reading/literacy | 0.166*** | 0.068*** | 0.010 | 0.030* | 0.143*** | 0.315*** |
| (0.016) | (0.015) | (0.018) | (0.016) | (0.018) | (0.017) | |
| Other activities | -0.115*** | -0.036*** | 0.047*** | 0.033** | 0.046*** | 0.292*** |
| (0.015) | (0.014) | (0.017) | (0.016) | (0.017) | (0.016) | |
| Correlations between parents’ expectations about their children’s highest level of educational attainment and skills measured at kindergarten entry in 1998 | ||||||
| Two or more years of college/vocational school | 0.029 | 0.066** | 0.072* | 0.115*** | 0.180*** | 0.136*** |
| (0.025) | (0.026) | (0.042) | (0.037) | (0.038) | (0.033) | |
| Bachelor’s degree | 0.114*** | 0.172*** | 0.141*** | 0.211*** | 0.272*** | 0.228*** |
| (0.023) | (0.023) | (0.036) | (0.032) | (0.036) | (0.030) | |
| Master’s degree or more | 0.160*** | 0.220*** | 0.120*** | 0.219*** | 0.254*** | 0.377*** |
| (0.026) | (0.025) | (0.039) | (0.034) | (0.036) | (0.033) | |
| Changes from 1998 to 2010 in the correlations between selected practices and skills measured at kindergarten entry | ||||||
| Center-based pre-K | -0.005 | -0.036 | 0.060* | -0.010 | -0.020 | 0.010 |
| (0.025) | (0.025) | (0.032) | (0.031) | (0.031) | (0.026) | |
| Number of books | 0.002 | -0.001 | 0.001 | 0.002 | -0.002 | 0.004 |
| (0.003) | (0.002) | (0.003) | (0.003) | (0.003) | (0.002) | |
| Reading/literacy | 0.018 | 0.008 | 0.015 | 0.014 | -0.079*** | -0.173*** |
| (0.025) | (0.024) | (0.031) | (0.028) | (0.030) | (0.027) | |
| Other activities | -0.008 | -0.016 | 0.031 | 0.020 | 0.218*** | 0.265*** |
| (0.025) | (0.024) | (0.029) | (0.028) | (0.029) | (0.025) | |
| Changes from 1998 to 2010 in the correlations between parents’ expectations about their children’s highest level of educational attainment and skills measured at kindergarten entry | ||||||
| Two or more years of college/vocational school | 0.121** | 0.106* | 0.201** | 0.204*** | -0.030 | 0.151** |
| (0.055) | (0.059) | (0.081) | (0.072) | (0.084) | (0.066) | |
| Bachelor’s degree | 0.139*** | 0.103** | 0.136* | 0.174*** | -0.084 | 0.100 |
| (0.048) | (0.051) | (0.070) | (0.063) | (0.078) | (0.061) | |
| Master’s degree or more | 0.186*** | 0.117** | 0.140* | 0.189*** | -0.041 | 0.076 |
| (0.052) | (0.054) | (0.074) | (0.066) | (0.081) | (0.063) | |
| Observations | 26,050 | 26,890 | 25,080 | 26,460 | 27,220 | 27,240 |
| Adj.R2 | 0.293 | 0.336 | 0.175 | 0.204 | 0.079 | 0.228 |
Notes: The robust standard errors are in parentheses. For statistical significance, *** denotes p < 0.01, ** denotes p < 0.05, and * denotes p < 0.1. The number of observations is rounded to the nearest multiple of 10.
Source: EPI analysis of ECLS-K, kindergarten classes of 1998–1999 and 2010–2011 (National Center for Education Statistics)
Cognitive and noncognitive skills gaps between high-SES and low-SES children using mother's educational attainment as a proxy for socioeconomic status (SES), under unadjusted and fully adjusted models
| Reading | Math | Self-control (reported by teachers) | Approaches to learning (reported by teachers) | Self-control (reported by parents) | Approaches to learning (reported by parents) | |||||||
|---|---|---|---|---|---|---|---|---|---|---|---|---|
| 1 (unadjusted) | 4 (fully adjusted) | 1 (unadjusted) | 4 (fully adjusted) | 1 (unadjusted) | 4 (fully adjusted) | 1 (unadjusted) | 4 (fully adjusted) | 1 (unadjusted) | 4 (fully adjusted) | 1 (unadjusted) | 4 (fully adjusted) | |
| Gap in 1998 | 1.294*** | 0.696*** | 1.457*** | 0.681*** | 0.317*** | 0.076 | 0.638*** | 0.409*** | 0.471*** | 0.254*** | 0.655*** | 0.221*** |
| (0.038) | (0.058) | (0.036) | (0.050) | (0.039) | (0.048) | (0.038) | (0.042) | (0.039) | (0.049) | (0.039) | (0.045) | |
| Change in gap by 2010 | -0.020 | -0.075 | -0.154*** | -0.119* | -0.099* | 0.046 | -0.237*** | -0.141* | -0.136** | -0.093 | -0.084 | -0.004 |
| (0.051) | (0.082) | (0.049) | (0.070) | (0.055) | (0.081) | (0.053) | (0.074) | (0.053) | (0.080) | (0.053) | (0.070) | |
| Controls | ||||||||||||
| Demographics | No | Yes | No | Yes | No | Yes | No | Yes | No | Yes | No | Yes |
| Education and engagement | No | Yes | No | Yes | No | Yes | No | Yes | No | Yes | No | Yes |
| Parental expectations | No | Yes | No | Yes | No | Yes | No | Yes | No | Yes | No | Yes |
| School fixed effects | No | Yes | No | Yes | No | Yes | No | Yes | No | Yes | No | Yes |
| Observations | 26,660 | 23,880 | 27,570 | 24,710 | 25,790 | 23,170 | 27,200 | 24,380 | 27,280 | 25,040 | 27,290 | 25,050 |
| Adjusted R2 | 0.134 | 0.282 | 0.166 | 0.328 | 0.009 | 0.172 | 0.029 | 0.199 | 0.017 | 0.079 | 0.032 | 0.223 |
Notes: Model 1 uses the full sample; Model 4 uses the complete cases sample. Robust standard errors are in parentheses. For statistical significance, *** denotes p < 0.01, ** denotes p < 0.05, and * denotes p < 0.1. The number of observations is rounded to the nearest multiple of 10.
Source: EPI analysis of ECLS-K, kindergarten classes of 1998–1999 and 2010–2011 (National Center for Education Statistics)
Cognitive and noncognitive skills gaps between high-SES and low-SES children using household income as a proxy for socioeconomic status (SES), under unadjusted and fully adjusted models
| Reading | Math | Self-control (reported by teachers) | Approaches to learning (reported by teachers) | Self-control (reported by parents) | Approaches to learning (reported by parents) | |||||||
|---|---|---|---|---|---|---|---|---|---|---|---|---|
| 1 (unadjusted) | 4 (fully adjusted) | 1 (unadjusted) | 4 (fully adjusted) | 1 (unadjusted) | 4 (fully adjusted) | 1 (unadjusted) | 4 (fully adjusted) | 1 (unadjusted) | 4 (fully adjusted) | 1 (unadjusted) | 4 (fully adjusted) | |
| Gap in 1998 | 1.090*** | 0.384*** | 1.308*** | 0.443*** | 0.419*** | 0.119** | 0.603*** | 0.325*** | 0.443*** | 0.272*** | 0.436*** | 0.073 |
| (0.042) | (0.058) | (0.041) | (0.060) | (0.045) | (0.050) | (0.044) | (0.049) | (0.045) | (0.051) | (0.044) | (0.052) | |
| Change in gap by 2010 | -0.127** | -0.006 | -0.230*** | -0.060 | 0.049 | 0.228*** | -0.128** | 0.008 | 0.044 | 0.106 | 0.032 | 0.051 |
| (0.060) | (0.084) | (0.059) | (0.082) | (0.066) | (0.081) | (0.064) | (0.079) | (0.065) | (0.084) | (0.064) | (0.080) | |
| Controls | ||||||||||||
| Demographics | No | Yes | No | Yes | No | Yes | No | Yes | No | Yes | No | Yes |
| Education and engagement | No | Yes | No | Yes | No | Yes | No | Yes | No | Yes | No | Yes |
| Parental expectations | No | Yes | No | Yes | No | Yes | No | Yes | No | Yes | No | Yes |
| School fixed effects | No | Yes | No | Yes | No | Yes | No | Yes | No | Yes | No | Yes |
| Observations | 28,650 | 26,050 | 29,560 | 26,890 | 27,550 | 25,080 | 29,110 | 26,460 | 28,170 | 27,220 | 28,190 | 27,240 |
| Adjusted R2 | 0.103 | 0.276 | 0.143 | 0.321 | 0.023 | 0.174 | 0.036 | 0.199 | 0.019 | 0.079 | 0.019 | 0.226 |
Notes: Model 1 uses the full sample; Model 4 uses the complete cases sample. Robust standard errors are in parentheses. For statistical significance, *** denotes p < 0.01, ** denotes p < 0.05, and * denotes p < 0.1. The number of observations is rounded to the nearest multiple of 10.
Source: EPI analysis of ECLS-K, kindergarten classes of 1998–1999 and 2010–2011 (National Center for Education Statistics)
Cognitive and noncognitive skills gaps between high-SES and low-SES children using number of books child has in the home as a proxy for socioeconomic status, under unadjusted and fully adjusted models
| Reading | Math | Self-control (reported by teachers) | Approaches to learning (reported by teachers) | Self-control (reported by parents) | Approaches to learning (reported by parents) | |||||||
|---|---|---|---|---|---|---|---|---|---|---|---|---|
| 1 (unadjusted) | 4 (fully adjusted) | 1 (unadjusted) | 4 (fully adjusted) | 1 (unadjusted) | 4 (fully adjusted) | 1 (unadjusted) | 4 (fully adjusted) | 1 (unadjusted) | 4 (fully adjusted) | 1 (unadjusted) | 4 (fully adjusted) | |
| Gap in 1998 | 0.736*** | 0.347*** | 0.966*** | 0.424*** | 0.324*** | 0.105*** | 0.455*** | 0.241*** | 0.283*** | 0.117*** | 0.583*** | 0.136*** |
| (0.028) | (0.034) | (0.027) | (0.031) | (0.029) | (0.035) | (0.028) | (0.033) | (0.029) | (0.037) | (0.028) | (0.033) | |
| Change in gap by 2010 | 0.083** | -0.540*** | -0.019 | -0.818*** | -0.068 | -0.126 | -0.058 | -0.244 | -0.044 | -0.248 | 0.085** | -0.026 |
| (0.039) | (0.184) | (0.038) | (0.188) | (0.042) | (0.225) | (0.041) | (0.184) | (0.041) | (0.216) | (0.039) | (0.178) | |
| Controls | ||||||||||||
| Demographics | No | Yes | No | Yes | No | Yes | No | Yes | No | Yes | No | Yes |
| Education and engagement | No | Yes | No | Yes | No | Yes | No | Yes | No | Yes | No | Yes |
| Parental expectations | No | Yes | No | Yes | No | Yes | No | Yes | No | Yes | No | Yes |
| School fixed effects | No | Yes | No | Yes | No | Yes | No | Yes | No | Yes | No | Yes |
| Observations | 29,060 | 26,050 | 29,920 | 26,890 | 27,730 | 25,080 | 29,350 | 26,460 | 30,200 | 27,220 | 30,220 | 27,240 |
| Adjusted R2 | 0.080 | 0.270 | 0.120 | 0.314 | 0.012 | 0.172 | 0.024 | 0.194 | 0.009 | 0.075 | 0.047 | 0.226 |
Notes: Model 1 uses the full sample; Model 4 uses the complete cases sample. Robust standard errors are in parentheses. For statistical significance, *** denotes p < 0.01, ** denotes p < 0.05, and * denotes p < 0.1. The number of observations is rounded to the nearest multiple of 10.
Source: EPI analysis of ECLS-K, kindergarten classes of 1998–1999 and 2010–2011 (National Center for Education Statistics)
'Whole-child' case study initiatives, by service area
| Part of school district | Entire school district | Across multiple school districts |
|---|---|---|
| Austin, Texas | Joplin, Missouri | Eastern Kentucky* |
| Boston, Massachusetts | Kalamazoo, Michigan | |
| Durham, North Carolina (East Durham) | Montgomery County, Maryland* | |
| Minneapolis, Minnesota (North Minneapolis) | Pea Ridge, Arkansas | |
| New York, New York | Vancouver, Washington** | |
| Orange County, Florida (Tangelo Park) |
*Indicates that while the initiative covers the entire county or region, a portion of the county or region receives more intensive services.
**Indicates that the initiative will cover the entire school district under plans to expand.
Source: Case studies published on the Broader, Bolder Approach to Education website (www.boldapproach.org/case-studies)
Endnotes
1. Values are in 2008 dollars.
2. Early investments in education strongly predict adolescent and adult development (Cunha and Heckman 2007; Heckman 2008; Heckman and Kautz 2012). For instance, students with higher levels of behavioral skills learn more in school than peers whose attitudinal skills are less developed (Jennings and DiPrete 2010). In general, as Heckman asserted, “skills beget skills,” meaning that creating basic, foundational knowledge makes it easier to acquire skills in the future (Heckman 2008). Conversely, children who fail to acquire this early foundational knowledge may experience some permanent loss of opportunities to achieve to their full potential. Indeed, scholars have documented a correlation between lack of kindergarten readiness and not reading well at third grade, which is a key point at which failing to read well greatly reduces a child’s odds of completing high school (Fiester 2010; Hernandez 2011).
3. Research by Reardon (2011) had found systematic increases in income gaps among generations. Recent studies by Bassok and Latham (2016) and Reardon and Portilla (2016), however, show narrower achievement gaps at kindergarten entry between a recent cohort and the previous one, and thus a possible discontinuation or interruption of that trend. (Bassok et al. [2016] use an SES construct to compare relative teacher assessments of cognitive and behavioral skills among low-SES children versus all children, adjusted by various other characteristics; Reardon and Portilla [2016] look at relative performance of children in the 90th and 10th income percentiles, and use age-adjusted, standardized, outcome scores.) Research by Carnoy and García (2017) shows persistent social-class gaps, but no solid evidence regarding trends: their findings for students in the fourth and eighth grades, in math and reading, show that achievement gaps neither shrink nor grow consistently (they are a function of the social-class indicator, the grade level, or the subject).
4. Clustering takes into account the fact that children are not randomly distributed, but tend to be concentrated in schools or classrooms with children of the same race, social class, etc. These estimates offer an estimate of gaps within schools. See Appendix B for more details.
5. Results available upon request. See García 2015 for results for all SES-quintiles (the baseline or unadjusted gaps in that report correspond with Model 2 in this paper).
6. The Early Childhood Longitudinal Study asks both parents and teachers to rate children’s abilities across a range of these skills. The specific skills measured may vary between the home and classroom setting. Teachers likely evaluate their students’ skills levels relative to those of other children they teach. Parents, on the other hand, may be basing their expectations on family, community, culture, or other factors.
7. See García 2015 for a discussion of which factors in children’s early lives and their individual and family characteristics (in addition to social class) drive the gaps among children of the 2010 kindergarten class.
8. Note that the SES quintiles are constructed using each year’s distribution, and that changes in the overall and relative distribution may affect the characteristics of children in the different quintiles each year (i.e., there may be some groups who are relatively overrepresented in one or another quintile if changes in the SES components changed over time).
9. The detailed frequency with which parents develop or practice some activities with their children at home and others is available upon request.
10. Literature on expectations and on parental behaviors in the home find that they positively correlate with children’s cognitive development and outcomes (Simpkins, Davis-Kean, and Eccles 2005; Wentzel, Russell, and Baker 2016). This literature acknowledges the multiple pathways through which expectations and behaviors influence educational outcomes, as well as the importance of race, social class, and other factors as moderators of such associations (Davis-Kean 2005; Redd et al. 2004; Wentzel, Russell, and Baker 2016; Yamamoto and Holloway 2010).
11. This may be affected by the fact that the highest number of reported books in 1998 was “more than 200,” while in 2010 parents could choose from more categories, up to “more than 1,000.” We had to use 200 as our cap in order to compare data for the two kindergarten classes.
12. Evidence also points to many other factors that affect children’s school readiness, and these, too, likely changed over this time period. For example, access to prenatal care, health screenings, and nutritional programs could all have affected children’s development differently across these two cohorts, but we do not have access to these data and thus cannot control for them in our study. For links between school readiness, children’s health, and poverty, see AAP COCP 2016; Currie 2009; U.S. HHS and U.S. ED 2016.
13. Models include all quintiles in their specification. Tables that offer a comparison for all quintiles relative to the first quintile are available upon request. We focus the discussion on the gap between the top and bottom.
14. As a result, sample sizes become smaller (see Appendix Table C1). Assuming “missingness” (observations without full information) is completely at random, the findings are representative of the original sample and of the populations they represent. Analytic samples once missingness is accounted for are called the complete case samples. We tested to see whether the unadjusted gaps estimated above with the full sample remained the same when using the complete case samples. For Model 1, we found an average difference of 0.01 sd in the estimates of 1998 SES gaps, and an average difference of 0.02 sd in the estimates of the change in the gaps. For Model 2, the differences were 0.01 sd for the gaps’ estimates and 0.04 for changes in the gaps’ estimates. In terms of statistical significance, there are no significant changes in the estimates associated with the 1998 gaps, but there are two changes in the statistical significance of the estimates associated with the changes in the gaps by 2010–2011, and one change in the magnitude of the coefficient. The first change in the statistical significance of the estimates associated with the changes in the gaps by 2010–2011 is the change in the gap in approaches to learning as reported by parents, which is statistically significant when using the restricted sample (0.07 sd, at the 10 percent significance level, Model 1); and the second is the change in the gap in math which also becomes statistically significant when using the restricted sample (0.09, at the 10 percent significance level, Model 2). Finally, the one change in the magnitude of the coefficient, in this model, is the estimate of the change in the gap in reading, which increases when using the restricted sample (from 0.12 sd to 0.18 sd). Results are available upon request.
15. These interactions between inputs and time test for whether the influence of inputs in 2010 is smaller than, the same as, or larger than the influence of inputs in 1998. Also, although only the fully specified results are shown, as noted in Appendix B, these sets of controls are entered parsimoniously in order to determine how sensitive gaps and changes in gaps over time are to the inclusion of family characteristics only, to the added inclusion of family investments, and, finally, to the inclusion of parental expectations (for the inclusion of parental expectations, we incorporated interactions of the covariates with time parsimoniously as well). For all outcomes, and focusing on the models without interactions between covariates and time, we find that all gaps in 1998 continuously shrink as we add more controls. For example, in reading, adding family characteristics reduces the gap in 1998 by 11 percent, adding investments further reduces it by 15 percent, and adding expectations further reduces it by 9 percent. In math, these changes equal to 16 percent, 13 percent, and 10 percent. For changes in the gap by 2010–2011, for both reading and math, adding family characteristics and investments shrink the changes in the gaps, but adding expectations slightly increases the estimated coefficients (which are statistically significant for reading, but not for math in these models. For self-control (as reported by teachers) and approaches to learning (by parents), which are the only two noncognitive skills for which the change in the gap is statistically significant, adding family characteristics reduces the change in the “gap [by 2010–2011” coefficient], but adding investments increases it, and adding expectations further increases the changes in the gaps by 2010–2011. These results are not shown in the appendices, but are available upon request.
16. The interactions between parental expectations of children’s educational attainment and the time variable test for whether the influence of expectations in 2010 is smaller, the same, or larger, than the influence of expectations in 1998.
17. The change in the skills gaps by SES in 2010 due to the inclusion of the controls is not directly visible in the tables in this report. To see this, see the comparison of estimates of models MS1–MS3 in García 2015. The change in the skills gaps by SES in 1998 is directly observable in Tables 3 and 4 and is discussed below.
18. The numbers in the “Reduction” column in Table 5 (showing the shares of the SES-based skills gaps that are accounted for by controls) are always higher for 1998 than for 2010.
19. Please note that until this point in the report we have been concerned with SES gaps and not with performance directly (though SES gaps are the result of the influence of SES on performance, which leads to differential performance of children by SES and hence to a performance gap). The paragraphs above emphasize how controls mediate or explain some of the skills gaps by SES, so, in a way, controls inform our analysis of gaps because they reveal how changes in gaps may have been affected by changes in various factors’ capacity to influence performance. Now the focus is on exploring the independent effect of the covariates of interest on performance. In this report, because we address whether the education and selected practices affect outcomes, the main effect is measured for the 1998 cohort, and we measure how it changed between 1998 and 2010. The detailed discussion for the correlation between covariates and outcomes in 2010 is provided in Table 3 in García 2015.
20. This variable indicates whether the child was cared for in a center-based setting during the year prior to the kindergarten year, compared with other options (as explained in García 2015, these alternatives include no nonparental care arrangements; being looked after by a relative, a nonrelative, at home or outside; or a combination of options. Any finding associated with this variable may be interpreted as the association between attending prekindergarten programs, compared with other options, but must be interpreted with caution. In other words, the child may have attended a high-quality prekindergarten program, which could have been either private or public, or a low-quality one, which would have different impacts. He or she might have been placed in (noneducational) child care, either private or public, of high or low quality, for few or many hours per day, with very different implications for his or her development (Barnett 2008; Barnett 2011; Magnuson et al. 2004; Magnuson, Ruhm, and Waldfogel 2007; Nores and Barnett 2010). For the extensive literature explaining the benefits of pre-K schooling, see Camilli et al. 2010, and for a meta-analysis of results, see Duncan and Magnuson 2013. Thus, more detailed information on the characteristics of the nonparental care arrangements (type, quality, and quantity) would help researchers further disentangle the importance of this variable. This additional information would provide a much clearer picture of the effects of early childhood education on the different educational outcomes.
21. Because these associations seemed counterintuitive, we tested whether they were sensitive to the composition of the index. We removed one component of the index at a time and created five alternative measures of other enrichment activities that parents do with their children. The results indicate that the negative association between the index and reading is not sensitive to the components of the index (the coefficients for the main effect, i.e., for the effect in 1998 range between -0.14 and -0.09, are all statistically significant). For math, the associations lose some precision, but retain the negative sign (negative association) in four out of the five cases (minimum coefficient is -0.06). As a caveat, these components do not reflect whether the activities are undertaken by the child or guided by the adult, the time devoted to them, or how much they involve the use of vocabulary or math concepts. The associations could indicate that time spent on nonacademic activities detracts from parents’ time to spend on activities that are intended to boost their reading and math skills, among other possible explanations. These results are available upon request.
22. Note that in this section, “social class” and “socioeconomic status” (SES) are treated as equivalent terms; in the rest of the report, we refer to SES as a construct that is one measure of social class. See Appendices C and D for discussions of two other sensitivity analyses, one based on imputation of missing values for the main analysis in this paper, and the other on the utilization of various metrics of the cognitive variables. Overall, our findings were not sensitive to various multiple imputation tests. In terms of the utilization of different metrics for the cognitive variables, some sensitivity of the point estimates was detected.
23. With certain activities that are already so provided to high-SES children, there may be little room for doing more for them. For example, there are only 24 hours per day to read to your child, so there is a cap on reading from a cap on time. But perhaps there is still room to improve the influence of reading, if, for example, the way reading is done changes.
24. Eight of the 12 districts explored in this paper are the subjects of published case studies. Case studies for the other four are in progress and will be published later this year. When citing information from the published case studies, we cite the specific published study. For the four that are not yet published, we refer to the original sources being used to develop the case studies.
25. Missing or incomplete cells in the table indicate that data were not available on that aspect of student demographics or other characteristics. As per the source note, most data came either from the districts’ websites or from NCES.
26. In the country as a whole, poverty rates, which had been rising prior to 2007, sped up rapidly during the recession and in its aftermath (through 2011–2012), and minority students (mainly Hispanic and Asian) grew as a share of the U.S. public school student body. Between 2000 and 2013, even with a decline in the proportion of black students, the share of the student body that is minority (of black or Hispanic origin) increased from 30.0 percent to 40.5 percent, and the proportion of low-income students (those eligible for free or reduced-price lunch) also increased, up from 38.3 percent of all public school students in 2000 to 52.0 percent in 2013 (Carnoy and García 2017). The Southern Education Foundation revealed a troubling tipping point in 2013: for the first time since such data have been collected, over half of all public school students (51 percent) qualified for free or reduced-priced meals (i.e., over half of students were living in households at or below 185 percent of the federal poverty line). Across the South, shares were much higher, with the highest percentage, 71 percent—or nearly three in four students—in Mississippi (Southern Education Foundation 2015).
27. A full cross-cutting analysis of why and how these districts have employed whole-child/comprehensive educational approaches will be published as part of a book that draws on these case studies.
28. The federal Early Head Start (EHS) program includes both a home visiting and a center-based component, with many of the low-income infants and toddlers served benefiting from a combination of the two. Studies of EHS find improved cognitive, behavioral, and emotional skills for children as well as enhanced parenting behaviors.
29. According to one important source for data on access to and quality of state pre-K programs, the State of Preschool yearbook produced annually by the National Institute for Early Education Research (NIEER) at Rutgers University, as of 2015, 42 states and the District of Columbia were funding 57 programs. Moreover, programs continued to recover from cuts made during the Great Recession; enrollment, quality, and per-pupil spending were all up, on average, compared with the year before, albeit with the important caveat that two major states—Texas and Florida—lost ground, and that “[f]or the nation as a whole,…access to a high-quality preschool program remained highly unequal, and this situation is unlikely to change in the foreseeable future unless many more states follow the leaders” (NIEER 2016).
30. Elaine Weiss interview with Joshua Starr, June 2017.
31. Murnane and Levy 1996; Elaine Weiss interview with Joshua Starr, June 2017.
32. In recent years, a growing number of reports have emerged that some charter schools—which are technically public schools and often tout their successes in serving disadvantaged students—keep out students unlikely to succeed through complex application processes, fees, parent participation contracts, and other mechanisms, and then further winnow the student body of such students by pushing them out when they struggle academically or behaviorally. For more on this topic, see Burris 2017, PBS NewsHour 2015, and Simon 2013.
33. See AIR 2011 and Sparks 2017. The federal school improvement models, in order of severity (from lightest to most stringent) are termed “transformation,” “turnaround,” “restart,” and “closure” (AIR 2011, 3).
34. While the cut score on any given assessment/test needed for a student to be considered “proficient” is an arbitrary one, and, in Minnesota and many other states, changes from year to year and from one assessment to another, these gains are a helpful indicator of program effectiveness, as they are comparable over the time period described.
35. Joplin statistics are from internal data produced for the superintendent at that time that are no longer available.
36. Attendance Works, a national campaign to reduce chronic absence, points to a range of studies that document and explain the connections between chronic absenteeism, student physical and mental health, and student achievement. Areas of research include elementary school absenteeism, middle and high school absenteeism, health issues, and state and local data on how these problems play out, among others.
37. Elaine Weiss interview with C.J. Huff, June 2016.
38. See Appendix D for a discussion of results using other metrics for reading and math achievement. Results are not meaningfully different across metrics, though the point estimates differ slightly.
39. This last feature will be explored in a companion paper to this one, as soon as the necessary information is released by NCES. (As Tourangeau et al. [2013] note, the assessment scores for the 2010–2011 cohort are not directly comparable with those for the 1998–1999 cohort. We are waiting on the availability of this data to conduct a companion study that allows us to learn whether starting levels of knowledge rose over these years, and what the relative gains were for different demographic groups.)
40. We acknowledge that there are multiple noneducation public policy and economic policy areas to be called upon to address the problems studied in this report, namely, all the ones that ensure other factors that correlate with low-SES are attended, and, obviously, the ones that lead to fewer low-SES children. These other policies could help ensure that more children grow up in contexts with sufficient resources and healthy surroundings, or would leave fewer children without built-in supports at home that need to be compensated for afterwards. We made these points in two early studies, and in the policy brief companion to this study (García 2015; García and Weiss 2015; García and Weiss 2017). A similar comprehensive approach in terms of policy recommendations was used by Putnam (2015).
References
AAP Council on Community Pediatrics (AAP COCP). 2016. “Poverty and Child Health in the United States.” Pediatrics vol. 137, no. 4. pii:e20160339.
Adamson, Frank, and Linda Darling-Hammond. 2012. “Funding Disparities and the Inequitable Distribution of Teachers: Evaluating Sources and Solutions.” Education Policy Analysis Archives vol. 20 (November), 37.
Alvarez, Lizette. 2015. “One Man’s Millions Turn a Community in Florida Around.” New York Times, May 25.
American Institutes for Research (AIR). 2011. School Turnaround: A Pocket Guide.
Austin Independent School District (AISD). 2017. “Pre-K 4” (section on the AISD website).
Baker, Bruce D., and Sean P. Corcoran. 2012. The Stealth Inequities of School Funding. The Center for American Progress.
Barbarin, O.A., J. Downer, E. Odom, and D. Head. 2010. “Home–School Differences in Beliefs, Support, and Control during Public Pre-Kindergarten and Their Link to Children’s Kindergarten Readiness.” Early Childhood Research Quarterly vol. 25, no. 3, 358–72.
Barnett, W. Steven. 2008. Preschool Education and Its Lasting Effects: Research and Policy Implications. Great Lakes Center for Education Research and Practice.
Barnett, W. Steven. 2011. “Effectiveness of Early Educational Intervention.” Science vol. 333, no. 6045, 975–78. doi:10.1126/science.1204534.
Barnett, W. Steven, Elizabeth Votruba-Drzal, Eric Dearing, and Megan E. Carolan. 2017. “Publicly Supported Early Care and Education Programs.” In The Wiley Handbook of Early Childhood Development Programs, Practices, and Policies, Elizabeth Votruba-Drzal and Eric Dearing, eds. Malden, Mass., and Oxford: John Wiley.
Bassok, Daphna, Jenna E. Finch, RaeHyuck Lee, Sean F. Reardon, and Jane Waldfogel. 2016. “Socioeconomic Gaps in Early Childhood Experiences: 1998 to 2010.” AERA Open vol. 2, no. 3.
Bassok, Daphna, and Scott Latham. 2016. “Kids Today: Changes in School-Readiness in an Early Childhood Era.” EdPolicyWorks Working Paper Series no. 35.
Berea College. 2013. “U.S. Secretary of Education Visits First Rural Promise Neighborhood” (news release). November 12.
Bradbury, Bruce, Miles Corak, Jane Waldfogel, and Elizabeth Washbrook. 2015. Too Many Children Left Behind: The U.S. Achievement Gap in Comparative Perspective. New York: Russell Sage Foundation.
Brooks-Gunn, Jeanne, and Lisa Markman. 2005. “The Contribution of Parenting to Ethnic and Racial Gaps in School Readiness.” Future of Children vol. 15, no. 1, 139–68.
Bivens, Josh. 2016. Progressive Redistribution without Guilt. Using Policy to Shift Economic Power and Make U.S. Incomes Grow Fairer and Faster. Economic Policy Institute.
Bivens, Josh, Emma García, Elise Gould, Elaine Weiss, and Valerie Wilson. 2016. It’s Time for an Ambitious National Investment in America’s Children: Investments in Early Childhood Care and Education Would Have Enormous Benefits for Children, Families, Society, and the Economy. Economic Policy Institute.
Boston College Center for Optimized Student Support. 2012. The Impact of City Connects: Progress Report 2012.
Boston College Center for Optimized Student Support. 2014. The Impact of City Connects: Progress Report 2014.
Burris, Carol. 2017. “What the Public Isn’t Told about High Performing Charter Schools in Arizona.” Washington Post Answer Sheet blog, March 30.
Camilli, Gregory, Sadako Vargas, Sharon Ryan, and W. Steven Barnett. 2010. “Meta-Analysis of the Effects of Early Education Interventions on Cognitive and Social Development.” Teachers College Record vol. 112, no. 3, 579–620.
Carnoy, Martin, and Emma García. 2017. Five Key Trends in U.S. Student Performance. Progress by Blacks and Hispanics, the Takeoff of Asians, the Stall of Non-English Speakers, the Persistence of Socioeconomic Gaps, and the Damaging Effect of Highly Segregated Schools. Economic Policy Institute.
Carter, Prudence L., and Kevin G. Welner, eds. 2013. Closing the Opportunity Gap: What America Must Do to Give Every Child an Even Chance. New York: Oxford Univ. Press.
Caspe, Margaret, and Joy Lorenzo Kennedy. 2014. Sustained Success: The Long-Term Benefits of High Quality Early Childhood Education. New York: Children’s Aid Society.
Chaudry, Ajay, Taryn Morrissey, Christina Weiland, and Hirokazu Yoshikawa. 2017. Cradle to Kindergarten: A New Plan to Combat Inequality. New York: Russell Sage Foundation.
Chetty, Raj, David Grusky, Maximilian Hell, Nathaniel Hendren, Robert Manduca, and Jimmy Narang. 2016. “The Fading American Dream: Trends in Absolute Income Mobility since 1940.” NBER Working Paper no. 22910.
Child Trends. 2014. Making the Grade: Assessing the Evidence for Integrated Student Supports.
Clark, H., et al. 2009. Study Comparing Children’s Aid Society Community Schools to Other New York City Public Schools (All Schools and Peer Schools). ActKnowledge.
Coleman, J.S., E. Campbell, C. Hobson, J. McPartland, A. Mood, F. Weinfeld, and R. York. 1966. Equality of Educational Opportunity. Washington, D.C.: U.S. Office of Education.
Collaborative for Academic, Social, and Emotional Learning (CASEL). 2017. “Partner Districts: Austin” (webpage). Accessed August 31, 2017.
Cook-Harvey, C.M., L. Darling-Hammond, L. Lam, C. Mercer, and M. Roc. 2016. Equity and ESSA: Leveraging Educational Opportunity Through the Every Student Succeeds Act. Palo Alto, Calif.: Learning Policy Institute.
Cunha, Flavio, and James J. Heckman. 2007. “The Technology of Skill Formation.” American Economic Review vol. 97, no. 2, 31–47.
Currie, Janet. 2009. “Healthy, Wealthy, and Wise: Socioeconomic Status, Poor Health in Childhood, and Human Capital Development.” Journal of Economic Literature vol. 47, no. 1, 87–122.
Davis-Kean, Pamela E. 2005. “The Influence of Parent Education and Family Income on Child Achievement: The Indirect Role of Parental Expectations and the Home Environment.” Journal of Family Psychology vol. 19, no. 2 (June 2005), 294–304. doi:10.1037/0893-3200.19.2.294.
Duncan, Greg J., Chantelle J. Dowsett, Amy Claessens, Katherine A. Magnuson, Aletha C. Huston, Pamela Klebanov, Linda S. Pagani, Leon Feinstein, Mimi Engel, and Jeanne Brooks-Gunn. 2007. “School Readiness and Later Achievement.” Developmental Psychology vol. 43, no. 6, 1428–46.
Duncan, Greg J., and Katherine A. Magnuson. 2011. “The Nature and Impact of Early Achievement Skills, Attention Skills, and Behavior Problems.” In Whither Opportunity?: Rising Inequality, Schools, and Children’s Life Chances, Greg J. Duncan and Richard Murnane, eds., 47–69. New York: Russell Sage Foundation.
Duncan, Greg J., and Katherine Magnuson. 2013. “Investing in Preschool Programs.” Journal of Economic Perspectives vol. 27, no. 2, 109–32.
Duncan, Greg J., Pamela A. Morris, and Chris Rodrigues. 2011. “Does Money Really Matter? Estimating Impacts of Family Income on Young Children’s Achievement with Data from Random-Assignment Experiments.” Developmental Psychology vol. 47, no. 5, 1263–79. doi:10.1037/a0023875.
Duncan, Greg J., and Richard Murnane. 2011. “Introduction: The American Dream, Then and Now.” In Whither Opportunity?: Rising Inequality, Schools, and Children’s Life Chances, Greg J. Duncan and Richard Murnane, eds. New York: Russell Sage Foundation.
Economic Policy Institute (EPI). 2012. “The Great Recession.” State of Working America feature.
Economic Policy Institute (EPI). 2013. “Inequality.is” (interactive website).
Elmore, Richard, David Thomas, and Tonika Cheek Clayton. 2006. Differentiated Treatment in Montgomery County Public Schools. Public Education Leadership Project at Harvard University.
Fiester, Leila. 2010. Early Warning! Why Reading by the End of Third Grade Matters. KIDS COUNT Special Report. Annie E. Casey Foundation.
García, Emma. 2015. Inequalities at the Starting Gate: Cognitive and Noncognitive Skills Gaps between 2010–2011 Kindergarten Classmates. Economic Policy Institute.
García, Emma, and Elaine Weiss. 2015. Early Education Gaps by Social Class and Race Start U.S. Children Out on Unequal Footing. A Summary of the Major Findings in Inequalities at the Starting Gate. Economic Policy Institute.
García, Emma, and Elaine Weiss. 2016. Making Whole-Child Education the Norm: How Research and Policy Initiatives Can Make Social and Emotional Skills a Focal Point of Children’s Education. Economic Policy Institute.
García, Emma, and Elaine Weiss. 2017. Key Findings from the Report “Education Inequalities at the School Starting Gate”. Economic Policy Institute.
Hart, Betty, and Todd R. Risley. 1995. Meaningful Differences in the Everyday Experience of Young American Children. Baltimore, Md.: Brookes.
Heckman, James J. 2008. “Schools, Skills, and Synapses.” Economic Inquiry vol. 46, no. 3, 289–324.
Heckman, James J., and Tim Kautz. 2012. “Hard Evidence on Soft Skills.” Labour Economics vol. 19, no. 4, 451–64.
Henderson, Anne T. 2010. Community Organizing to Build Partnerships in Schools: The Alliance Schools Movement in Austin. Annenberg Institute for School Reform.
Hernandez, Donald J. 2011. Double Jeopardy: How Third-Grade Reading Skills and Poverty Influence High School Graduation. Annie E. Casey Foundation.
Gizriel, Sarah. 2016. “Bright Futures Looking to Expand to Schools across Shenandoah Valley.” localDVM.com, December 9.
Jennings, J.L., and T.A. DiPrete. 2010. “Teacher Effects on Social and Behavioral Skills in Early Elementary School.” Sociology of Education vol. 83, no. 2, 135.
Kalamazoo Public Schools (KPS). 2017. “PEEP Information and Applications” (webpage). Accessed August 31, 2017.
Lee, Valerie E., and David T. Burkam. 2002. Inequality at the Starting Gate. Washington, D.C.: Economic Policy Institute.
Levin, Henry M. 2012a. “More Than Just Test Scores.” Prospects vol. 42, no. 3, 269–84.
Levin, Henry M. 2012b. “The Utility and Need for Incorporating Noncognitive Skills into Large-scale Educational Assessments.” In The Role of International Large-Scale Assessments: Perspectives from Technology, Economy, and Educational Research, Matthias von Davier et al., eds. Springer.
Magnuson, Katherine, and Greg J. Duncan. 2016. “Can Early Childhood Interventions Decrease Inequality of Economic Opportunity?” RSF: The Russell Sage Foundation Journal of the Social Sciences vol. 2, no. 2, 123–41.
Magnuson, Katherine A., M.K. Meyers, C.J. Ruhm, and Jane Waldfogel. 2004. “Inequality in Preschool Education and School Readiness.” American Educational Research Journal vol. 41, no. 1, 115–57.
Magnuson, Katherine A., Christopher Ruhm, and Jane Waldfogel. 2007. “Does Prekindergarten Improve School Preparation and Performance?” Economics of Education Review vol. 26, no. 1, 33–51.
Marietta, Geoff. 2010. Lessons for PreK-3rd from Montgomery County Public Schools: An FCD Case Study. Foundation for Child Development.
Maryland State Department of Education. 2017. “Judy Centers” (webpage). Accessed August 31, 2017.
Miller-Adams, Michelle. 2015. Promise Nation: Transforming Communities through Place-Based Scholarships. Kalamazoo, Mich.: W.E. Upjohn Institute for Employment Research.
Mishel, Lawrence. 2015. “The Opportunity Dodge.” American Prospect, April 9.
Mishel, Lawrence, Josh Bivens, Elise Gould, and Heidi Shierholz. 2012. The State of Working America, 12th Edition, An Economic Policy Institute Book. Ithaca, N.Y.: Cornell Univ. Press.
Mishel, Lawrence, and Jessica Schieder. 2016. Stock Market Headwinds Meant Less Generous Year for Some CEOs. Economic Policy Institute.
Montgomery County Public Schools (MCPS). 2015. Graduation Rate Rises, Gap Narrows for MCPS Class of 2014 (public announcement). January 27.
Montgomery County Public Schools (MCPS). 2016. Linkages to Learning (brochure).
Montgomery County Public Schools (MCPS). 2017. “Maryland Meals for Achievement” (webpage). Accessed August 31, 2017.
Morsy, Leila, and Richard Rothstein. 2015. Five Social Disadvantages That Depress Student Performance: Why Schools Alone Can’t Close Achievement Gaps. Economic Policy Institute.
Murnane, Richard J., and Frank Levy. 1996. Teaching the New Basic Skills: Principles for Educating Children to Thrive in a Changing Economy. New York: The Free Press.
Murnane, Richard J., John B. Willett, Kristen L. Bub, and Kathleen McCartney. 2006. “Understanding Trends in the Black-White Achievement Gaps during the First Years of School.” Brookings-Wharton Papers on Urban Affairs.
Najarian, M., K. Tourangeau, C. Nord, K. Wallner-Allen, and J. Leggitt. Forthcoming. Early Childhood Longitudinal Study, Kindergarten Class of 2010–11 (ECLS-K:2011), First-Grade and Second-Grade Psychometric Report. Washington, D.C.: National Center for Education Statistics, Institute of Education Sciences, U.S. Department of Education.
National Center for Education Statistics (NCES) (U.S. Department of Education). Early Childhood Longitudinal Study, Kindergarten Class of 1998–99 (ECLS-K 1998–1999).
National Center for Education Statistics (NCES) (U.S. Department of Education). Early Childhood Longitudinal Study, Kindergarten Class of 2010–11 (ECLS-K 2010–2011).
National Institute for Early Education Research (NIEER). 2016. The State of Preschool 2015: State Preschool Yearbook.
New York Times/CBS News. 2015. “Americans’ Views on Income Inequality and Workers’ Rights” (poll results). June 3.
Nores, Milagros, and W. Steven Barnett. 2010. “Benefits of Early Childhood Interventions across the World: (Under) Investing in the Very Young.” Economics of Education Review vol. 29, no. 2, 271–82.
Nores, Milagros, and W. Steven Barnett. 2014. Access to High Quality Early Care and Education: Readiness and Opportunity Gaps in America. New Brunswick, N.J.: Center on Enhancing Early Learning Outcomes.
Nores, Milagros, and Emma García. 2014. “Language, Immigration and Hispanics. Understanding Achievement Gaps in the Early Years.” Paper presented at the Association for Public Policy Analysis and Management Fall Research Conference, November 6–8, Albuquerque, N.M.
Oakes, Jeannie, Anna Maier, and Julia Daniel. 2017. Community Schools: An Evidence-Based Strategy for Equitable School Improvement, Learning Policy Institute, June 5.
PBS NewsHour. 2015. “In Reforming New Orleans, Have Charter Schools Left Some Students Out?” (news segment).
Peterson, T.K., ed. 2013. Expanding Minds and Opportunities: Leveraging the Power of Afterschool and Summer Learning for Student Success. Washington, D.C.: Collaborative Communications Group.
Phillips, Meredith. 2011. “Parenting, Time Use, and Disparities in Academic Outcomes.” In Whither Opportunity?: Rising Inequality, Schools, and Children’s Life Chances, Greg J. Duncan and Richard Murnane, eds. New York: Russell Sage Foundation.
Proctor, Bernadette D., Jessica L. Semega, and Melissa A. Kollar. 2016. Income and Poverty in the United States: 2015. U.S. Census Bureau, Current Population Reports, P60-256(RV).
Putnam, Robert. 2015. Our Kids: The American Dream in Crisis. New York: Simon and Schuster.
Ready, Douglas D. 2010. “Socioeconomic Disadvantage, School Attendance, and Early Cognitive Development.” Sociology of Education vol. 83, no. 4, 271–86.
Reardon, Sean F. 2007. “Thirteen Ways of Looking at the Black-White Test Score Gap.” Working paper.
Reardon, Sean F. 2011. “The Widening Academic Achievement Gap between the Rich and the Poor: New Evidence and Possible Explanations.” In Whither Opportunity?: Rising Inequality, Schools, and Children’s Life Chances, Greg J. Duncan and Richard Murnane, eds. New York: Russell Sage Foundation.
Reardon, Sean F., and Ximena A. Portilla. 2016. “Recent Trends in Income, Racial, and Ethnic School Readiness Gaps at Kindergarten Entry.” AERA Open vol. 2, no. 3, 1–18. doi: 10.1177/2332858416657343.
Redd, Z., L. Guzman, L. Lippman, L. Scott, and G. Matthews. 2004. Parental Expectations for Children’s Educational Attainment: A Review of the Literature. Prepared by Child Trends for the National Center for Education Statistics.
Rolnick, Art, and Rob Grunewald. 2003. “Early Childhood Development: Economic Development with a High Public Return.” The Region vol. 17, no. 4, 6–12.
Rothstein, Richard. 2004. Class and Schools: Using Social, Economic, and Educational Reform to Close the Achievement Gap. Washington, D.C.: Economic Policy Institute; New York: Columbia University Teachers College.
Rothstein, Richard. 2010. “Family Environment in the Production of Schooling.” In International Encyclopedia of Education, Dominic J. Brewer, Patrick J. McEwan, eds. Oxford: Elsevier. doi: 10.1016/B978-0-08-044894-7.01233-1.
Saez, Emmanuel. 2016. Striking It Richer: The Evolution of Top Incomes in the United States (Updated with 2015 Preliminary Estimates).
Schanzenbach, Diane, Megan Mumford, Ryan Nunn, and Lauren Bauer. 2016. Money Lightens the Load. The Hamilton Project, Brookings Institute.
Selzer, Michael H., Ken A. Frank, and Anthony S. Bryk. 1994. “The Metric Matters: The Sensitivity of Conclusions about Growth in Student Achievement to Choice of Metric.” Educational Evaluation and Policy Analysis vol. 16, 41–49.
Sharkey, Patrick. 2013. Stuck in Place: Urban Neighborhoods and the End of Progress toward Racial Equality. Chicago, Ill.: Univ. of Chicago Press.
Simon, Stephanie. 2013. “Class Struggle: How Charter Schools Get Students They Want.” Reuters, February 15.
Simpkins, Sandra D., Pamela E. Davis-Kean, and Jacquelynne S. Eccles. 2005. “Parents’ Socializing Behavior and Children’s Participation in Math, Science, and Computer Out-of-School Activities.” Applied Developmental Science vol. 9, no. 1, 14–30. doi:10.1207/s1532480xads0901_3.
Southern Education Foundation. 2015. A New Majority: Low-Income Students Now a Majority in the Nation’s Public Schools. January.
Sparks, Sarah D. 2017. “Billions in School Improvement Spending but Not Much Student Improvement.” EdWeek, January 19.
StataCorp. 2015. Stata: Release 14 [statistical software]. College Station, Texas: StataCorp LP.
Stringhini, Silvia, et al. 2017. “Socioeconomic Status and the 25×25 Risk Factors as Determinants of Premature Mortality: A Multicohort Study and Meta-Analysis of 1.7 Million Men and Women.” The Lancet. Published online January 31, 2017. doi:10.1016/S0140-6736(16)32380-7.
Tourangeau, K., C. Nord, T. Lê, A.G. Sorongon, and M. Najarian. 2009. Early Childhood Longitudinal Study, Kindergarten Class of 1998–99 (ECLS-K): Combined User’s Manual for the ECLS-K Eighth-Grade and K–8 Full Sample Data Files and Electronic Codebooks (NCES 2009-004). U.S. Department of Education. Washington, D.C.: National Center for Education Statistics.
Tourangeau, K., C. Nord, T. Lê, A.G. Sorongon, M.C. Hagedorn, P. Daly, and M. Najarian. 2013. Childhood Longitudinal Study, Kindergarten Class of 2010–11 (ECLS-K:2011), User’s Manual for the ECLS-K:2011 Kindergarten Data File and Electronic Codebook (NCES 2013-061). U.S. Department of Education. Washington, D.C.: National Center for Education Statistics.
Tourangeau, K., C. Nord, T. Lê, K. Wallner-Allen, M.C. Hagedorn, J. Leggitt, and M. Najarian. 2015. Early Childhood Longitudinal Study, Kindergarten Class of 2010–11 (ECLS-K:2011), User’s Manual for the ECLS-K:2011 Kindergarten–First Grade Data File and Electronic Codebook, Public Version (NCES 2015-078). U.S. Department of Education. Washington, D.C.: National Center for Education Statistics.
Tourangeau, K., C. Nord, T. Lê, K. Wallner-Allen, N. Vaden-Kiernan, L. Blaker, and M. Najarian. 2017. Early Childhood Longitudinal Study, Kindergarten Class of 2010–11 (ECLS-K:2011) User’s Manual for the ECLS-K:2011 Kindergarten–Second Grade Data File and Electronic Codebook, Public Version (NCES 2017-285). U.S. Department of Education. Washington, D.C.: National Center for Education Statistics.
U.S. Department of Education (U.S. ED). 2015. A Matter of Equity: Preschool in America.
U.S. Department of Health and Human Services (U.S. HHS) and U.S. Department of Education (U.S. ED). 2016. Policy Statement to Support the Alignment of Health and Early Learning Systems.
Van Voorhis, F.L., M.F. Maier, J.L. Epstein, C.M. Lloyd, and T. Leung. 2013. The Impact of Family Involvement on the Education of Children Ages 3 to 8: A Focus on Literacy and Math Achievement Outcomes and Social-Emotional Skills. MDRC.
Waldfogel, Jane. 2006. “What Do Children Need?” Public Policy Research vol. 13, no. 1, 26–34.
Weiss, Elaine. 2016a. Bright Futures in Joplin, Missouri. A Broader, Bolder Approach to Education.
Weiss, Elaine. 2016b. Vancouver Public Schools (Vancouver, WA). A Broader, Bolder Approach to Education.
Weiss, Elaine. 2016c. Partners for Education at Berea College, Berea, Kentucky. A Broader, Bolder Approach to Education.
Weiss, Elaine. 2016d. Northside Achievement Zone (North Minneapolis, MN). A Broader, Bolder Approach to Education.
Weiss, Elaine. 2016e. East Durham Children’s Initiative (East Durham, NC). A Broader, Bolder Approach to Education.
Weiss, Elaine. 2016f. Bright Futures (Pea Ridge, AR). A Broader, Bolder Approach to Education.
Weiss, Elaine. 2016g. City Connects (Boston, MA). A Broader, Bolder Approach to Education.
Weiss, Elaine. 2016h. The Children’s Aid Society Community Schools (New York, NY). A Broader, Bolder Approach to Education.
Weiss, Elaine. 2016i. A Broader, Bolder Education Policy Framework. A Broader, Bolder Approach to Education.
Wentzel, Kathryn R., Shannon Russell, and Sandra Baker. 2016. “Emotional Support and Expectations from Parents, Teachers, and Peers Predict Adolescent Competence at School.” Journal of Educational Psychology vol. 108, no. 2, 242–255.
Yamamoto, Yoko, and Susan D. Holloway. 2010. “Parental Expectations and Children’s Academic Performance in Sociocultural Context.” Educational Psychology Review vol. 22, no. 3, 189–214. doi:10.1007/s10648-010-9121-z.
Appendices
Appendix A. Data
Introduction
Our research benefits from the existence of two companion studies conducted by the National Center for Education Statistics (NCES), the Early Childhood Longitudinal Study of the Kindergarten Class of 1998–1999 and the Early Childhood Longitudinal Study of the Kindergarten Class of 2010–2011 (hereafter, ECLS-K 1998–1999 and ECLS-K 2010–2011). The data from these studies come with multiple advantages and a few disadvantages.
The studies follow two nationally representative samples of children starting in their kindergarten year and continuing through their elementary school years (eighth grade for 1998–1999 cohort and fifth grade for the 2010–2011 cohort). The tracking of students over time is one of the most valuable features of the data. The studies include assessments of the children’s cognitive performance and knowledge as well as skills that belong in the category of noncognitive, or social and emotional, skills. The studies also include information on teachers and schools (provided by teachers and administrators) and interviews with parents.
Another valuable feature of the data is the availability of two ECLS-K studies (ECLS-K 1998–1999 and ECLS-K 2010–2011), which allows for cross-comparisons “of two nationally representative kindergarten classes experiencing different policy, educational, and demographic environments” (Tourangeau et al. 2013). The two studies are 12 years apart, or a full school cycle apart: when the 2010–2011 kindergarten class was starting school, the 1998–1999 class was starting the grade leading to their graduation. A comparison of the studies thus offers insightful information about the consequences of changes in the system that may have occurred during an entire cohort’s school life. For the 2010 study, the sample included 18,174 children in 968 schools.i The 1998 study sample included 21,409 children in 903 schools.ii
This existence of data from two cohorts is also a limitation to the current study, as explained by Tourangeau et al. (2013), who note that the assessment scores for the 2010–2011 class are not directly comparable with those developed for the class of 1998–1999. Although the IRT (Item Response Theory) procedures used in the analysis of data were similar across the two studies, each study incorporated different items, which means that the resulting scales are different. Tourangeau et al. (2013) state that “a subsequent release of the ECLS-K: 2010–2011 data will include IRT scores that are comparable with the ECLS-K 1998 cohort.” Up to the point of publication of the current study, this information had not yet been released, and we use standardized scores, instead of raw scores, for the outcomes examined. We can assess changes in the relative position in a distribution (i.e., how far apart high- and low-SES children are in 1998 and how far apart high- and low-SES children are in 2010), but not overall changes in their performance (i.e., it is not possible to ascertain whether performance has improved overall, or if gaps are smaller or larger due to an improvement in performance of children at the low end (specifically the lowest fifth) of the distribution or due to a decrease in the performance of children at the high end (highest fifth) of the distribution, etc.). A full comparison remains to be produced, upon data availability.
We use data for the first wave of each study, corresponding with fall kindergarten (or school entry).
Outcomes
For the analyses, we use the by-year standardized scores corresponding to the fall semester. (The 1998 IRT scale scores for reading and mathematics achievement and assessments of noncognitive skills are standardized using the 1998 distribution and its mean and sd; for 2010, we use the mean and sd of the 2010 distribution.)
Cognitive skills
Cognitive skills are assessed with instruments that measure each child’s:
- Reading skills: print familiarity, letter recognition, beginning and ending sounds, rhyming words, word recognition, vocabulary knowledge, and reading comprehension
- Math skills: conceptual knowledge, procedural knowledge, and problem-solving; number sense, properties, and operations; measurement; geometry and spatial sense; data analysis, statistics, and probability; and patterns, algebra, and functions
Principal noncognitive skills
We use the term “principal” to identify a set of noncognitive skills that are measured by both the ECLS-K 1998–1999 and 2010–2011 surveys, and that have been relatively extensively used in research.
Teachers are asked to assess each child’s:
- Self-control: ability to control behavior by respecting the property rights of others, controlling temper, accepting peer ideas for group activities, and responding appropriately to pressure from peers
- Approaches to learning: organizational skills (keeps belongings organized); curiosity (is eager to learn new things); independence (works independently); adaptability (easily adapts to changes in routine); persistence in completing tasks; focus (ability to pay attention); and ability to follow classroom rules
Parents are asked to assess their child’s:
- Self-control: ability to control behavior by refraining from fighting, arguing, throwing tantrums, and getting angry
- Approaches to learning: persistence (keeps working at something until finished); curiosity (shows interest in a variety of things); focus (concentrates on a task and ignores distractions); helpfulness (helps with chores); intellectual curiosity (is eager to learn new things); and creativity (in work and play)
Covariates
For the analyses, we use the following set of covariates. The definitions, and the coding used for the covariates, by year, are shown in Appendix Table A1.
Appendix B. Methodology
Gaps by socioeconomic status
The expressions below show the specifications used to estimate the socioeconomic status–based (SES-based) performance gaps. For any achievement outcome A, we estimate four models:
- Model 1 shows the unadjusted (descriptive) differences for children belonging to different racial/ethnic groups or SES quintiles (the reference group is children in the lowest SES quintile, “low SES”).
- Model 2 adjusts for school clustering of students in different schools (i.e., gaps of students in the same schools). The purpose of this clustering is to account for school segregation (i.e., concentration of children of the same race, socioeconomic status, etc., in schools, which causes the raw average performance of students to differ from the adjusted-by-clustering average). It offers a comparison of the gaps shown by peer students in the same schools and classrooms (García 2015; Magnuson and Duncan 2016 offer these estimates as well).
These estimates build on all the available observations (i.e., only those children who have missing values in the outcome variables are eliminated from the analysis).
Because of lack of response in some of the covariates used as predictors of performance, we construct a common sample with observations with no missing information in any of the variables of interest (see information about missing data for each variable in Appendix Table C1). We estimate two more models:iii
- Model 3 shows gaps adjusted for child and family characteristics, prekindergarten care arrangements, number of books the child has, and early literacy practices at homeiv
- Finally, Model 4 shows the fully adjusted differences (adjusted for child and family characteristics, prekindergarten care arrangements, early literacy practices at home, number of books the child has, and parental expectations)
The equation below shows the equation we estimate for Models 1 through 4.

The main parameters of interest are 

- The high-SES versus low-SES gap in 1998 equals


(the coefficients of SES5 and Year2010xSES5). If

is positive and statistically significant, it means that the gap between high- and low-SES children increased during those years. Conversely, if
Appendix C. Sensitivity analysis (I): Multiple imputation
Following standard approaches in this field, we use multiple imputation to impute missing values in both the independent and dependent variables, for the analysis of skills gaps and changes in them from 1998 to 2010 by socioeconomic status (main analysis). See share of missing data by variable in Appendix Table C1. We use the mi commands in Stata 14, using chained equations, which jointly model all functional terms. The number of iterations was set up equal to 20. Imputation is performed by year.
Our functional form of the imputation model is specified using SES, gender, race, disability, age, type of family, number of books, educational activities, and parental expectations, as well as the original cognitive and noncognitive variables, as variables to be imputed. We use various specifications, combining different sets of auxiliary variables, mi impute methods, and other parameters, to capture any sensitivity of the results to the characteristics of the model. For example, income, family size, and ELL status are set as auxiliary variables and used in several of the imputation models. Another imputation option that was altered across models is the use of weights, as we ran out of imputation models using weights and not using them.
In the imputation model, in order to impute categorical variables’ missingness, we use the option augment, to prevent the large number of categorical variables to be imputed from causing problems of perfect prediction (StataCorp. 2015). The rest of the variables are first imputed as continuous variables. In a second exercise, we also impute SES and educational expectations as ordinal variables (also using the option augment).
In order to calculate the standardized dependent variables, we use the variables derived from the imputation variables (also known as passive imputation). This “fills in only the underlying imputation variables and computes the respective functional terms from the imputed variables” (StataCorp. 2015). In one case, we imputed the dependent variables directly as continuous variables (though we anticipated that the distribution of the scores imputed this way would not necessarily have a mean of 0 and a standard deviation of 1).
Using the imputed data, we estimate Models 1 through 4 following the specifications explained above (from no regressors to fully specified models).
The main findings of our analysis are not sensitive to missing data imputation. The estimates of the gaps in 1998 and the changes in the gaps from 1998 to 2010 are consistent across models in terms of statistical significance. There are some minor changes in the sizes of the estimated coefficients, especially those associated with the changes in the gaps (though all are statistically not different from 0, as discussed in the report using the results from the analysis with the complete cases). There are also some minor changes in the standard errors, though they are small enough to widen the coefficients’ statistical bandwidth to not include the 0.
Appendix D. Sensitivity analysis (II): The different scores available in ECLS-K and the sensitivity of the results to changing them
Children’s reading and mathematics skills are measured using several different metrics in ECLS-K. Among these, the best-known or more commonly used metrics in research are the IRT-based theta scores and the IRT-based scale scores (IRT stands for Item Response Theory). NCES provides data users with definitions of these metrics and recommendations on how to appropriately choose among the different metrics. NCES explains that both theta and IRT-based scale scores are valid indicators of ability. This makes them suitable for research purposes, even though each is expressed in its own unit of measurement. NCES recommends that analysts “consider the nature of their research questions, the type of statistical analysis to be conducted, the population of interest, and the audience” when choosing the appropriate score for analysis (see Tourangeau et al. 2013).
Although nothing would indicate that this could be the case, our work noted that results of analyses such as the one developed in this study are in some ways sensitive to the metrics used as dependent variables.v Thus, the purpose of this appendix is to illustrate the differences in the results associated with different analytic decisions in terms of the metrics used. As we will see, in essence, point estimates depend on the metric used, but the results do not change in a meaningful way and conclusions and implications remain unchanged. That is, although caution is required when interpreting the results obtained using different combinations of metrics, procedures (including standardization), and data waves, it is important to state that the main conclusions of this study—that social-class gaps in cognitive and noncognitive skills are large and have persisted over time—hold. So do the policy recommendations derived from those findings: sufficient, integrated, and sustained over-time efforts to tackle early gaps in a more effective manner.
The scores: Which one to use and definitions
NCES makes the following recommendations for researchers who are choosing among scales (see Tourangeau et al. 2013):vi
When choosing scores to use in analysis, researchers should consider the nature of their research questions, the type of statistical analysis to be conducted, the population of interest, and the audience. […]
The IRT-based scale scores […] are overall measures of achievement. They are appropriate for both cross-sectional and longitudinal analyses. They are useful in examining differences in overall achievement among subgroups of children in a given data collection round or in different rounds, as well as in analysis looking at correlations between achievement and child, family, and school characteristics.
[…] Results expressed in terms of scale score points, scale score gains, or an average scale score may be more easily interpretable by a wider audience than results based on the theta scores.
The IRT-based theta scores are overall measures of ability. They are appropriate for both cross-sectional and longitudinal analyses. They are useful in examining differences in overall achievement among subgroups of children in a given data collection round or across rounds, as well as in analysis looking at correlations between achievement and child, family, and school characteristics.
[…] The theta scores may be more desirable than the scale scores for use in a multivariate analysis because generally their distribution tends to be more normal than the distribution of the scale scores. However, for a broader audience of readers unfamiliar with IRT modeling techniques, the metric of the theta scores (from -6 to 6) may be less readily interpretable. […]
The two scores are defined as follows (see Tourangeau et al. 2013, section “3.1 Direct Cognitive Assessment: Reading, Mathematics, Science”):
The IRT-based scale score is an estimate of the number of items a child would have answered correctly in each data collection round if he or she had been administered all of the questions for that domain that were included in the kindergarten and first-grade assessments.
To calculate the IRT-based overall scale score for each domain, a child’s theta is used to predict a probability for each assessment item that the child would have gotten that item correct. Then, the probabilities for all the items fielded as part of the domain in every round are summed to create the overall scale score. Because the computed scale scores are sums of probabilities, the scores are not integers.
The IRT-based theta score is an estimate of a child’s ability in a particular domain (e.g., reading, mathematics, science, or SERS) based on his or her performance on the items he or she was actually administered. […]
The theta scores are reported on a metric ranging from -6 to 6, with lower scores indicating lower ability and higher scores indicating higher ability. Theta scores tend to be normally distributed because they represent a child’s latent ability and are not dependent on the difficulty of the items included within a specific test.
Reardon (2007) describes the calculation of the theta scores in the following manner:vii
For each test [math and reading], a three-parameter IRT model was used to estimate each student’s latent ability…at each wave…. The IRT model assumes that each student’s probability of answering a given test item correctly is a function of the student’s ability and the characteristics [discrimination, difficulty, and guessability] of the item…. Given the pattern of students’ responses to the items on the test that they are given, the IRT model provides estimates of both the person-specific latent abilities at each wave… and the item parameters. (Reardon 2007, 10)viii
He also notes that “[b]ecause the ECLS-K tests contain many more ‘difficult’ items than ‘easy’ items, the relationship between theta and scale scores is not linear (a unit difference in theta corresponds to a larger difference in scale scores at theta=1 than at theta=-1, for example). The scale scores are difficult to interpret as an interval-scale metric (or are an interval-scaled metric only with respect to the specific set of items on the ECLS-K tests),” while he shows that the “theta scores are interval-scale metrics, in a behaviorally-meaningful sense” (Reardon 2007, 11, 13).ix
The analyses
For the analyses, both the scale and the theta scores need to be standardized by year (the original variables are not directly comparable because they rely on different instruments, as explained by NCES, and the resulting standardized variables have mean 0 and standard deviation 1). This is a common practice in the education field, as it allows researchers to use data that come from different studies and would not have a common scale otherwise. We need to take into consideration that the underlying units of measurement for each variable are different, but after standardization, the metrics are common, expressed in standard deviations and represent the population’s distribution of abilities.
The distributions of the scale and theta scores are shown in Appendix Figures D1 and D2. In each figure, the plots reflect a more normally distributed pattern for the theta scores (right panel) than for the scale scores (left panel). The companion table, Appendix Table D1, shows the range of variation for the four outcomes (mean and standard deviations are 0 and 1 as per construction).
We next offer a comparison of the results obtained when using the scale scores versus using the theta scores (Appendix Table D2). We highlight the following main similarities and differences between the results obtained using the scale scores and the results using the theta scores.
- Gaps are all equally statistically significant and persistent.
- Estimated gaps are larger if you use the theta scores than if you use the scale scores.
- For example, looking at the unadjusted estimates in reading, the gap in 1998 between high- and low-SES children is 1.071 sd if using the scale scores and 1.233 sd if using the theta scores. In math, the gap between high- and low-SES children in 1998 is 1.258 sd if using the scale scores and 1.330 sd if using the theta scores.
- Looking at the adjusted estimates in reading, the 1998 gap between high- and low-SES children is 0.596 sd if using the scale scores and 0.684 sd if using the theta scores. In math, the gap between high- and low-SES children is 0.610 sd if using the scale scores and 0.632 sd if using the theta scores.
- The trends in gaps (i.e., whether the gaps increased or decreased between 1998 and 2010) do differ depending on whether you use one dependent variable or the other. This sometimes affects the point estimate’s size and even sign, although the sizes of these coefficients are very small (i.e., indicating that gaps haven’t really changed over time).
- For example, looking at the unadjusted estimates in reading, the change in the gap between 1998 and 2010 for high- and low-SES children is 0.098 sd if using the scale scores and -0.052 sd (not statistically significant) if using the theta scores. In math, the change in the gap between high- and low-SES children is -0.008 sd (not statistically significant) if using the scale scores and -0.078 sd if using the theta scores.
In Appendix Table D3, we compare the results obtained using the different scales and the different proxies of socioeconomic status (our composite SES index, mother’s education, number of books, and household income).
- Gaps are larger, as mentioned above, when we use the theta scores than when we use the scale scores.
- Among the four social-class proxies, the largest gaps are associated with mother’s education, and the smallest gaps are associated with number of books. All are statistically significant.
- Looking at the unadjusted gaps, we note that trends are the same (and similar in size) if income is used as the proxy. For mother’s education, the change in the gap between 1998 and 2010 is -0.020 sd in reading (not statistically significant) and -0.154 sd in math if using the scale scores and -0.135 sd in reading and -0.218 sd in math if using the theta scores.
- With respect to the adjusted gaps, changes in the gaps are larger when using the theta scores both for household income and mother’s education as indicators of social class. Using the theta scores, the gaps in reading and math shrank over time, while using the scale scores, the only significant reduction was in math when mother’s education was the social class proxy.
Other considerations
There are two other significant pieces of information affecting the cognitive scores in more recent documentation released by NCES. In 2015, NCES announced in its ECLS-K User’s Manual that a
change in methodology required a re-calibration and re-reporting of the kindergarten reading scores since the release of the base-year file. Therefore, the kindergarten reading theta scores included in the K-1 data file are calculated differently than the previously released kindergarten theta scores and replace the kindergarten reading theta scores included in the base-year data file. The modeling approach stayed the same for mathematics and science, so the recalculation of kindergarten mathematics and science theta scores was not needed. (Tourangeau et al. 2015)
Following up on this, the most recent (2017) data user’s manual explains that
The method used to compute the theta scores allows for the calculation of theta for a given round that will not change based on later administrations of the assessments (which is not true for the scale scores, as described in the next section). Therefore, for any given child, the kindergarten, first-grade, and second-grade theta scores provided in subsequent data files will be the same as theta scores released in earlier data files, with one exception: the reading thetas provided in the base-year data file. After the kindergarten-year data collection, the methodology used to calibrate and compute reading scores changed; therefore, the reading thetas reported in the base-year file are not the same as the kindergarten reading thetas provided in the files with later-round data [emphasis added]. Any analysis involving kindergarten reading theta scores and reading theta scores from later rounds, for example an analysis looking at growth in reading knowledge and skills between the spring of kindergarten and the spring of first grade, should use the kindergarten reading theta scores from a data file released after the base year. The reading theta scores released in the kindergarten-year data file are appropriate for analyses involving only the kindergarten round data; analyses conducted with only data released in the base-year file are not incorrect, since those analyses do not compare kindergarten scores to scores in later rounds that were computed differently. However, now that the recomputed kindergarten theta scores are available in the kindergarten through first-grade and kindergarten through second-grade data files, it is recommended that researchers conduct any new analyses with the recomputed kindergarten reading theta scores. For more information on the methods used to calculate theta scores, see the ECLS-K: 2011 First-Grade and Second-Grade Psychometric Report (Najarian et al. forthcoming). (Tourangeau et al. 2017)
Therefore, because of these changes in NCES methodology and reporting, and in light of the comparisons in this appendix, one could expect additional slight changes in the estimates using the IRT-theta scores for reading for kindergarten if using rounds of data posterior to the first round (and probably if using the IRT-scale scores as well, as these values are derived from the theta scores), relative to the first data file of ECLS-K: 2010-2011 released by NCES in 2013. We would not necessarily expect, though, any changes when using the standardized transformation of those scores, because NCES’s documentation does not mention changes to the distribution of the scores, only to their values. We will explore these issues further upon the release of the scores that are comparable across the two ECLS-K studies without any transformation.
Appendix E. Descriptions of 12 community-level whole-child education initiatives
Initiatives that serve part of a school district
Austin, Texas
The needs of children in Austin Independent School District (AISD) schools with the highest concentrations of poor, immigrant, and non-English-speaking families are supported through a combination of parent-organizing (schools with parent-organizing programs, led by the nonprofit Austin Interfaith, form a network of “Alliance Schools”), intensive embedding of social and emotional learning (SEL) in all aspects of school policy and practice, and the transformation of schools into “community schools” (i.e., schools that are hubs for the provision of academic, health, and social services).
- Organizing partners: Austin Interfaith (a nonprofit of congregations, public schools, and unions that is part of the national Industrial Areas Foundation [IAF]); the Collaborative for Academic, Social and Emotional Learning (CASEL); the American Federation of Teachers (AFT); and the National Education Association (NEA).
- Schools and students reached: The IAF/Alliance Schools network extended at its zenith into one-fourth of AISD elementary schools and one-half of AISD high-poverty elementary schools. CASEL worked in five high schools, and in the seven middle schools and 43 elementary schools that feed into these high schools, to embed social and emotional learning in school policies and practices. A middle school and a high school have been transformed into community schools and serve as the models for planned districtwide expansion of the “community schools” strategy into all AISD schools.
- General makeup of the student body: In the district overall, 60 percent of students qualify for subsidized meals, i.e., are eligible for free or reduced-price lunch (FRPL); 28 percent are English language learners (ELL); and 10 percent are special education students. In schools targeted for whole-child supports, relative to the general student body, students are poorer, more heavily minority and immigrant, and more likely to be living in single-parent households.
- Key features: Parent-organizing with teachers in Alliance Schools enables parents to partner with teachers to advocate for comprehensive supports for their children. Also, social and emotional learning (SEL) is embedded in all aspects of school efforts in the high schools and the feeder elementary and middle schools that worked with CASEL. Finally, health and other wraparound supports in high-needs middle and high schools, along with other community schools features, are expanding to additional district schools.
- Core funding: The district received a CASEL grant to embed social and emotional learning in school policies and practices, and also received in-kind support from the NoVo Foundation in the form of technical assistance. The United Way of Greater Austin provides funds for wraparound support, and AFT and NEA fund community schools work and expansion.
Boston, Massachusetts
The City Connects program provides targeted academic, social, emotional, and health supports to every child in 20 of the city’s schools with the highest shares of low-income, black, Hispanic, and immigrant students.
- Organizing partners: Boston College Center for Optimized Student Support, Boston Public Schools (BPS), and community agencies.
- Schools and students reached: The 20 BPS schools in the program serve more than 8,000 of the city’s most disadvantaged students (out of 125 BPS schools and 56,000 students).
- General makeup of the student body: The 20 urban schools serve neighborhoods that are poor and racially and ethnically diverse, with a heavy concentration of Hispanic English-language learners. Over 80 percent of the students in these schools are FRPL-eligible and roughly half do not speak English at home.
- Key features: School site coordinators in each school connect students with a tailored set of services and enrichment opportunities provided by a variety of public and private agencies. Universal state health care supports all students’ physical and mental health needs, and the city’s Universal Pre-Kindergarten (UPK) program now offers quality pre-K for all four-year-olds in Boston.
- Core funding: In addition to school district budget revenue, federal Race to the Top funds allocated to City Connects help defray costs. Several private foundations support various aspects of City Connects’ work.
Durham, North Carolina
The East Durham Children’s Initiative (EDCI) concentrates services and supports for the children and their families living in a 120-block, heavily distressed area of concentrated poverty and high crime within the city.
- Organizing partners: Community leaders launched EDCI and engaged the Duke University Center for Child and Family Health to grow capacity. EDCI is now a fully staffed nonprofit that runs the initiative.
- Schools and students reached: The 120-block area targeted by EDCI serves students in two neighborhood elementary schools, one middle school, one high school, and two charter schools.
- General makeup of the student body: The 120-block area is urban and poor with a predominantly black but very diverse student body. In Durham schools overall, 66 percent of students are FRPL-eligible, nearly half are black, almost one-third are Hispanic, and 18 percent are white.
- Key features: EDCI is a place-based initiative modeled on the Harlem Children’s Zone, providing a pipeline of high-quality cradle-to-college-or-career services. These include early childhood supports (that complement state pre-K programs), health and mental health services, and after-school and summer enrichment activities.
- Core funding: EDCI has an annual fund receiving contributions from individuals, corporations, fundraising events, and private foundations; it neither seeks nor receives public funding.
Minneapolis, Minnesota
The Northside Achievement Zone (NAZ) is a Promise Neighborhood, a designation awarded by the U.S. Department of Education Promise Neighborhoods program to some of the most distressed neighborhoods in the nation. Through the program, children and families who live in the 13-by-18 block NAZ receive individualized supports.
- Organizing partners: NAZ, the Promise Neighborhood grantee organization, is guided by a 20-member board of directors consisting of local leaders.
- Schools and students reached: The 13-by-18 block zone in North Minneapolis serves 5,500 students in 10 public, charter, and parochial K–12 schools, including one high school.
- General makeup of the student body: In this racially concentrated area of poverty, almost all residents are African American, and median family income is $18,000. One-third of children are homeless or “highly mobile” (not technically homeless but without stable housing).
- Key features: “Connectors” are in essence case managers who help families develop achievement plans, and “Navigators” connect families with community resources to move toward goals. The zone offers access to high-quality pre-K and parenting supports, as well as mentoring, enrichment, college preparatory support, and after-school and summer programs.
- Core funding: NAZ is anchored by a federal Promise Neighborhood grant. NAZ also receives private grants and is able to leverage federal Race to the Top Early Learning Challenge funds to support pre-K scholarship slots.
New York, New York
Through a collaboration between The Children’s Aid Society and the New York City Department of Education, 16 community schools in some of the most disadvantaged neighborhoods in three of the city’s five boroughs provide wraparound health, nutrition, mental health, and other services to students along with enriching in-and-out-of-school experiences, amplified by extensive parental and community engagement.
- Organizing partners: The Children’s Aid Society, the New York City Department of Education, the New York State Education Department, and other local and state agencies.
- Schools and students reached: Sixteen community schools in three boroughs serve some of the poorest immigrant and minority students in a school system of roughly one million students.
- General makeup of the student body: Students in Children’s Aid Society community schools are disadvantaged relative to the system overall, which serves a heavily low-income and minority student body: more than three quarters of New York City public school students are FRPL-eligible, 13 percent are English language learners, and nearly one in five receive special education services. These schools also have high concentrations of students of color: 27 percent are African American and 41 percent are Hispanic.
- Key features: Close coordination with local and state education, health, and other agencies along with community partnerships at each school enables wraparound health, mental health, and after-school and summer enrichment, as well as deep parental and community engagement.
- Core funding: A range of public dollars, including federal Elementary and Secondary Education Act (ESEA) Title I funds and funds from the federal 21st Century Community Learning Centers program, together with state and local funding for after-school and other programs, is supplemented by funds from individuals and foundations.
Orange County, Florida
The Tangelo Park Project (TPP) provides cradle-to-college support for all children residing in Orlando’s high-poverty, heavily African American Tangelo Park neighborhood.
- Organizing partners: The Tangelo Park Program board, along with Harris Rosen (the hotelier who envisioned and funds the program), work in close collaboration with the Tangelo Park Civic Association and the University of Central Florida.
- Schools and students reached: The program serves all children in the Tangelo Park neighborhood.
- General makeup of the student body: Virtually all residents in the low-income neighborhood are African American or Afro-Caribbean.
- Key features: Universal college scholarships—called “Promise” scholarships because they are guaranteed by an established fund—are supported by quality neighborhood-based early childhood education, health, counseling, and after-school and summer programs.
- Core funding: Harris Rosen funds early child care providers and universal college scholarships. Rosen also supports other services, such as a lifeguard at the YMCA, as needed.
Initiatives that serve all of a school district
Joplin, Missouri
Joplin’s Bright Futures initiative (which has spawned dozens of other Bright Futures affiliate districts under a Bright Futures USA umbrella since it launched in 2010) has a rapid response component that addresses children’s basic needs (within 24 hours of a need being reported), while strong school–community partnerships help meet students’ longer-term needs. Bright Futures also provides meaningful service learning opportunities in every school.
- Organizing partners: The Joplin School District’s superintendent and top leadership, in collaboration with parents and community, faith, business, and social service leaders.
- Schools and students reached: Bright Futures serves all of the district’s 7,874 students in all 17 schools.
- General makeup of the student body: Joplin is a heavily white community. As of 2015, nearly two-thirds (61 percent) of Joplin students are FRPL-eligible and 16 percent are classified as needing special education; just 3 percent are English language learners.
- Key features: The Bright Futures USA framework has three components. First, a rapid response system is designed to meet any student’s basic health, nutrition, or physical need within 24 hours of such a need being reported; this system is supported by combined resources from social service agencies, businesses, faith organizations, and individual community members. Second, school- and community-level councils build community leadership and partnerships with schools to meet longer-term needs and sustain systems. Third, service learning opportunities are embedded in all schools to help develop children as citizens. Teachers lead the service learning and receive training to do so. In addition to these three components, Joplin also provides pre-K for at-risk students, as well as tutoring, mentoring, and after-school and college preparatory programs based on student need.
- Core funding: Federally funded Americorps VISTA volunteers provide in-kind support; funds from the state departments of Elementary and Secondary Education and of Economic Development support Bright Futures work and conferences; and the regional Economic Security Corporation and a range of private funders supplement these federal and state funding sources.
Kalamazoo, Michigan
The “Kalamazoo Promise,” a guarantee by a group of anonymous local philanthropists to provide full college scholarships in perpetuity for graduates of the district’s public high schools brought Kalamazoo Public Schools (KPS), the city, and the community together to develop a set of comprehensive supports that enable more students to use the scholarships.
- Organizing partners: Kalamazoo Promise and Kalamazoo Public Schools, the local school district, in collaboration with Communities in Schools Kalamazoo (CIS) and other nonprofit entities.
- Schools and students reached: All KPS students (12,216 in 25 schools) who graduate from Kalamazoo public high schools are eligible for Promise scholarships. CIS works in all schools but to varying degrees and with varying levels of financial support.
- General makeup of the student body: In this combination urban–suburban district, a large majority of students (over 70 percent) are FRPL-eligible, 12 percent receive special education services, and 7 percent are English language learners. The share of African American students grew from less than one-third in 1987 to over half 30 years later; over this period the share of Hispanic students increased as well.
- Key features: The anchor for comprehensive supports is universal “Promise” college scholarships, which have spurred community leadership to provide quality pre-K programs and wraparound health, mental health, and other supports, and to launch a districtwide effort to create a college-going culture and resources to support that culture.
- Core funding: Anonymous donors have committed to funding Promise scholarships in perpetuity. CIS is supported by a combination of Title I funding, which helps support school coordinators; 21st Century Learning grants for after-school activities; and private individual and philanthropic donations.
Montgomery County, Maryland
All students in Montgomery County Public Schools (MCPS) benefit from zoning laws that advance integration and strong union–district collaboration on an enriching, equity-oriented curriculum. These efforts are bolstered by extra funding and wraparound supports for high-needs schools and communities.
- Organizing partners: MCPS, Montgomery County Education Association (the local teachers union), Montgomery County Council, and Linkages to Learning (a joint initiative of MCPS and the county council that provides an integrated focus on health, social services, community development, and engagement to support student learning, strong families, and healthy communities.)
- Schools and students reached: All 160,000 students in more than 200 schools are served via some services. Higher-poverty schools and their communities receive additional funds and supports that are broader and more intensive. For example, Linkages to Learning serves more than 5,400 individuals—students and their family members—per year at 29 schools. Over 3,700 of them receive comprehensive behavioral health or social wraparound services to mitigate the effects of poverty and reduce nonacademic barriers to learning.
- General makeup of student body: The MCPS school district as a whole is racially and socioeconomically diverse: 30 percent of students are Hispanic, 29 percent are white, 22 percent are African American, 14 percent are Asian, and 35 percent are FRPL-eligible (more than 40 percent of students have been FRPL-eligible at some point). On the poorer, Eastern side of the county, where more intensive whole-child supports are provided, the 10 highest-poverty schools have student bodies that are at least 80 percent FRPL-eligible.
- Key features: Mixed-use housing policies that enable racial and socioeconomic integration advance school-level integration that boosts low-income students’ learning, which the district enhances through various forms of support, including high-quality early childhood education, parent and community outreach, reallocation of funds to high-needs schools and students, nutrition and health services, and an emphasis on social and emotional learning.
- Core funding: MCPS is heavily locally funded, with almost no federal Title I dollars. The district’s whole-child approach draws on a combination of school district and county revenues, along with federal funding for Head Start programs, state pre-K dollars, and assorted other grants.
Pea Ridge, Arkansas
The Pea Ridge School District, a small suburban–rural district outside Fayetteville, Arkansas, is among the newer affiliates of Bright Futures USA, a national umbrella group that grew out of Bright Futures Joplin. As a Bright Futures affiliate, Pea Ridge is making good progress toward identifying and meeting students’ basic needs, engaging the community to meet longer-term needs, and making service learning a core component of school policy and practice.
- Organizing partners: Pea Ridge School District and Bright Futures USA.
- Schools and students reached: Eight hundred and fifty students are served in one primary school, one elementary school, one middle school, and one high school, as well as an alternative high school and a new career-tech charter high school.
- General makeup of the student body: The suburban–rural district is mostly white, with a small but growing Hispanic population, and predominantly middle-income with pockets of both higher-income families and families in poverty.
- Key features: The first component of the three-part Bright Futures USA framework is a rapid response system to meet every student’s basic health, nutrition, and physical needs within 24 hours through a combination of social service agency, business, faith, and individual community contributions. Other components include school- and community-level councils, which build community leadership and partnerships with schools to meet longer-term needs and sustain systems, and service learning embedded in all schools that is enhanced by supportive training for teachers. Pea Ridge also provides pre-K for at-risk students, as well as tutoring, mentoring, and after-school and college preparatory programs for students who need them.
- Core funding: State funds support meals and other needs for high-poverty schools, and Pea Ridge has secured a three-year private grant to support access to pre-K for low-income students.
Vancouver, Washington
Family and Community Resource Centers (FCRCs) currently serve 16 of the highest-needs Vancouver Public Schools (VPS) district schools, with mobile and lighter-touch support in other schools and plans to expand districtwide by 2020.
- Organizing partners: School district leaders coordinate the program with the support of six central-office staff (three of whom just support FCRCs). Technical and other assistance is provided by the Coalition for Community Schools.
- Schools and students reached: FCRCs serve 23,500 students in 16 VPS schools: 11 elementary schools, two middle schools, two high schools, and the Fruit Valley Learning Center (a combination elementary school and community center that also offers child care and Head Start programs). Plans are being made to expand FCRCs to all 35 VPS schools by 2020.
- General makeup of the student body: As of 2015, more than half of students were FRPL-eligible, with FRPL-eligibility rates in some central-city schools exceeding 80 percent. More than one in five students speak a language other than English at home and 12.5 percent of students are special education students; in FCRC schools, the shares of non–English speakers and special education students are even higher.
- Key services: VPS supports a range of early childhood education programs, including quality pre-K; middle and high school in-school enrichment; after-school and summer programs (provided by VPS partners); and help for parents and families through workshops, assistance, and referrals to a range of community resources.
- Core funding: District and Title I funds, which support basic FCRC needs, are supplemented by cash and in-kind donations from faith-based, social service, business, and association partners.
Initiative that serves multiple school districts
Eastern (Appalachian) Kentucky
A federal Promise Neighborhood grant helps Berea College’s Partners for Education provide intensive supports for students and their families in four counties in the Eastern (Appalachian) region of Kentucky and provide lighter-touch supports in an additional 23 surrounding counties. (Berea College, which was established in 1855 by abolitionist education advocates, is unique among U.S. higher-education institutions. It admits only economically disadvantaged, academically promising students, most of whom are the first in their families to obtain postsecondary education, and it charges no tuition, so every student admitted can afford to enroll and graduates debt-free.)
- Organizing partners: Berea College launched Partners for Education (PfE), which is now a fully staffed nonprofit that runs the initiative.
- Schools and students reached: PfE serves 35,000 students in 22 schools in Clay, Jackson, Knox, and Owsley counties; tens of thousands more are served less intensively in an additional 23 counties in the region.
- General makeup of the student body: The Appalachian region is rural, very poor, and heavily white. The regional poverty rate is around 27 percent (in 2015), and reaches as high as 40 percent in some counties. About 80 percent of students are FRPL-eligible and 97 percent are white.
- Key features: Family engagement specialists meet directly with families and help coordinate services provided by a range of community partners. Other specialists provide basic academic, college preparatory, and health and other wraparound services to students.
- Core funding: Federal Promise Neighborhood, Full Service Community Schools, and Investing in Innovation grants are the most prominent sources of funding, but the initiative receives a range of other cash and in-kind supports.
Appendix tables and figures
Covariates from these models: ECLS-K 1998--1999 and 2010--2011
| ECLS-K 1998–1999 | ECLS-K 2010–2011 |
|---|---|
| Socioeconomic status (SES). The SES is a composite variable reflecting the socioeconomic status of the household at the time of data collection. SES was created using components such as father/male guardian’s education and occupation; mother/female guardian’s education and occupation; and household income (see Tourangeau et al. 2009, 7-23–7-30). We use five SES quintiles dummies that are available. We use the following labels in the tables and figures: “Low SES” indicates the first or lowest socioeconomic quintile, “Middle-low SES” indicates the second-lowest quintile, “Middle SES” is the third quintile, “High-middle SES” indicates the fourth quintile, and “High SES” represents the highest or fifth quintile. | Socioeconomic status (SES). The construct is based on three different components (five total variables), including the educational attainment of parents or guardians, occupational prestige (determined by a score), and household income (see more details in Tourangeau et al. 2013, 7-56–7-60). We use the quintile indicators based on the continuous SES variable (we construct them). |
| Child living in poverty. Information about whether the child’s household lives in poverty is obtained from a household-level poverty variable. The household’s income is compared with census poverty thresholds for 2006 (which vary by household size) and the household is considered to be in poverty if total household income is below the poverty threshold determined by the U.S. Census Bureau poverty threshold (Tourangeau et al. 2009, 7-24 and 7-25). | Child living in poverty. Information about whether the child’s household lives in poverty is obtained from a household-level poverty variable. This variable indicates whether the household income is below 200 percent of the U.S. Census Bureau poverty threshold. More details are provided in Tourangeau et al. 2013 (7-53 and 7-54). |
| Gender. A variable indicates whether the student is a girl or a boy. | Gender. A dummy indicator represents whether the child is a boy or a girl. |
| Race/ethnicity. A variable indicates the race/ethnicity of the student—whether the child is white, black, Hispanic, Asian, or another ethnicity. Hispanic children are divided into two groups, those whose families speak English at home and those whose families do not. (This latter decomposition was first described and utilized by Nores and Barnett [2014] and Nores and García [2014]). | Race/ethnicity. Our analysis includes dummy indicators of whether the race/ethnicity of the child is white, black, Hispanic, Asian, or “other.” Hispanic children are divided into two groups, those whose families speak English at home and those whose families do not. |
| Age of student. Age of the student calculated in months. | Age of student. Age of the student is calculated in months. |
| Language at home is not English. A variable indicates whether the language the student speaks at home is a language other than English. | Language spoken at home. Our analysis includes a dummy indicator that represents whether the language spoken in the child’s home is a language other than English (we call a child in this setting an English language learner, or ELL), versus whether the language spoken at home is English or English and other language(s). |
| Disability. A variable indicates whether the child has a disability that has been diagnosed by a professional (composite variable). Questions in the parents’ interview about disabilities ask about the child’s ability to pay attention and learn, overall activity level, overall behavior and relationships to adults, overall emotional behavior (such as behaviors indicating anxiety or depression), ability to communicate, difficulty in hearing and understanding speech, and eyesight (Tourangeau et al. 2009, 7-17). | Disability. A dummy indicator represents whether the child has been diagnosed with a disability. |
| Type of family. A variable indicates whether the child is living with two parents, or with one parent or in another family structure. | Type of family. A variable indicates whether the child lives with two parents versus living with one parent or in another family composition. |
| Prekindergarten care in a center-based setting. A dummy indicator represents whether the child was cared for in a center-based setting or attended Head Start during the year prior to the kindergarten year, compared with other options. These alternatives include no nonparental care arrangements and care provided through other means (by a relative or a nonrelative, at home or outside the home, or a combination of options). | Prekindergarten care in a center-based setting. Our analysis includes a dummy indicator of whether the child was cared for in a center-based setting (including Head Start) during the year prior to the kindergarten year, compared with other options. These alternatives include no nonparental care arrangements and care provided through other means (by a relative or a nonrelative, at home or outside the home, or a combination of options). Any finding associated with this variable may be interpreted as the association between attending prekindergarten (pre-K) programs, compared with other options, but must be interpreted with caution. These coefficients should not be interpreted as the impact of pre-K schooling because the variable’s information is limited and the model uses it as a control-only variable. For a review of the extensive literature explaining the benefits of pre-K schooling, see Camilli et al. 2010. |
| “Literacy/reading activities” index. This index captures the variance on a wide set of family early literacy practices. Using an index of activities instead of the underlying questions the index is composed of overcomes potential problems of multicolinearity and therefore improves the properties of our specifications. (This has an alpha of 0.6716). In particular, parents are asked the frequency (“not at all,” “once or twice a week,” “three to six times a week,” or “every day”) with which they engage with the child in the following activities: reading books; telling stories; singing songs; and talking about nature or doing science projects. Parents are also asked how often the child reads picture books outside of school, and reads to or pretends to read to himself or to others outside of school. | “Literacy/reading activities” index. This index captures the variance on a wide set of family early literacy practices. Using an index of activities instead of the underlying questions the index is composed of overcomes potential problems of multicolinearity and therefore improves the properties of our specifications. (This has an alpha of 0.6948.) In particular, parents are asked the frequency (“not at all,” “once or twice a week,” “three to six times a week,” or “every day”) with which they engage with the child in the following activities: reading books; telling stories; singing songs; and talking about nature or doing science projects. Parents are also asked how often the child reads picture books outside of school, and reads to or pretends to read to himself or to others outside of school. |
| “Other activities” index. Parents are asked the frequency (“not at all,” “once or twice a week,” “three to six times a week,” or “every day”) with which they engage with the child in the following activities: playing games or doing puzzles; playing sports; building something or playing with construction toys; doing arts and crafts; or doing science projects. (This has an alpha of 0.5972.) | “Other activities” index. Parents are asked the frequency (“not at all,” “once or twice a week,” “three to six times a week,” or “every day”) with which they engage with the child in the following activities: playing games or doing puzzles; playing sports; building something or playing with construction toys; doing arts and crafts; or doing science projects. (This has an alpha of 0.5527.) |
| Mother’s educational attainment. This is coded as “below high school (8th–12th grades); high school graduate or equivalent; vocational/technical program/some college; bachelor’s degree/graduate or professional school with no degree; and graduate (master’s, doctorate, or professional) degree.” | Mother’s educational attainment. This is coded as “below high-school (8th–12th grades); high school graduate or equivalent; vocational/technical program/some college; bachelor’s degree/graduate or professional school with no degree; and graduate (master’s, doctorate, or professional) degree”. |
| Income. We adjust the income brackets in 2010 for inflation. We use the continuous variable to construct the 18 categories to make it comparable to the variable in 2010. We calculate a continuous income variable using the midpoint between the minimum and maximum for each category (equal to the values in 2010 adjusted by inflation). We calculate the income quintiles using this variable. | Income. The original income variable comes in 18 categories. We calculate a continuous income variable using the midpoint between the minimum and maximum for each category. We calculate the income quintiles using this variable. |
| Parents’ education expectations. This is coded as “HS or less; 2 or more years of college; BA; MA; PHD or MD.” Parents are asked, “How far in school do you expect your child to go? Would you say you expect {him/her} to {attend or complete a certain level}?” | Parents’ education expectations. This is coded as “HS or less; 2 or more years of college/attend a vocational or technical school; BA; MA; PHD or MD.” |
| Number of books the child has. This is represented by a continuous variable (0–200) and a categorical variable coded as “0 to 25; 26 to 50; 51 to 100; 101 to 199; more than 200.” For the regression analysis, the variable is divided by 10. Parents are asked, “About how many children’s books {does {CHILD} have/are} in your home now, including library books? Please only include books that are for children.” | Number of books the child has. This is represented by a continuous variable (0–200) and a categorical variable coded as “0 to 25; 26 to 50; 51 to 100; 101 to 199; more than 200.” For the regression analysis, the variable is divided by 10. |
Source: ECLS-K, kindergarten classes of 1998–1999 and 2010–2011 (National Center for Education Statistics)
Missing data
| 1998 | 2010 | |
|---|---|---|
| Variable | Percent missing | Percent missing |
| Race/ethnicity | ||
| White | 0.2 | 0.5 |
| Black | 0.2 | 0.5 |
| Hispanic | 0.2 | 0.5 |
| Hispanic English language learner (ELL) | 6.6 | 11.8 |
| Hispanic English speaker | 6.6 | 11.8 |
| Asian | 0.2 | 0.5 |
| Others | 0.2 | 0.5 |
| Socioeconomic status | 5.9 | 11.9 |
| Family composition: Not living with two parents | 15.5 | 26.3 |
| Mother’s education | 7.5 | 42.8 |
| Pre-K care, center-based | 16.8 | 17.4 |
| “Literacy/reading activities” index | 15.6 | 26.4 |
| “Other activities” index | 15.6 | 26.5 |
| Parents’ expectations for children’s educational attainment | 16.1 | 26.5 |
| Number of books | 16.3 | 26.7 |
| Outcomes | ||
| Reading | 17.7 | 13.8 |
| Math | 13.0 | 14.2 |
| Self-control (by teachers) | 13.8 | 25.4 |
| Approaches to learning (by teachers) | 10.4 | 18.7 |
| Self-control (by parents) | 15.8 | 27.3 |
| Approaches to learning (by parents) | 15.8 | 27.3 |
Note: For detailed information about the construction of these variables, see Appendix Table A1.
Source: EPI analysis of ECLS-K, kindergarten classes of 1998–1999 and 2010–2011 (National Center for Education Statistics)
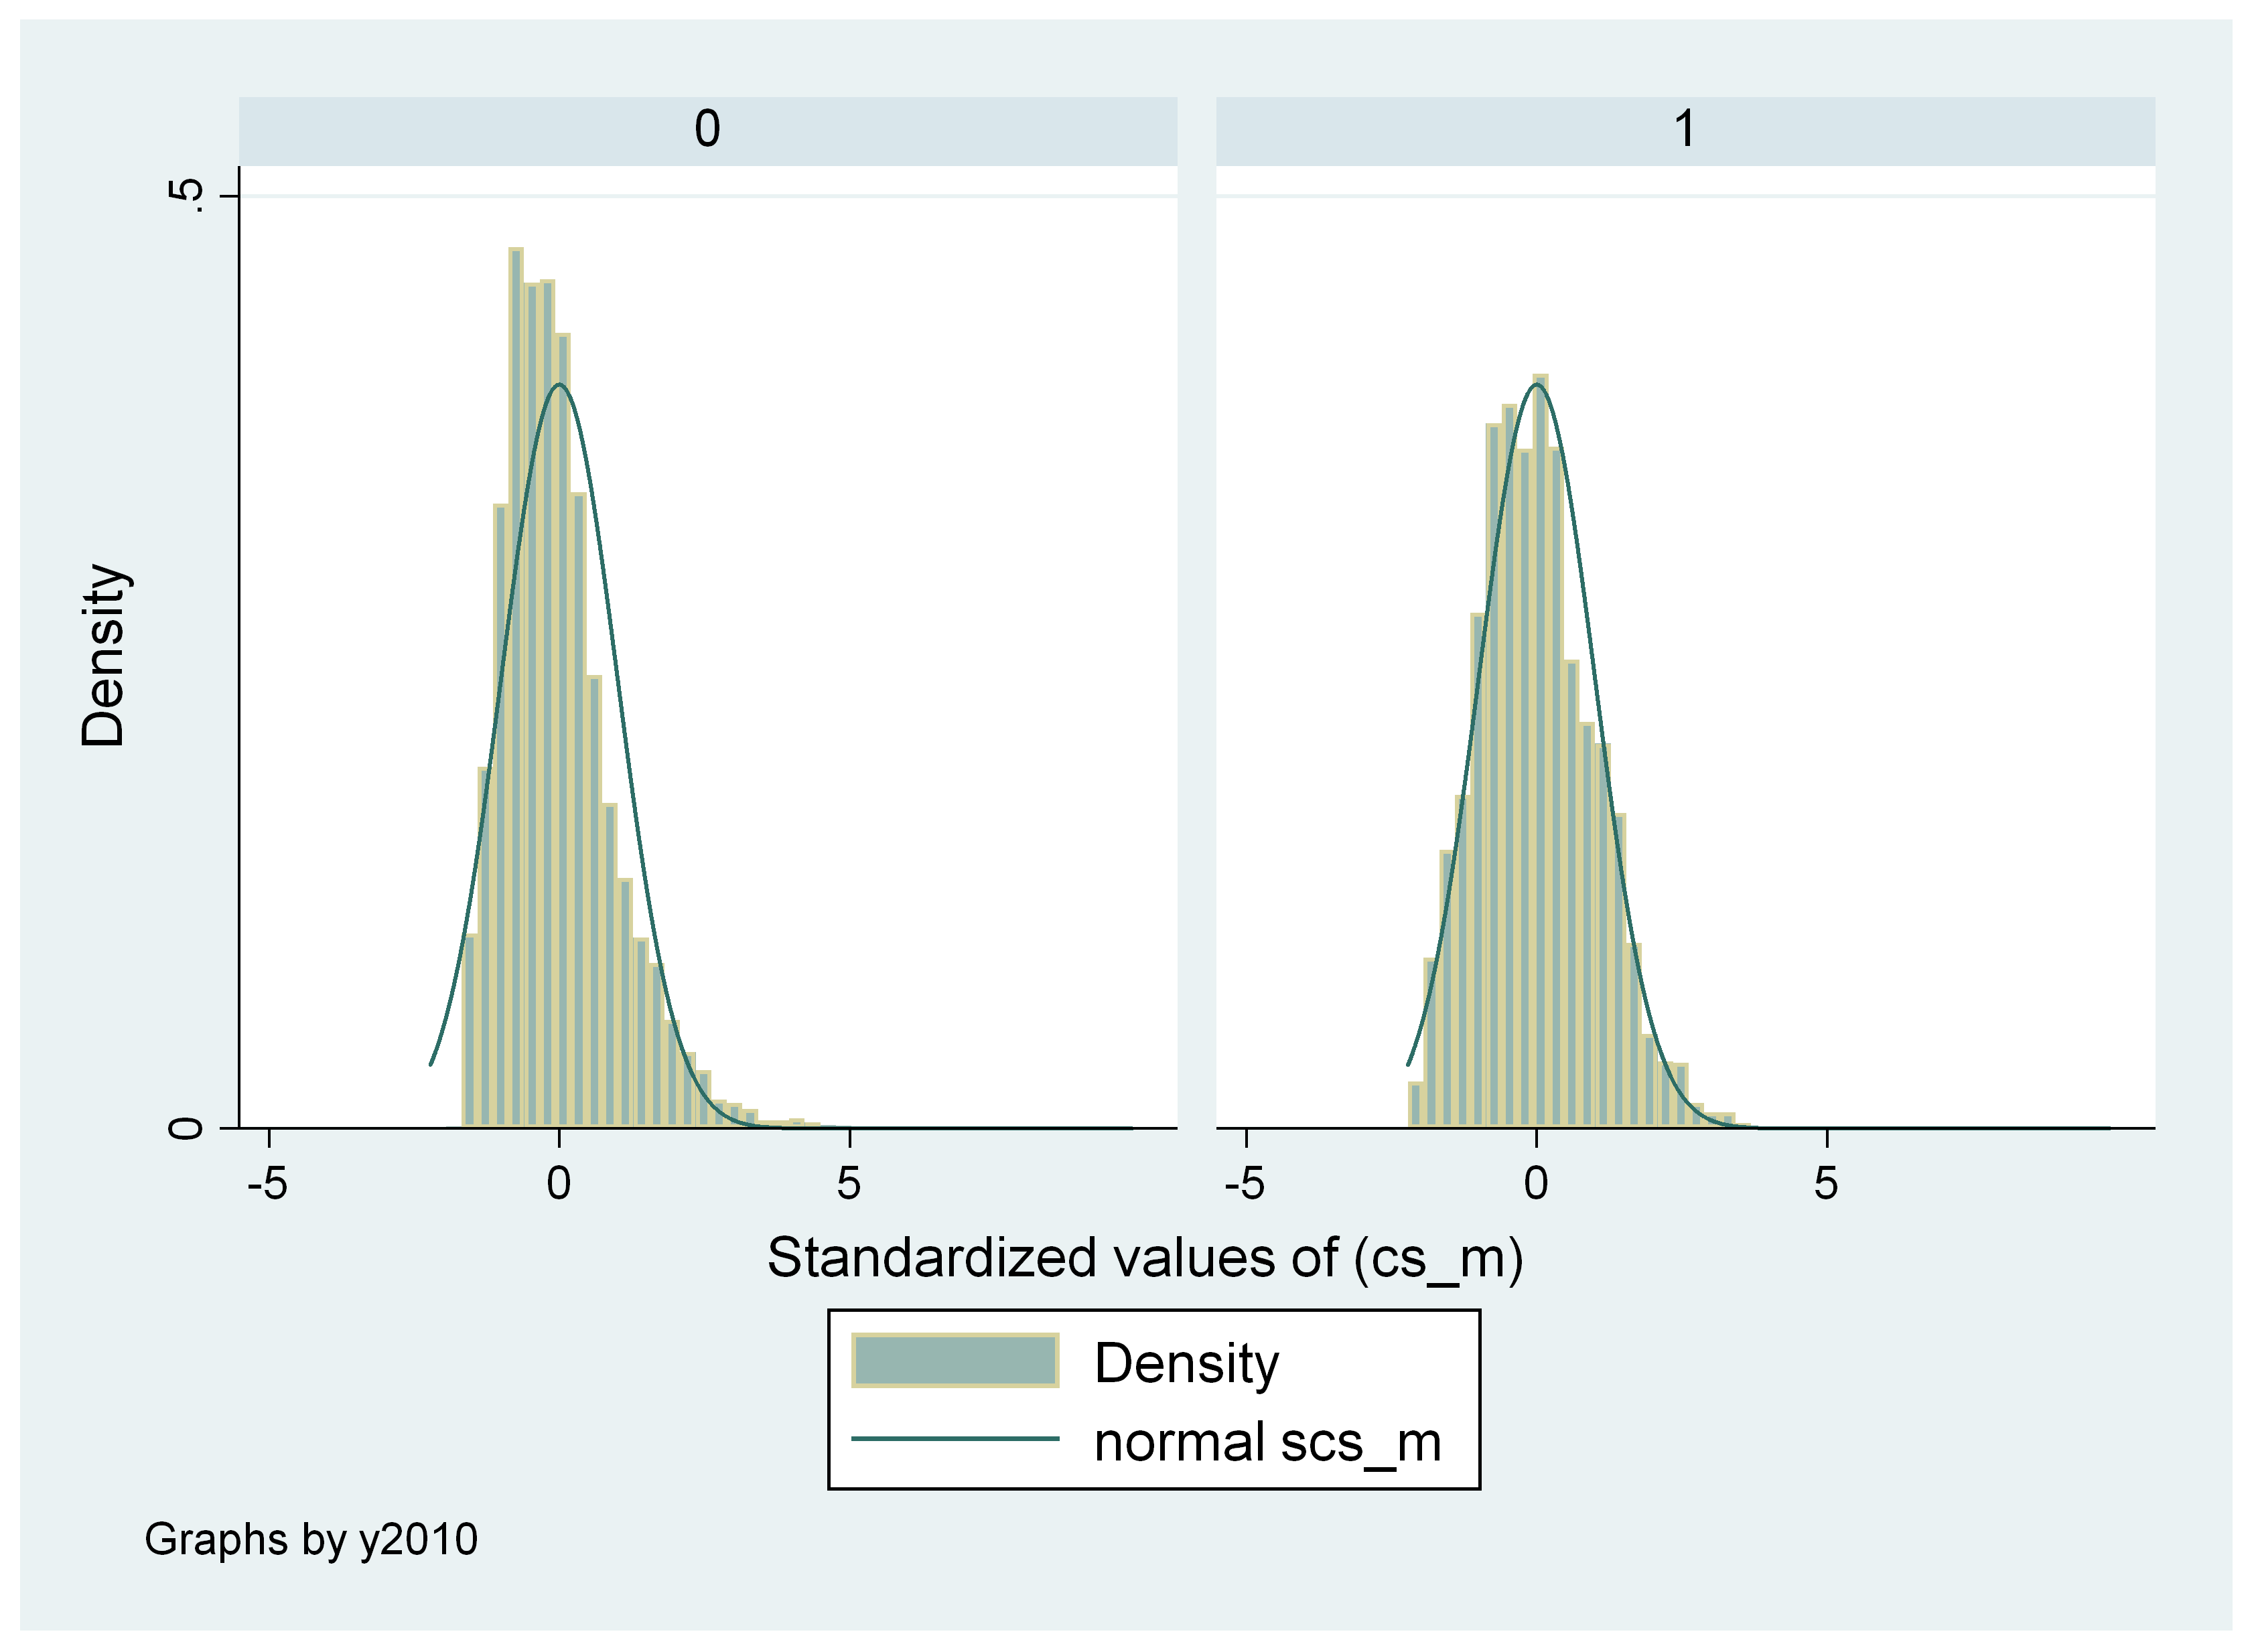
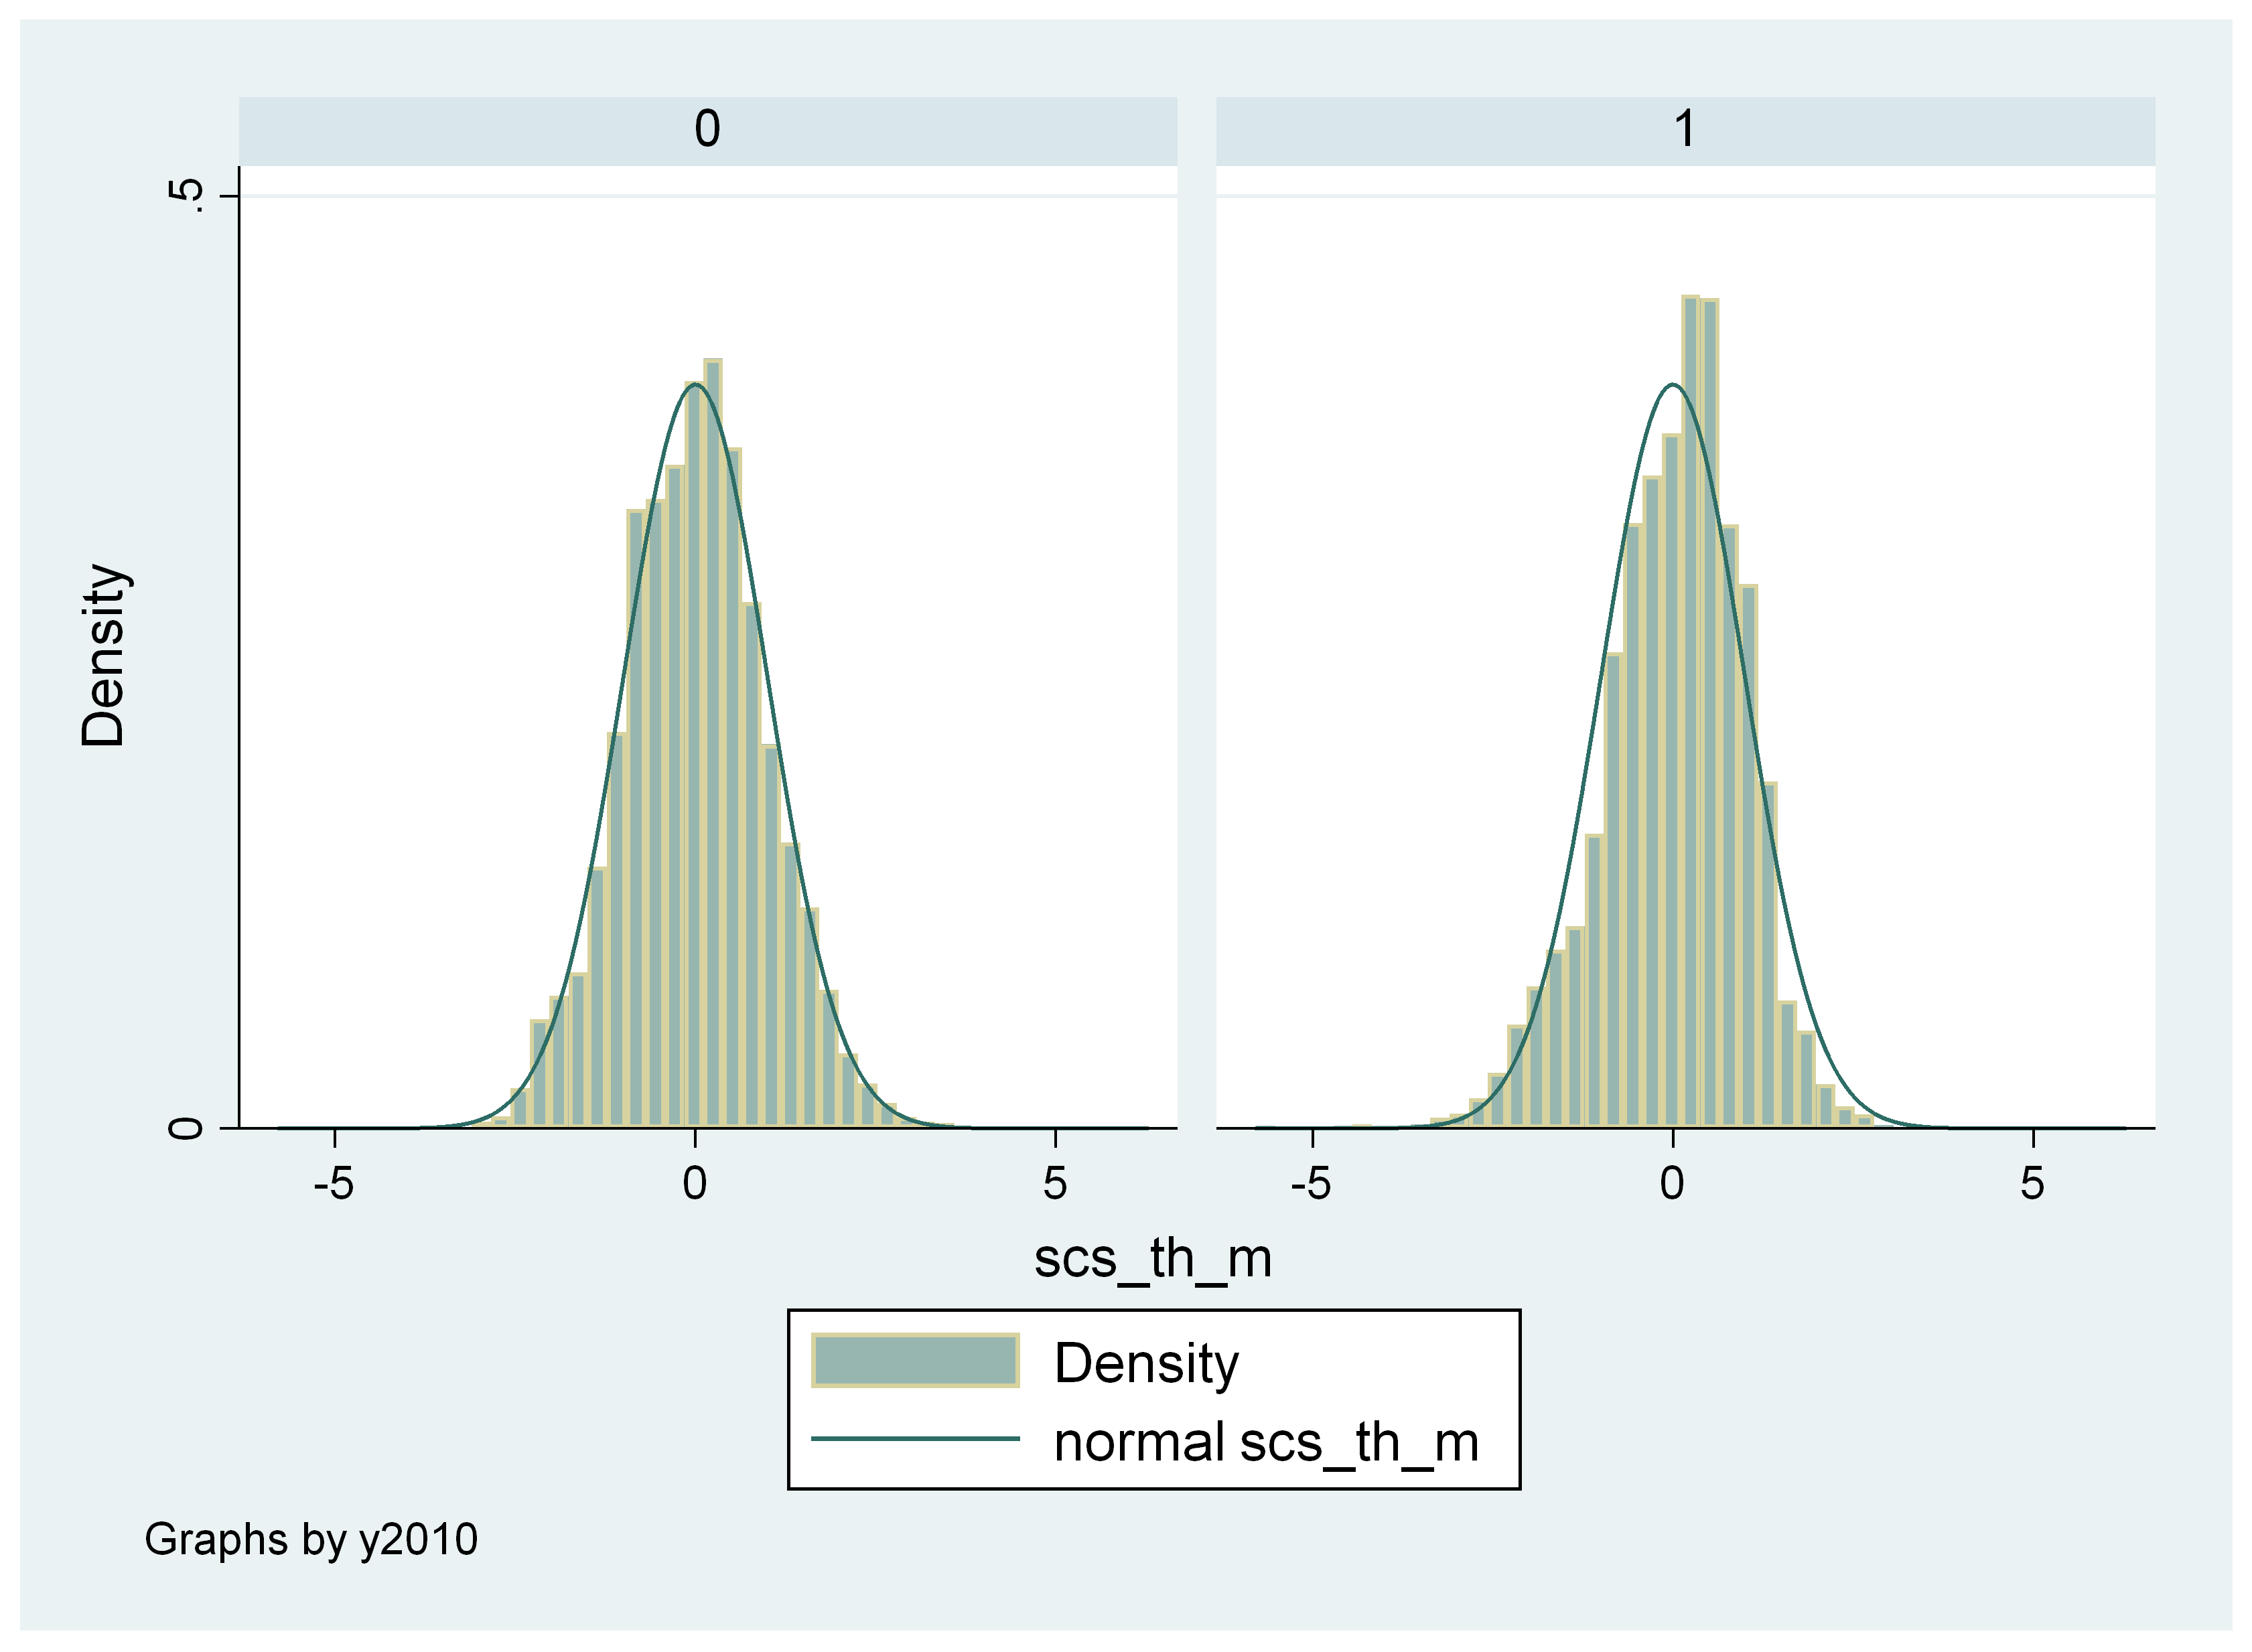
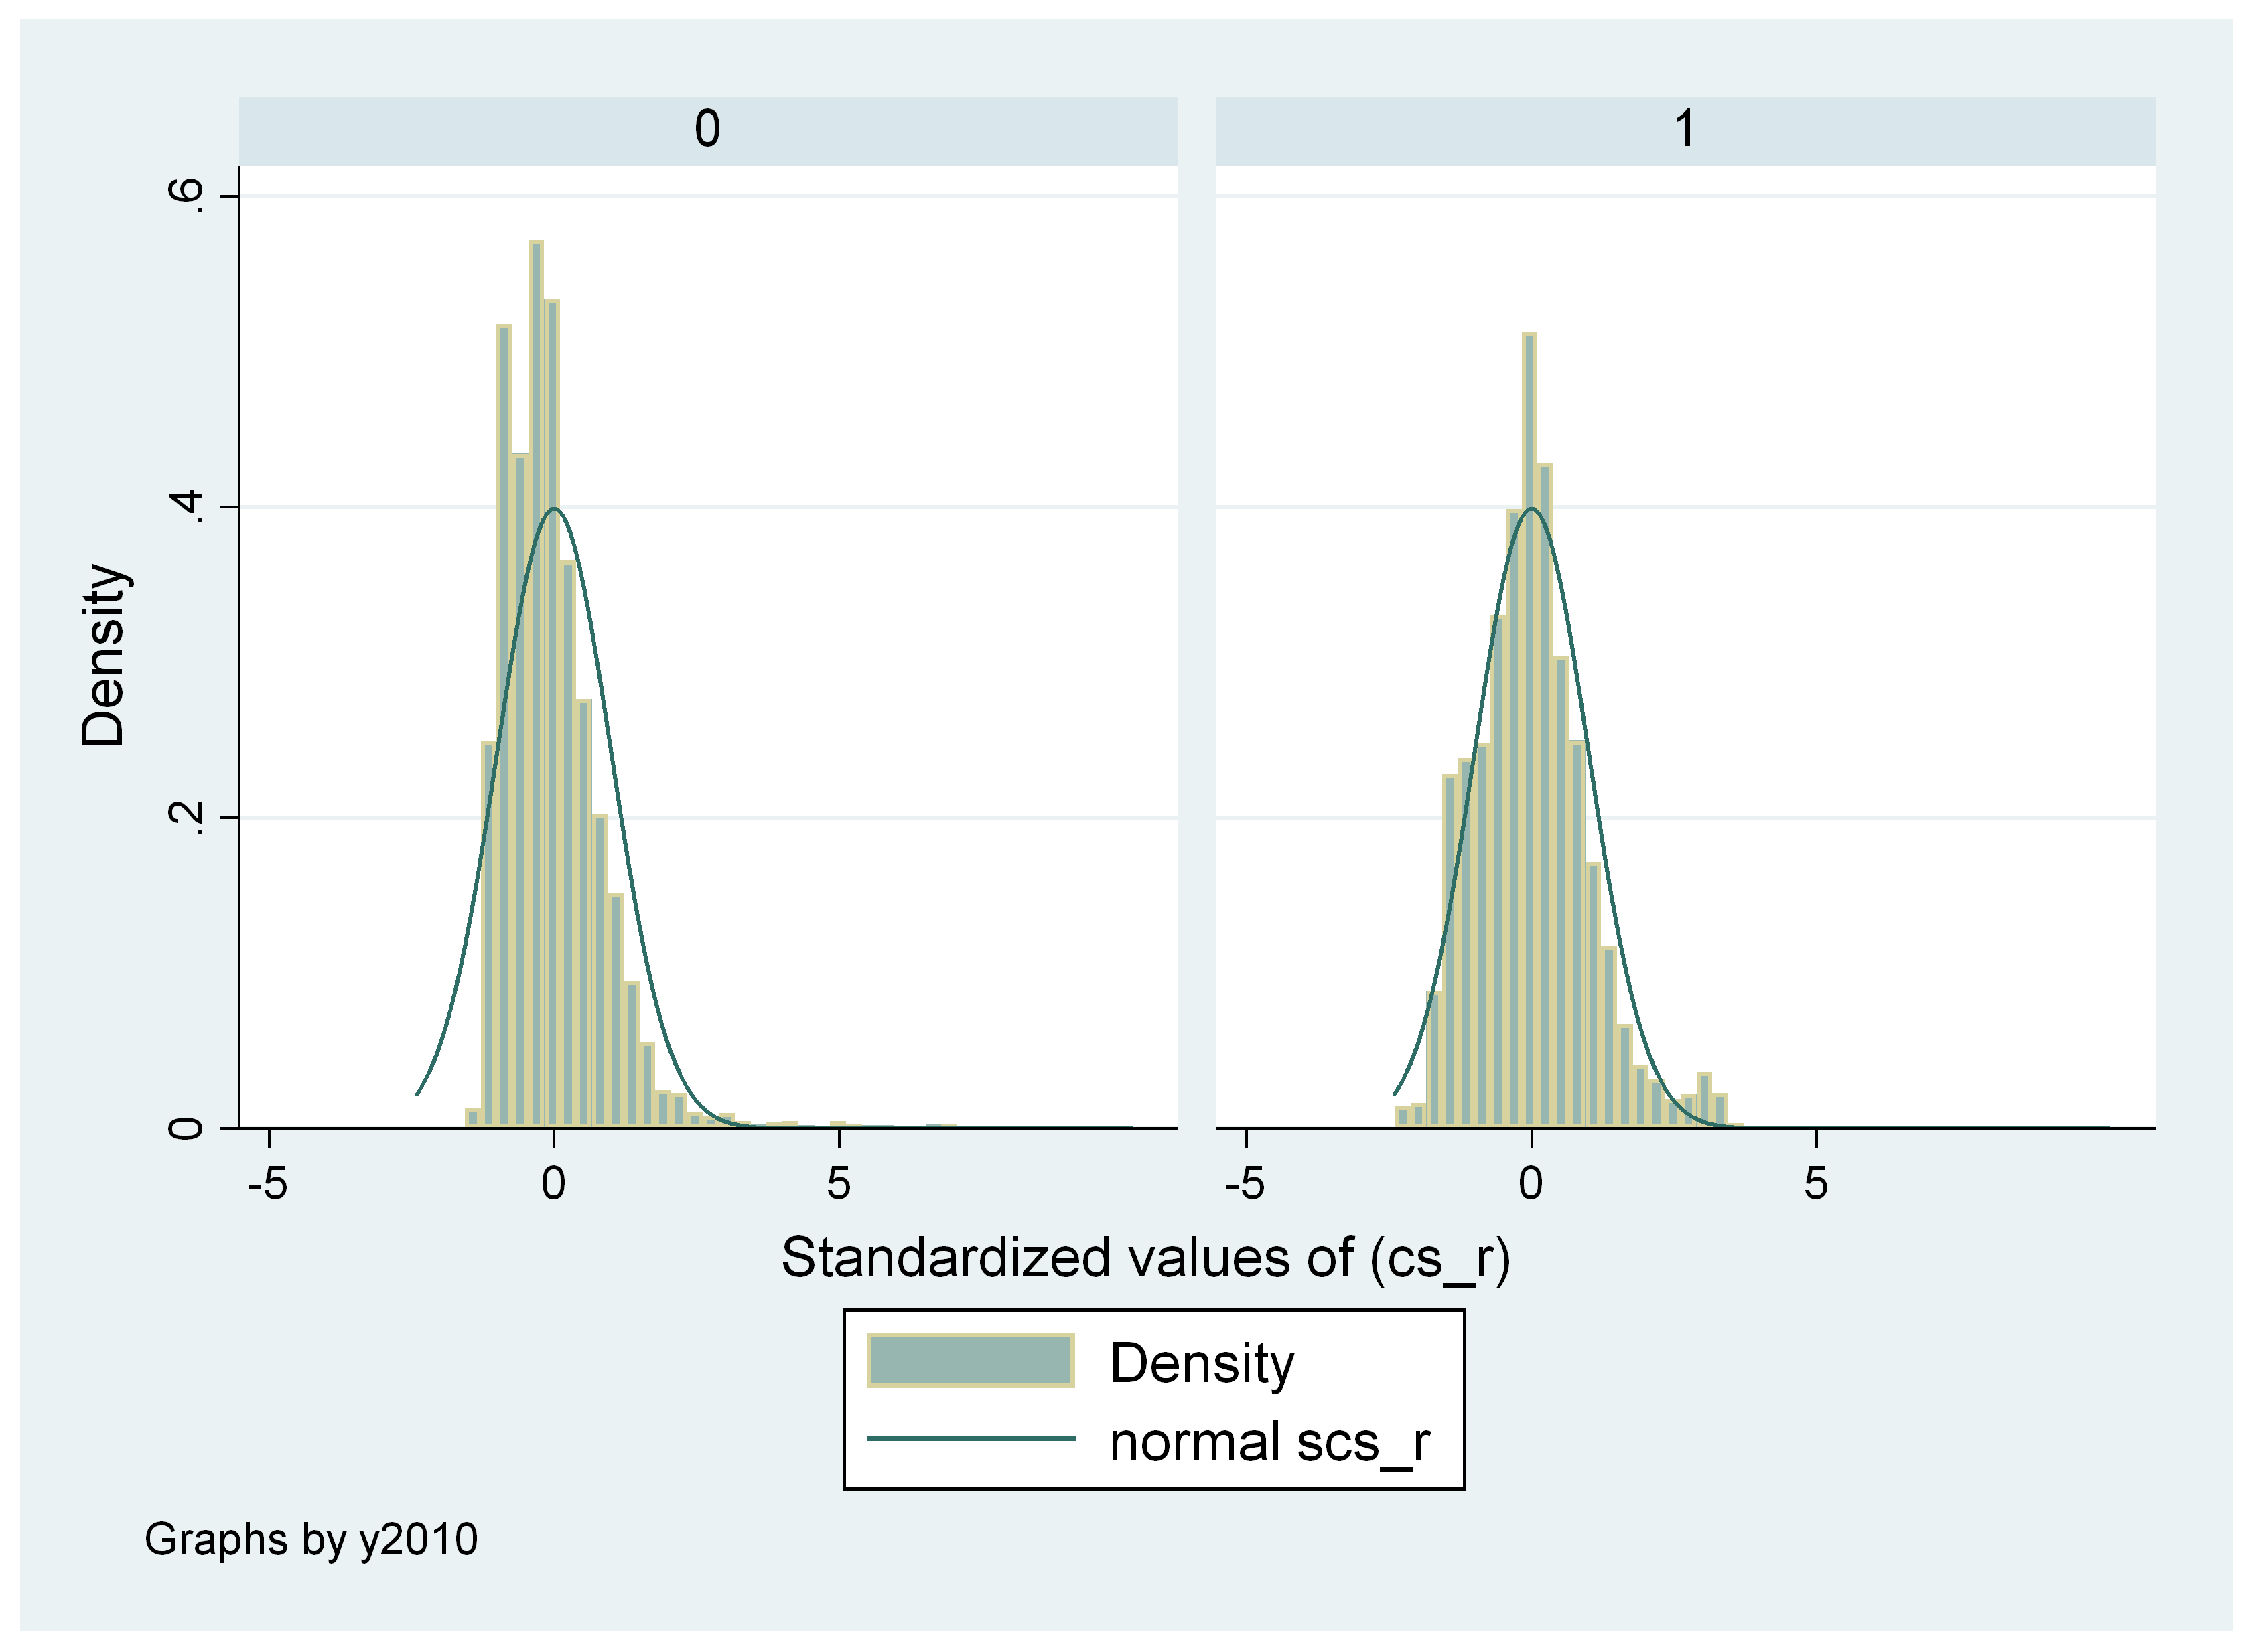
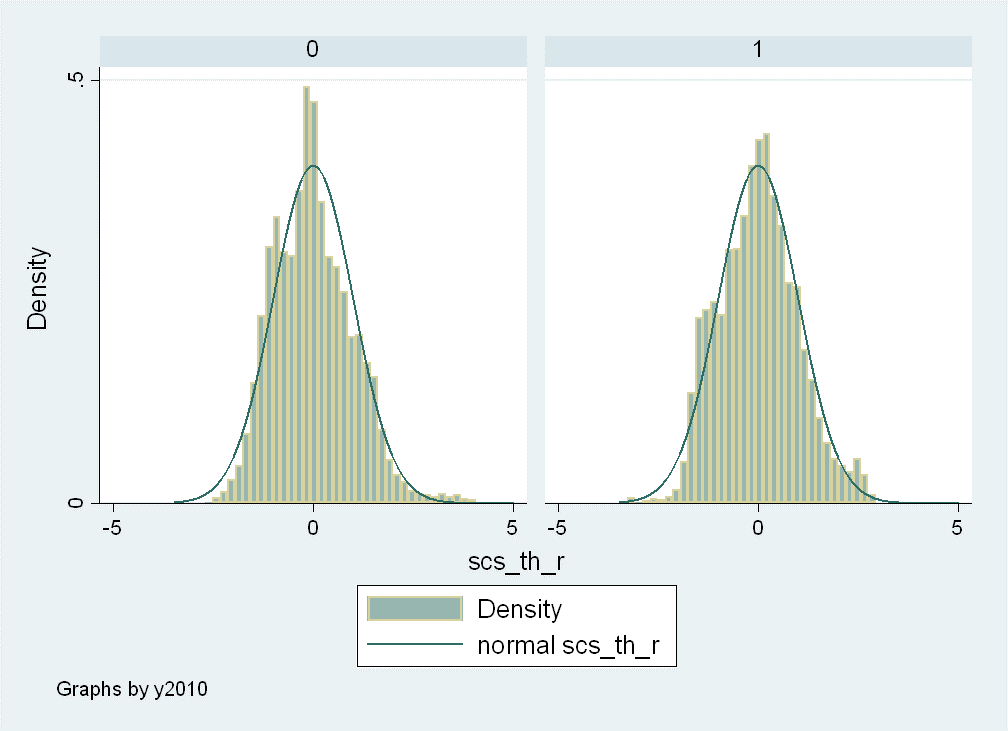
Descriptive statistics of standardized scale and theta scores, by year (not weighted)
| 1998 | 2010 | |||||||
|---|---|---|---|---|---|---|---|---|
| N | (Mean, sd) | Min | Max | N | (Mean, sd) | Min | Max | |
| Scale score–reading | 17,620 | (0,1) | -1.39 | 10.13 | 15,670 | (0,1) | -2.4 | 4.06 |
| Theta score–reading | 17,620 | (0,1) | -2.72 | 4.30 | 15,670 | (0,1) | -3.47 | 5.01 |
| Scale score–math | 18,640 | (0,1) | -1.69 | 9.86 | 15,600 | (0,1) | -2.22 | 4.23 |
| Theta score–math | 18,640 | (0,1) | -3.13 | 4.48 | 15,600 | (0,1) | -5.78 | 6.28 |
Note: N is rounded to the nearest multiple of 10.
Source: ECLS-K, kindergarten classes of 1998–1999 and 2010–2011 (National Center for Education Statistics)
Reading and math skills gaps between high-SES and low-SES children at the beginning of kindergarten in 1998 and change in gaps by the beginning of kindergarten in 2010, using scale and theta scores as dependent variables
| Model 1 (unadjusted) | Model 4 (fully adjusted) | |||||||
|---|---|---|---|---|---|---|---|---|
| Full sample | Restricted sample | |||||||
| Scale scores | Theta scores | Scale scores | Theta scores | |||||
| Reading | Math | Reading | Math | Reading | Math | Reading | Math | |
| Gap in 1998 | 1.071*** | 1.258*** | 1.233*** | 1.330*** | 0.596*** | 0.610*** | 0.684*** | 0.632*** |
| (0.024) | (0.022) | (0.024) | (0.022) | (0.031) | (0.031) | (0.032) | (0.031) | |
| Change in gap by 2010 | 0.098*** | -0.008 | -0.052 | -0.078** | 0.080 | 0.051 | -0.016 | -0.002 |
| (0.033) | (0.032) | (0.033) | (0.032) | (0.052) | (0.048) | (0.054) | (0.050) | |
| N | 30,950 | 31,850 | 30,950 | 31,850 | 26,050 | 26,890 | 26,050 | 26,890 |
| Adj.R2 | 0.152 | 0.189 | 0.170 | 0.197 | 0.293 | 0.336 | 0.336 | 0.353 |
Notes: Standard errors are in the parentheses. N is rounded to the nearest multiple of 10. Asterisks denote statistical significance: *** p < 0.01, ** p < 0.05, * p < 0.1.
Source: ECLS-K, kindergarten classes of 1998-1999 and 2010–2011 (National Center for Education Statistics)
Reading and math skills gaps between high-social class and low-social class children at the beginning of kindergarten in 1998 and change in gaps by the beginning of kindergarten in 2010, using scale and theta scores as dependent variables
| Model 1 (unadjusted) | Model 4 (fully adjusted) | ||||||||
|---|---|---|---|---|---|---|---|---|---|
| Full sample | Restricted sample | ||||||||
| Scale scores | Theta scores | Scale scores | Theta scores | ||||||
| Reading | Math | Reading | Math | Reading | Math | Reading | Math | ||
| By SES | Gap in 1998 | 1.071*** | 1.258*** | 1.233*** | 1.330*** | 0.596*** | 0.610*** | 0.684*** | 0.632*** |
| (0.024) | (0.022) | (0.024) | (0.022) | (0.031) | (0.031) | (0.032) | (0.031) | ||
| Change in gap by 2010 | 0.098*** | -0.008 | -0.052 | -0.078** | 0.080 | 0.051 | -0.016 | -0.002 | |
| (0.033) | (0.032) | (0.033) | (0.032) | (0.052) | (0.048) | (0.054) | (0.050) | ||
| By mother’s education | Gap in 1998 | 1.294*** | 1.457*** | 1.412*** | 1.502*** | 0.696*** | 0.681*** | 0.739*** | 0.685*** |
| (0.038) | (0.036) | (0.038) | (0.035) | (0.058) | (0.050) | (0.048) | (0.044) | ||
| Change in gap by 2010 | -0.020 | -0.154*** | -0.135*** | -0.218*** | -0.075 | -0.119* | -0.135* | -0.182*** | |
| (0.051) | (0.049) | (0.051) | (0.048) | (0.082) | (0.070) | (0.075) | (0.067) | ||
| By number of books | Gap in 1998 | 0.736*** | 0.966*** | 0.847*** | 1.032*** | 0.347*** | 0.424*** | 0.388*** | 0.438*** |
| (0.028) | (0.027) | (0.028) | (0.026) | (0.034) | (0.031) | (0.033) | (0.031) | ||
| Change in gap by 2010 | 0.083** | -0.019 | -0.015 | -0.088** | -0.540*** | -0.818*** | -0.594*** | -0.829*** | |
| (0.039) | (0.038) | (0.039) | (0.038) | (0.184) | (0.188) | (0.181) | (0.174) | ||
| By household income | Gap in 1998 | 1.090*** | 1.308*** | 1.214*** | 1.320*** | 0.384*** | 0.443*** | 0.429*** | 0.439*** |
| (0.042) | (0.041) | (0.042) | (0.041) | (0.058) | (0.060) | (0.049) | (0.050) | ||
| Change in gap by 2010 | -0.127** | -0.230*** | -0.247*** | -0.292*** | -0.006 | -0.060 | -0.058 | -0.099 | |
| (0.060) | (0.059) | (0.060) | (0.059) | (0.084) | (0.082) | (0.076) | (0.072) | ||
Notes: Standard errors are in parentheses. Asterisks denote statistical significance: *** p < 0.01, ** p < 0.05, * p < 0.1.
Source: ECLS-K, kindergarten classes of 1998-1999 and 2010–2011 (National Center for Education Statistics)
Endnotes to the appendices
i. The sample design used to select the individuals in the study was a three-stage process that involved using primary sampling units and schools with probabilities proportional to the number of children and the selection of a fixed number of children per school. In the last stage, children enrolled in kindergarten or ungraded schools were selected within each sampled school. A clustered design was used to limit the number of geographic areas and to minimize the number of schools and the costs of the study (Tourangeau et al. 2013, 4-1).
ii. The dataset in the first year followed a stratified design structure (Ready 2010, 274), in which the primary sampling units were geographic areas consisting of counties or groups of counties. About 1,000 schools—903 for 1998 and 968 for 2010—were selected, and about 24 children per school were surveyed. Assessment of the children was performed by trained evaluators, while parents were surveyed over the telephone. Teachers and school administrators completed the questionnaires in their schools.
iii. As a sensitivity check, we estimate Models 1 and 2 using Models 1’s and Model 2’s specifications but using the restricted sample (these results are not shown here, but are available upon request).
iv. As a sensitivity check, we estimate Model 3 parsimoniously, by including family characteristics only, and then adding family investments (prekindergarten care arrangements, early literacy practices at home, and number of books the child has), and then adding parental expectations (with and without interactions with time); results of the sensitivity check are not shown, but are available upon request).
v. We refer to the fact that we are using the same data and that the scale and theta scores are based on the same instruments and are not independent from each other. Advice on this possibility is found in Reardon (2007), who cites work by Murnane et al. (2006) and Selzer, Frank, and Bryk (1994) that also warn about this option.
vi. From NCES: “IRT uses the pattern of right and wrong responses to the items actually administered in an assessment and the difficulty, discriminating ability, and guess-ability of each item to estimate each child’s ability on the same continuous scale. IRT has several advantages over raw number-right scoring. By using the overall pattern of right and wrong responses and the characteristics of each item to estimate ability, IRT can adjust for the possibility of a low-ability child guessing several difficult items correctly. If answers on several easy items are wrong, the probability of a correct answer on a difficult item would be quite low. Omitted items are also less likely to cause distortion of scores, as long as enough items have been answered to establish a consistent pattern of right and wrong answers. Unlike raw number-right scoring, which treats omitted items as if they had been answered incorrectly, IRT procedures use the pattern of responses to estimate the probability of a child providing a correct response for each assessment question” (Tourangeau et al. 2017, 3-2).
vii. The quoted text is abridged to remove variables and formulas specific to Reardon’s study and not central here.
viii. Also, “the estimated scale score is the estimated number of questions the student would have gotten correct if he or she had been asked all of the items on the test. The estimated scale score is obtained by summing the predicted probabilities of a correct response over all items, given the student’s estimated theta score and the estimated item parameters” (Reardon 2007, 11).
ix. They are equally spaced units along the scale without a predefined zero point.