Economic Indicators JOLTS
The Job Openings and Labor Turnover Survey (JOLTS) tells us how many job openings there are each month, how many workers were hired, how many quit their job, how many were laid off, and how many experienced other separations (which includes worker deaths).
February
Next update: May 1, 2024
• April 2, 2024
Below, EPI senior economist Elise Gould offers her insights on today’s release of the Job Openings and Labor Turnover Survey (JOLTS) for February. Read the full thread here.
The slight uptick in the hires rate is promising. At 3.7%, the hires rate for February is still a little below the pre-pandemic average of about 3.9%, but I’m happy to see it moving in the right direction after dipping down at the end of 2023. Layoffs below pre-pandemic average. pic.twitter.com/G7CIZ6c9aP
— Elise Gould (@eliselgould) April 2, 2024
As of the February data, the hires rate remains above the quits rate in every sector. Overall, the hires and quits rates are slightly below pre-pandemic averages. Some workers are still quitting in search of better opportunities but the labor market is decidedly not hot. pic.twitter.com/3QopNhlgxt
— Elise Gould (@eliselgould) April 2, 2024
Hires, quits, and layoff rates, 2000–2024
| Date | Hires | Quits | Layoffs |
|---|---|---|---|
| Dec-2000 | 4.1 | 2.2 | 1.5 |
| Jan-2001 | 4.3 | 2.4 | 1.7 |
| Feb-2001 | 4 | 2.3 | 1.4 |
| Mar-2001 | 4.2 | 2.3 | 1.6 |
| Apr-2001 | 3.9 | 2.4 | 1.4 |
| May-2001 | 4.1 | 2.3 | 1.5 |
| Jun-2001 | 3.9 | 2.2 | 1.5 |
| Jul-2001 | 4 | 2.2 | 1.5 |
| Aug-2001 | 4 | 2.2 | 1.5 |
| Sep-2001 | 3.8 | 2.1 | 1.6 |
| Oct-2001 | 3.9 | 2.1 | 1.8 |
| Nov-2001 | 3.7 | 2 | 1.7 |
| Dec-2001 | 3.7 | 2 | 1.5 |
| Jan-2002 | 3.7 | 2.2 | 1.5 |
| Feb-2002 | 3.7 | 2 | 1.5 |
| Mar-2002 | 3.6 | 1.9 | 1.4 |
| Apr-2002 | 3.8 | 2 | 1.5 |
| May-2002 | 3.7 | 1.9 | 1.5 |
| Jun-2002 | 3.7 | 1.9 | 1.5 |
| Jul-2002 | 3.8 | 2 | 1.6 |
| Aug-2002 | 3.7 | 2 | 1.5 |
| Sep-2002 | 3.7 | 1.9 | 1.5 |
| Oct-2002 | 3.7 | 1.9 | 1.5 |
| Nov-2002 | 3.7 | 1.8 | 1.5 |
| Dec-2002 | 3.7 | 1.9 | 1.5 |
| Jan-2003 | 3.9 | 1.9 | 1.6 |
| Feb-2003 | 3.6 | 1.9 | 1.5 |
| Mar-2003 | 3.4 | 1.8 | 1.5 |
| Apr-2003 | 3.5 | 1.8 | 1.5 |
| May-2003 | 3.6 | 1.8 | 1.6 |
| Jun-2003 | 3.6 | 1.8 | 1.6 |
| Jul-2003 | 3.6 | 1.7 | 1.6 |
| Aug-2003 | 3.6 | 1.7 | 1.7 |
| Sep-2003 | 3.7 | 1.8 | 1.5 |
| Oct-2003 | 3.8 | 1.9 | 1.5 |
| Nov-2003 | 3.7 | 1.8 | 1.5 |
| Dec-2003 | 3.8 | 1.9 | 1.5 |
| Jan-2004 | 3.7 | 1.8 | 1.6 |
| Feb-2004 | 3.7 | 1.9 | 1.5 |
| Mar-2004 | 4 | 2 | 1.6 |
| Apr-2004 | 3.9 | 1.9 | 1.5 |
| May-2004 | 3.8 | 1.8 | 1.5 |
| Jun-2004 | 3.8 | 2 | 1.4 |
| Jul-2004 | 3.7 | 2 | 1.4 |
| Aug-2004 | 3.8 | 2 | 1.5 |
| Sep-2004 | 3.8 | 1.9 | 1.5 |
| Oct-2004 | 3.9 | 1.9 | 1.4 |
| Nov-2004 | 3.9 | 2.1 | 1.5 |
| Dec-2004 | 3.9 | 2 | 1.5 |
| Jan-2005 | 3.9 | 2.1 | 1.5 |
| Feb-2005 | 4 | 2 | 1.6 |
| Mar-2005 | 4 | 2.1 | 1.6 |
| Apr-2005 | 4 | 2.1 | 1.5 |
| May-2005 | 3.9 | 2.1 | 1.5 |
| Jun-2005 | 4 | 2.1 | 1.5 |
| Jul-2005 | 4 | 2 | 1.4 |
| Aug-2005 | 4 | 2.2 | 1.4 |
| Sep-2005 | 4.1 | 2.3 | 1.5 |
| Oct-2005 | 3.8 | 2.1 | 1.4 |
| Nov-2005 | 4 | 2.1 | 1.3 |
| Dec-2005 | 3.9 | 2.1 | 1.4 |
| Jan-2006 | 3.9 | 2.2 | 1.3 |
| Feb-2006 | 4 | 2.2 | 1.4 |
| Mar-2006 | 4.1 | 2.2 | 1.4 |
| Apr-2006 | 3.8 | 2 | 1.4 |
| May-2006 | 4 | 2.2 | 1.5 |
| Jun-2006 | 4 | 2.2 | 1.3 |
| Jul-2006 | 4.1 | 2.2 | 1.4 |
| Aug-2006 | 3.9 | 2.2 | 1.3 |
| Sep-2006 | 3.9 | 2.1 | 1.3 |
| Oct-2006 | 3.9 | 2.2 | 1.4 |
| Nov-2006 | 4 | 2.2 | 1.4 |
| Dec-2006 | 3.8 | 2.2 | 1.3 |
| Jan-2007 | 3.9 | 2.1 | 1.4 |
| Feb-2007 | 3.8 | 2.1 | 1.3 |
| Mar-2007 | 4 | 2.2 | 1.4 |
| Apr-2007 | 3.9 | 2.1 | 1.5 |
| May-2007 | 4 | 2.2 | 1.4 |
| Jun-2007 | 3.8 | 2.1 | 1.3 |
| Jul-2007 | 3.8 | 2.1 | 1.4 |
| Aug-2007 | 3.9 | 2.2 | 1.5 |
| Sep-2007 | 3.9 | 1.9 | 1.6 |
| Oct-2007 | 3.9 | 2.1 | 1.4 |
| Nov-2007 | 3.7 | 2 | 1.4 |
| Dec-2007 | 3.7 | 2 | 1.4 |
| Jan-2008 | 3.7 | 2.1 | 1.4 |
| Feb-2008 | 3.7 | 2.1 | 1.4 |
| Mar-2008 | 3.6 | 1.9 | 1.4 |
| Apr-2008 | 3.6 | 2.1 | 1.4 |
| May-2008 | 3.4 | 1.9 | 1.4 |
| Jun-2008 | 3.6 | 1.9 | 1.6 |
| Jul-2008 | 3.4 | 1.8 | 1.5 |
| Aug-2008 | 3.4 | 1.8 | 1.6 |
| Sep-2008 | 3.3 | 1.8 | 1.5 |
| Oct-2008 | 3.3 | 1.7 | 1.7 |
| Nov-2008 | 3 | 1.6 | 1.7 |
| Dec-2008 | 3.2 | 1.5 | 1.8 |
| Jan-2009 | 3.1 | 1.5 | 1.9 |
| Feb-2009 | 3 | 1.5 | 1.9 |
| Mar-2009 | 2.9 | 1.4 | 1.9 |
| Apr-2009 | 2.9 | 1.3 | 2 |
| May-2009 | 2.9 | 1.3 | 1.7 |
| Jun-2009 | 2.8 | 1.3 | 1.7 |
| Jul-2009 | 3 | 1.3 | 1.7 |
| Aug-2009 | 2.9 | 1.2 | 1.6 |
| Sep-2009 | 3 | 1.2 | 1.7 |
| Oct-2009 | 3 | 1.3 | 1.6 |
| Nov-2009 | 3.1 | 1.4 | 1.5 |
| Dec-2009 | 3.1 | 1.4 | 1.6 |
| Jan-2010 | 3 | 1.3 | 1.4 |
| Feb-2010 | 3 | 1.4 | 1.4 |
| Mar-2010 | 3.3 | 1.4 | 1.5 |
| Apr-2010 | 3.2 | 1.5 | 1.3 |
| May-2010 | 3.4 | 1.4 | 1.3 |
| Jun-2010 | 3.1 | 1.5 | 1.6 |
| Jul-2010 | 3.2 | 1.4 | 1.7 |
| Aug-2010 | 3.1 | 1.4 | 1.4 |
| Sep-2010 | 3.1 | 1.5 | 1.4 |
| Oct-2010 | 3.2 | 1.4 | 1.3 |
| Nov-2010 | 3.2 | 1.4 | 1.4 |
| Dec-2010 | 3.3 | 1.5 | 1.4 |
| Jan-2011 | 3.1 | 1.4 | 1.4 |
| Feb-2011 | 3.2 | 1.5 | 1.3 |
| Mar-2011 | 3.4 | 1.5 | 1.4 |
| Apr-2011 | 3.3 | 1.4 | 1.4 |
| May-2011 | 3.2 | 1.5 | 1.4 |
| Jun-2011 | 3.3 | 1.5 | 1.5 |
| Jul-2011 | 3.2 | 1.5 | 1.4 |
| Aug-2011 | 3.3 | 1.5 | 1.4 |
| Sep-2011 | 3.3 | 1.5 | 1.4 |
| Oct-2011 | 3.3 | 1.5 | 1.4 |
| Nov-2011 | 3.3 | 1.5 | 1.4 |
| Dec-2011 | 3.3 | 1.5 | 1.4 |
| Jan-2012 | 3.3 | 1.5 | 1.3 |
| Feb-2012 | 3.4 | 1.6 | 1.4 |
| Mar-2012 | 3.4 | 1.6 | 1.3 |
| Apr-2012 | 3.3 | 1.6 | 1.4 |
| May-2012 | 3.4 | 1.6 | 1.5 |
| Jun-2012 | 3.3 | 1.6 | 1.4 |
| Jul-2012 | 3.2 | 1.5 | 1.3 |
| Aug-2012 | 3.3 | 1.5 | 1.4 |
| Sep-2012 | 3.2 | 1.4 | 1.3 |
| Oct-2012 | 3.3 | 1.5 | 1.4 |
| Nov-2012 | 3.3 | 1.5 | 1.4 |
| Dec-2012 | 3.3 | 1.5 | 1.3 |
| Jan-2013 | 3.3 | 1.7 | 1.2 |
| Feb-2013 | 3.4 | 1.7 | 1.2 |
| Mar-2013 | 3.2 | 1.6 | 1.3 |
| Apr-2013 | 3.4 | 1.7 | 1.3 |
| May-2013 | 3.4 | 1.6 | 1.3 |
| Jun-2013 | 3.3 | 1.6 | 1.3 |
| Jul-2013 | 3.3 | 1.7 | 1.3 |
| Aug-2013 | 3.5 | 1.7 | 1.3 |
| Sep-2013 | 3.5 | 1.7 | 1.4 |
| Oct-2013 | 3.3 | 1.7 | 1.2 |
| Nov-2013 | 3.4 | 1.7 | 1.2 |
| Dec-2013 | 3.4 | 1.7 | 1.3 |
| Jan-2014 | 3.4 | 1.7 | 1.3 |
| Feb-2014 | 3.4 | 1.8 | 1.3 |
| Mar-2014 | 3.5 | 1.8 | 1.2 |
| Apr-2014 | 3.5 | 1.8 | 1.3 |
| May-2014 | 3.5 | 1.8 | 1.2 |
| Jun-2014 | 3.5 | 1.8 | 1.3 |
| Jul-2014 | 3.6 | 1.9 | 1.3 |
| Aug-2014 | 3.5 | 1.8 | 1.2 |
| Sep-2014 | 3.7 | 2 | 1.2 |
| Oct-2014 | 3.7 | 1.9 | 1.3 |
| Nov-2014 | 3.6 | 1.9 | 1.2 |
| Dec-2014 | 3.7 | 1.8 | 1.3 |
| Jan-2015 | 3.6 | 2 | 1.3 |
| Feb-2015 | 3.6 | 1.9 | 1.2 |
| Mar-2015 | 3.6 | 2 | 1.4 |
| Apr-2015 | 3.7 | 1.9 | 1.3 |
| May-2015 | 3.6 | 1.9 | 1.2 |
| Jun-2015 | 3.6 | 1.9 | 1.3 |
| Jul-2015 | 3.6 | 1.9 | 1.2 |
| Aug-2015 | 3.6 | 2 | 1.2 |
| Sep-2015 | 3.7 | 2 | 1.4 |
| Oct-2015 | 3.7 | 2 | 1.3 |
| Nov-2015 | 3.8 | 2 | 1.2 |
| Dec-2015 | 3.9 | 2.1 | 1.3 |
| Jan-2016 | 3.6 | 2 | 1.3 |
| Feb-2016 | 3.8 | 2.1 | 1.3 |
| Mar-2016 | 3.7 | 2 | 1.3 |
| Apr-2016 | 3.7 | 2.1 | 1.2 |
| May-2016 | 3.6 | 2.1 | 1.3 |
| Jun-2016 | 3.7 | 2.1 | 1.2 |
| Jul-2016 | 3.8 | 2.1 | 1.2 |
| Aug-2016 | 3.7 | 2.1 | 1.3 |
| Sep-2016 | 3.7 | 2.1 | 1.1 |
| Oct-2016 | 3.6 | 2.1 | 1.1 |
| Nov-2016 | 3.7 | 2.1 | 1.2 |
| Dec-2016 | 3.7 | 2.1 | 1.2 |
| Jan-2017 | 3.8 | 2.2 | 1.2 |
| Feb-2017 | 3.7 | 2.1 | 1.2 |
| Mar-2017 | 3.7 | 2.2 | 1.2 |
| Apr-2017 | 3.6 | 2.1 | 1.2 |
| May-2017 | 3.7 | 2.1 | 1.2 |
| Jun-2017 | 3.8 | 2.2 | 1.3 |
| Jul-2017 | 3.7 | 2.1 | 1.3 |
| Aug-2017 | 3.8 | 2.1 | 1.3 |
| Sep-2017 | 3.7 | 2.2 | 1.2 |
| Oct-2017 | 3.8 | 2.2 | 1.2 |
| Nov-2017 | 3.7 | 2.2 | 1.2 |
| Dec-2017 | 3.7 | 2.2 | 1.2 |
| Jan-2018 | 3.7 | 2.1 | 1.3 |
| Feb-2018 | 3.8 | 2.2 | 1.2 |
| Mar-2018 | 3.8 | 2.2 | 1.2 |
| Apr-2018 | 3.8 | 2.3 | 1.2 |
| May-2018 | 3.9 | 2.3 | 1.2 |
| Jun-2018 | 3.9 | 2.3 | 1.2 |
| Jul-2018 | 3.8 | 2.3 | 1.2 |
| Aug-2018 | 3.9 | 2.3 | 1.2 |
| Sep-2018 | 3.8 | 2.3 | 1.2 |
| Oct-2018 | 3.9 | 2.3 | 1.2 |
| Nov-2018 | 3.9 | 2.3 | 1.3 |
| Dec-2018 | 3.8 | 2.3 | 1.2 |
| Jan-2019 | 3.8 | 2.4 | 1.2 |
| Feb-2019 | 3.8 | 2.4 | 1.2 |
| Mar-2019 | 3.8 | 2.3 | 1.1 |
| Apr-2019 | 4 | 2.3 | 1.3 |
| May-2019 | 3.8 | 2.3 | 1.2 |
| Jun-2019 | 3.8 | 2.3 | 1.2 |
| Jul-2019 | 3.9 | 2.4 | 1.2 |
| Aug-2019 | 3.9 | 2.4 | 1.2 |
| Sep-2019 | 3.9 | 2.3 | 1.3 |
| Oct-2019 | 3.8 | 2.3 | 1.2 |
| Nov-2019 | 3.9 | 2.3 | 1.2 |
| Dec-2019 | 3.9 | 2.3 | 1.3 |
| Jan-2020 | 3.9 | 2.4 | 1.2 |
| Feb-2020 | 4 | 2.3 | 1.3 |
| Mar-2020 | 3.5 | 2 | 8.6 |
| Apr-2020 | 3.1 | 1.6 | 7 |
| May-2020 | 6.1 | 1.7 | 1.6 |
| Jun-2020 | 5.4 | 1.9 | 1.7 |
| Jul-2020 | 4.5 | 2.1 | 1.3 |
| Aug-2020 | 4.3 | 2.1 | 1.1 |
| Sep-2020 | 4.2 | 2.2 | 1.1 |
| Oct-2020 | 4.3 | 2.3 | 1.2 |
| Nov-2020 | 4.1 | 2.3 | 1.5 |
| Dec-2020 | 4 | 2.4 | 1.4 |
| Jan-2021 | 4 | 2.3 | 1.1 |
| Feb-2021 | 4.2 | 2.4 | 1.1 |
| Mar-2021 | 4.3 | 2.6 | 1 |
| Apr-2021 | 4.2 | 2.8 | 1 |
| May-2021 | 4.2 | 2.6 | 0.9 |
| Jun-2021 | 4.4 | 2.8 | 0.9 |
| Jul-2021 | 4.5 | 2.8 | 1 |
| Aug-2021 | 4.3 | 2.8 | 1 |
| Sep-2021 | 4.4 | 2.9 | 1 |
| Oct-2021 | 4.4 | 2.8 | 0.9 |
| Nov-2021 | 4.5 | 3 | 0.9 |
| Dec-2021 | 4.3 | 3 | 0.8 |
| Jan-2022 | 4.3 | 2.9 | 0.9 |
| Feb-2022 | 4.5 | 2.9 | 0.9 |
| Mar-2022 | 4.3 | 2.9 | 0.9 |
| Apr-2022 | 4.3 | 3 | 0.9 |
| May-2022 | 4.3 | 2.8 | 1.0 |
| Jun-2022 | 4.2 | 2.7 | 1.0 |
| Jul-2022 | 4.1 | 2.6 | 1.0 |
| Aug-2022 | 4.2 | 2.8 | 1.1 |
| Sept-2022 | 4.1 | 2.6 | 0.9 |
| Oct-2022 | 4.0 | 2.6 | 1 |
| Nov-2022 | 4.1 | 2.7 | 1 |
| Dec-2022 | 4 | 2.6 | 1 |
| Jan-2023 | 4.1 | 2.5 | 1.2 |
| Feb-2023 | 3.9 | 2.6 | 1 |
| Mar-2023 | 3.8 | 2.5 | 1.2 |
| Apr-2023 | 3.8 | 2.3 | 1.1 |
| May-2023 | 4 | 2.6 | 1 |
| Jun-2023 | 3.8 | 2.4 | 1 |
| Jul-2023 | 3.7 | 2.3 | 1.1 |
| Aug-2023 | 3.8 | 2.3 | 1.1 |
| Sep-2023 | 3.7 | 2.3 | 1 |
| Oct-2023 | 3.7 | 2.3 | 1.1 |
| Nov-2023 | 3.5 | 2.2 | 1 |
| Dec-2023 | 3.7 | 2.2 | 1 |
| Jan-2024 | 3.6 | 2.2 | 1 |
| Feb-2024 | 3.7 | 2.2 | 1.1 |
Notes: Shaded areas denote recessions. The hires rate is the number of hires during the entire month as a percent of total employment. The layoff rate is the number of layoffs and discharges during the entire month as a percent of total employment. The quits rate is the number of quits during the entire month as a percent of total employment.
Source: EPI analysis of Bureau of Labor Statistics Job Openings and Labor Turnover Survey
Total hires, layoffs, and quits, 2000-2024
| Date | Hires | Quits | Layoffs |
|---|---|---|---|
| Dec-2000 | 5,426 | 2,882 | 2,018 |
| Jan-2001 | 5,722 | 3,245 | 2,220 |
| Feb-2001 | 5,303 | 3,053 | 1,855 |
| Mar-2001 | 5,528 | 3,054 | 2,133 |
| Apr-2001 | 5,204 | 3,163 | 1,883 |
| May-2001 | 5,410 | 2,993 | 2,029 |
| Jun-2001 | 5,109 | 2,878 | 2,015 |
| Jul-2001 | 5,244 | 2,947 | 2,038 |
| Aug-2001 | 5,223 | 2,928 | 2,011 |
| Sep-2001 | 4,954 | 2,703 | 2,107 |
| Oct-2001 | 5,078 | 2,795 | 2,319 |
| Nov-2001 | 4,914 | 2,560 | 2,255 |
| Dec-2001 | 4,829 | 2,559 | 1,922 |
| Jan-2002 | 4,855 | 2,845 | 1,907 |
| Feb-2002 | 4,801 | 2,572 | 1,978 |
| Mar-2002 | 4,706 | 2,493 | 1,883 |
| Apr-2002 | 4,928 | 2,624 | 1,956 |
| May-2002 | 4,857 | 2,537 | 1,967 |
| Jun-2002 | 4,869 | 2,522 | 2,015 |
| Jul-2002 | 4,946 | 2,561 | 2,102 |
| Aug-2002 | 4,871 | 2,561 | 1,923 |
| Sep-2002 | 4,879 | 2,521 | 2,022 |
| Oct-2002 | 4,798 | 2,423 | 1,935 |
| Nov-2002 | 4,792 | 2,403 | 1,944 |
| Dec-2002 | 4,893 | 2,501 | 2,007 |
| Jan-2003 | 5,058 | 2,429 | 2,109 |
| Feb-2003 | 4,714 | 2,490 | 2,015 |
| Mar-2003 | 4,470 | 2,394 | 1,949 |
| Apr-2003 | 4,600 | 2,279 | 1,998 |
| May-2003 | 4,678 | 2,291 | 2,072 |
| Jun-2003 | 4,682 | 2,315 | 2,076 |
| Jul-2003 | 4,639 | 2,271 | 2,062 |
| Aug-2003 | 4,666 | 2,195 | 2,162 |
| Sep-2003 | 4,799 | 2,354 | 1,932 |
| Oct-2003 | 4,902 | 2,415 | 1,969 |
| Nov-2003 | 4,767 | 2,411 | 1,951 |
| Dec-2003 | 4,984 | 2,444 | 2,007 |
| Jan-2004 | 4,900 | 2,354 | 2,037 |
| Feb-2004 | 4,788 | 2,448 | 1,985 |
| Mar-2004 | 5,227 | 2,582 | 2,065 |
| Apr-2004 | 5,152 | 2,534 | 2,010 |
| May-2004 | 4,976 | 2,428 | 1,914 |
| Jun-2004 | 5,009 | 2,659 | 1,887 |
| Jul-2004 | 4,891 | 2,609 | 1,885 |
| Aug-2004 | 5,013 | 2,586 | 1,974 |
| Sep-2004 | 5,062 | 2,531 | 2,027 |
| Oct-2004 | 5,149 | 2,550 | 1,903 |
| Nov-2004 | 5,181 | 2,789 | 2,037 |
| Dec-2004 | 5,153 | 2,695 | 1,951 |
| Jan-2005 | 5,201 | 2,732 | 2,008 |
| Feb-2005 | 5,276 | 2,651 | 2,068 |
| Mar-2005 | 5,273 | 2,747 | 2,188 |
| Apr-2005 | 5,362 | 2,741 | 1,957 |
| May-2005 | 5,271 | 2,763 | 2,021 |
| Jun-2005 | 5,376 | 2,754 | 2,015 |
| Jul-2005 | 5,328 | 2,735 | 1,898 |
| Aug-2005 | 5,409 | 2,957 | 1,905 |
| Sep-2005 | 5,493 | 3,046 | 2,032 |
| Oct-2005 | 5,124 | 2,863 | 1,873 |
| Nov-2005 | 5,344 | 2,895 | 1,769 |
| Dec-2005 | 5,294 | 2,849 | 1,923 |
| Jan-2006 | 5,271 | 2,945 | 1,784 |
| Feb-2006 | 5,474 | 2,965 | 1,882 |
| Mar-2006 | 5,524 | 2,956 | 1,888 |
| Apr-2006 | 5,215 | 2,778 | 1,853 |
| May-2006 | 5,498 | 3,002 | 1,991 |
| Jun-2006 | 5,455 | 3,042 | 1,817 |
| Jul-2006 | 5,573 | 3,047 | 1,860 |
| Aug-2006 | 5,373 | 3,056 | 1,775 |
| Sep-2006 | 5,288 | 2,888 | 1,831 |
| Oct-2006 | 5,375 | 2,983 | 1,898 |
| Nov-2006 | 5,495 | 3,043 | 1,926 |
| Dec-2006 | 5,214 | 2,999 | 1,772 |
| Jan-2007 | 5,426 | 2,956 | 1,922 |
| Feb-2007 | 5,160 | 2,933 | 1,850 |
| Mar-2007 | 5,479 | 2,997 | 1,882 |
| Apr-2007 | 5,353 | 2,911 | 2,000 |
| May-2007 | 5,469 | 3,010 | 1,967 |
| Jun-2007 | 5,267 | 2,910 | 1,845 |
| Jul-2007 | 5,217 | 2,951 | 1,896 |
| Aug-2007 | 5,358 | 3,014 | 2,033 |
| Sep-2007 | 5,344 | 2,691 | 2,188 |
| Oct-2007 | 5,398 | 2,926 | 1,998 |
| Nov-2007 | 5,176 | 2,784 | 1,966 |
| Dec-2007 | 5,119 | 2,773 | 1,915 |
| Jan-2008 | 5,071 | 2,847 | 1,989 |
| Feb-2008 | 5,077 | 2,881 | 1,995 |
| Mar-2008 | 4,924 | 2,661 | 1,918 |
| Apr-2008 | 4,948 | 2,837 | 1,958 |
| May-2008 | 4,691 | 2,607 | 1,950 |
| Jun-2008 | 4,893 | 2,595 | 2,172 |
| Jul-2008 | 4,637 | 2,489 | 2,071 |
| Aug-2008 | 4,682 | 2,445 | 2,190 |
| Sep-2008 | 4,499 | 2,468 | 2,088 |
| Oct-2008 | 4,548 | 2,347 | 2,250 |
| Nov-2008 | 4,104 | 2,157 | 2,290 |
| Dec-2008 | 4,348 | 2,084 | 2,482 |
| Jan-2009 | 4,095 | 1,976 | 2,581 |
| Feb-2009 | 4,061 | 1,952 | 2,599 |
| Mar-2009 | 3,858 | 1,834 | 2,575 |
| Apr-2009 | 3,888 | 1,712 | 2,654 |
| May-2009 | 3,758 | 1,683 | 2,231 |
| Jun-2009 | 3,639 | 1,685 | 2,261 |
| Jul-2009 | 3,857 | 1,685 | 2,267 |
| Aug-2009 | 3,810 | 1,555 | 2,119 |
| Sep-2009 | 3,944 | 1,627 | 2,195 |
| Oct-2009 | 3,838 | 1,660 | 2,028 |
| Nov-2009 | 4,024 | 1,810 | 1,913 |
| Dec-2009 | 4,004 | 1,766 | 2,033 |
| Jan-2010 | 3,904 | 1,742 | 1,880 |
| Feb-2010 | 3,864 | 1,844 | 1,825 |
| Mar-2010 | 4,302 | 1,856 | 1,924 |
| Apr-2010 | 4,159 | 1,897 | 1,749 |
| May-2010 | 4,420 | 1,813 | 1,762 |
| Jun-2010 | 4,111 | 1,911 | 2,075 |
| Jul-2010 | 4,163 | 1,785 | 2,166 |
| Aug-2010 | 4,046 | 1,842 | 1,890 |
| Sep-2010 | 4,034 | 1,895 | 1,832 |
| Oct-2010 | 4,173 | 1,846 | 1,745 |
| Nov-2010 | 4,182 | 1,887 | 1,849 |
| Dec-2010 | 4,299 | 1,977 | 1,854 |
| Jan-2011 | 4,000 | 1,832 | 1,827 |
| Feb-2011 | 4,231 | 1,958 | 1,755 |
| Mar-2011 | 4,430 | 2,033 | 1,794 |
| Apr-2011 | 4,296 | 1,882 | 1,792 |
| May-2011 | 4,261 | 1,965 | 1,904 |
| Jun-2011 | 4,366 | 1,923 | 1,942 |
| Jul-2011 | 4,261 | 1,986 | 1,845 |
| Aug-2011 | 4,298 | 2,031 | 1,845 |
| Sep-2011 | 4,429 | 2,041 | 1,872 |
| Oct-2011 | 4,370 | 1,997 | 1,794 |
| Nov-2011 | 4,365 | 2,039 | 1,912 |
| Dec-2011 | 4,356 | 1,981 | 1,801 |
| Jan-2012 | 4,457 | 2,030 | 1,797 |
| Feb-2012 | 4,560 | 2,130 | 1,903 |
| Mar-2012 | 4,575 | 2,167 | 1,784 |
| Apr-2012 | 4,389 | 2,134 | 1,880 |
| May-2012 | 4,533 | 2,138 | 1,969 |
| Jun-2012 | 4,440 | 2,152 | 1,892 |
| Jul-2012 | 4,327 | 2,072 | 1,722 |
| Aug-2012 | 4,450 | 2,069 | 1,894 |
| Sep-2012 | 4,302 | 1,950 | 1,805 |
| Oct-2012 | 4,389 | 2,035 | 1,891 |
| Nov-2012 | 4,489 | 2,078 | 1,921 |
| Dec-2012 | 4,452 | 2,051 | 1,700 |
| Jan-2013 | 4,487 | 2,280 | 1,678 |
| Feb-2013 | 4,571 | 2,298 | 1,664 |
| Mar-2013 | 4,369 | 2,124 | 1,787 |
| Apr-2013 | 4,572 | 2,296 | 1,793 |
| May-2013 | 4,663 | 2,234 | 1,836 |
| Jun-2013 | 4,440 | 2,203 | 1,761 |
| Jul-2013 | 4,561 | 2,363 | 1,713 |
| Aug-2013 | 4,730 | 2,316 | 1,816 |
| Sep-2013 | 4,726 | 2,302 | 1,892 |
| Oct-2013 | 4,518 | 2,372 | 1,675 |
| Nov-2013 | 4,622 | 2,391 | 1,630 |
| Dec-2013 | 4,614 | 2,287 | 1,770 |
| Jan-2014 | 4,626 | 2,311 | 1,806 |
| Feb-2014 | 4,696 | 2,411 | 1,767 |
| Mar-2014 | 4,763 | 2,449 | 1,703 |
| Apr-2014 | 4,880 | 2,474 | 1,764 |
| May-2014 | 4,808 | 2,483 | 1,710 |
| Jun-2014 | 4,925 | 2,507 | 1,761 |
| Jul-2014 | 5,008 | 2,633 | 1,781 |
| Aug-2014 | 4,810 | 2,549 | 1,699 |
| Sep-2014 | 5,149 | 2,732 | 1,718 |
| Oct-2014 | 5,111 | 2,718 | 1,835 |
| Nov-2014 | 4,978 | 2,600 | 1,726 |
| Dec-2014 | 5,192 | 2,552 | 1,857 |
| Jan-2015 | 5,061 | 2,764 | 1,789 |
| Feb-2015 | 5,127 | 2,741 | 1,757 |
| Mar-2015 | 5,126 | 2,754 | 1,973 |
| Apr-2015 | 5,196 | 2,705 | 1,856 |
| May-2015 | 5,142 | 2,743 | 1,711 |
| Jun-2015 | 5,125 | 2,756 | 1,821 |
| Jul-2015 | 5,150 | 2,764 | 1,703 |
| Aug-2015 | 5,163 | 2,879 | 1,773 |
| Sep-2015 | 5,287 | 2,778 | 1,964 |
| Oct-2015 | 5,338 | 2,810 | 1,845 |
| Nov-2015 | 5,358 | 2,897 | 1,779 |
| Dec-2015 | 5,540 | 3,056 | 1,803 |
| Jan-2016 | 5,220 | 2,875 | 1,805 |
| Feb-2016 | 5,470 | 2,994 | 1,894 |
| Mar-2016 | 5,359 | 2,917 | 1,850 |
| Apr-2016 | 5,294 | 2,955 | 1,771 |
| May-2016 | 5,197 | 3,009 | 1,825 |
| Jun-2016 | 5,281 | 3,018 | 1,750 |
| Jul-2016 | 5,426 | 2,967 | 1,759 |
| Aug-2016 | 5,327 | 2,998 | 1,860 |
| Sep-2016 | 5,306 | 3,047 | 1,588 |
| Oct-2016 | 5,210 | 3,074 | 1,664 |
| Nov-2016 | 5,308 | 3,026 | 1,751 |
| Dec-2016 | 5,343 | 2,989 | 1,708 |
| Jan-2017 | 5,499 | 3,188 | 1,745 |
| Feb-2017 | 5,350 | 3,089 | 1,711 |
| Mar-2017 | 5,395 | 3,150 | 1,762 |
| Apr-2017 | 5,272 | 3,028 | 1,710 |
| May-2017 | 5,477 | 3,111 | 1,794 |
| Jun-2017 | 5,635 | 3,154 | 1,970 |
| Jul-2017 | 5,497 | 3,097 | 1,910 |
| Aug-2017 | 5,519 | 3,103 | 1,868 |
| Sep-2017 | 5,450 | 3,190 | 1,787 |
| Oct-2017 | 5,581 | 3,219 | 1,837 |
| Nov-2017 | 5,494 | 3,186 | 1,747 |
| Dec-2017 | 5,421 | 3,222 | 1,732 |
| Jan-2018 | 5,480 | 3,060 | 1,953 |
| Feb-2018 | 5,644 | 3,195 | 1,784 |
| Mar-2018 | 5,641 | 3,309 | 1,797 |
| Apr-2018 | 5,599 | 3,364 | 1,734 |
| May-2018 | 5,845 | 3,384 | 1,754 |
| Jun-2018 | 5,763 | 3,381 | 1,815 |
| Jul-2018 | 5,676 | 3,437 | 1,813 |
| Aug-2018 | 5,803 | 3,431 | 1,790 |
| Sep-2018 | 5,601 | 3,414 | 1,772 |
| Oct-2018 | 5,867 | 3,487 | 1,828 |
| Nov-2018 | 5,833 | 3,502 | 1,933 |
| Dec-2018 | 5,754 | 3,407 | 1,831 |
| Jan-2019 | 5,778 | 3,545 | 1,735 |
| Feb-2019 | 5,684 | 3,558 | 1,789 |
| Mar-2019 | 5,706 | 3,527 | 1,702 |
| Apr-2019 | 6,010 | 3,491 | 1,967 |
| May-2019 | 5,704 | 3,468 | 1,753 |
| Jun-2019 | 5,769 | 3,486 | 1,762 |
| Jul-2019 | 5,928 | 3,624 | 1,844 |
| Aug-2019 | 5,862 | 3,557 | 1,786 |
| Sep-2019 | 5,954 | 3,452 | 1,961 |
| Oct-2019 | 5,779 | 3,453 | 1,819 |
| Nov-2019 | 5,845 | 3,530 | 1,777 |
| Dec-2019 | 5,941 | 3,516 | 1,919 |
| Jan-2020 | 6,005 | 3,578 | 1,821 |
| Feb-2020 | 6,025 | 3,445 | 1,973 |
| Mar-2020 | 5,222 | 2,951 | 13,026 |
| Apr-2020 | 4,031 | 2,038 | 9,191 |
| May-2020 | 8,145 | 2,244 | 2,180 |
| Jun-2020 | 7,438 | 2,580 | 2,279 |
| Jul-2020 | 6,188 | 2,973 | 1,850 |
| Aug-2020 | 5,998 | 2,901 | 1,598 |
| Sep-2020 | 5,898 | 3,158 | 1,531 |
| Oct-2020 | 6,105 | 3,297 | 1,687 |
| Nov-2020 | 5,885 | 3,258 | 2,097 |
| Dec-2020 | 5,660 | 3,368 | 1,928 |
| Jan-2021 | 5,719 | 3,311 | 1,582 |
| Feb-2021 | 6,028 | 3,439 | 1,641 |
| Mar-2021 | 6,208 | 3,695 | 1,512 |
| Apr-2021 | 6,121 | 4,015 | 1,384 |
| May-2021 | 6,092 | 3,838 | 1,343 |
| Jun-2021 | 6,414 | 4,035 | 1,361 |
| Jul-2021 | 6,556 | 4,088 | 1,440 |
| Aug-2021 | 6,362 | 4,126 | 1,404 |
| Sep-2021 | 6,504 | 4,253 | 1,405 |
| Oct-2021 | 6,460 | 4,132 | 1,342 |
| Nov-2021 | 6,705 | 4,510 | 1,295 |
| Dec-2021 | 6,450 | 4,403 | 1,262 |
| Jan-2022 | 6,426 | 4,258 | 1,403 |
| Feb-2022 | 6,832 | 4,384 | 1,354 |
| Mar-2022 | 6,645 | 4,449 | 1,416 |
| Apr-2022 | 6,527 | 4,327 | 1,312 |
| May-2022 | 6,507 | 4,274 | 1,416 |
| Jun-2022 | 6,456 | 4,253 | 1,400 |
| Jul-2022 | 6,238 | 4,058 | 1,390 |
| Aug-2022 | 6,334 | 4,184 | 1,490 |
| Sep-2022 | 6,096 | 4,060 | 1,329 |
| Oct-2022 | 6,164 | 4,048 | 1,525 |
| Nov-2022 | 6,253 | 4,148 | 1,485 |
| Dec-2022 | 6,251 | 4,091 | 1,475 |
| Jan-2023 | 6,374 | 3,882 | 1,868 |
| Feb-2023 | 6,058 | 3,964 | 1,571 |
| Mar-2023 | 5,955 | 3,809 | 1,825 |
| Apr-2023 | 5,951 | 3,611 | 1,636 |
| May-2023 | 6,171 | 4,009 | 1,531 |
| Jun-2023 | 5,895 | 3,716 | 1,589 |
| Jul-2023 | 5,733 | 3,615 | 1,698 |
| Aug-2023 | 5,888 | 3,595 | 1,664 |
| Sep-2023 | 5,851 | 3,596 | 1,595 |
| Oct-2023 | 5,814 | 3,634 | 1,653 |
| Nov-2023 | 5,569 | 3,516 | 1,546 |
| Dec-2023 | 5,787 | 3,439 | 1,607 |
| Jan-2024 | 5,698 | 3,446 | 1,596 |
| Feb-2024 | 5,818 | 3,484 | 1,724 |
Note: Shaded areas denote recessions.
Source: EPI analysis of Bureau of Labor Statistics Job Openings and Labor Turnover Survey
The job-seekers ratio, 2000–2024
| Date | Job seekers ratio, imputed |
|---|---|
| 2000-12-01 | 1.11 |
| 2001-01-01 | 1.15 |
| 2001-02-01 | 1.19 |
| 2001-03-01 | 1.29 |
| 2001-04-01 | 1.36 |
| 2001-05-01 | 1.41 |
| 2001-06-01 | 1.49 |
| 2001-07-01 | 1.48 |
| 2001-08-01 | 1.75 |
| 2001-09-01 | 1.75 |
| 2001-10-01 | 2.08 |
| 2001-11-01 | 2.12 |
| 2001-12-01 | 2.25 |
| 2002-01-01 | 2.21 |
| 2002-02-01 | 2.39 |
| 2002-03-01 | 2.30 |
| 2002-04-01 | 2.48 |
| 2002-05-01 | 2.43 |
| 2002-06-01 | 2.46 |
| 2002-07-01 | 2.49 |
| 2002-08-01 | 2.36 |
| 2002-09-01 | 2.50 |
| 2002-10-01 | 2.39 |
| 2002-11-01 | 2.42 |
| 2002-12-01 | 2.73 |
| 2003-01-01 | 2.48 |
| 2003-02-01 | 2.67 |
| 2003-03-01 | 2.77 |
| 2003-04-01 | 2.84 |
| 2003-05-01 | 2.72 |
| 2003-06-01 | 2.73 |
| 2003-07-01 | 3.02 |
| 2003-08-01 | 2.79 |
| 2003-09-01 | 2.89 |
| 2003-10-01 | 2.64 |
| 2003-11-01 | 2.58 |
| 2003-12-01 | 2.44 |
| 2004-01-01 | 2.44 |
| 2004-02-01 | 2.31 |
| 2004-03-01 | 2.41 |
| 2004-04-01 | 2.33 |
| 2004-05-01 | 2.21 |
| 2004-06-01 | 2.48 |
| 2004-07-01 | 2.13 |
| 2004-08-01 | 2.26 |
| 2004-09-01 | 2.07 |
| 2004-10-01 | 2.04 |
| 2004-11-01 | 2.28 |
| 2004-12-01 | 1.95 |
| 2005-01-01 | 2.05 |
| 2005-02-01 | 2.01 |
| 2005-03-01 | 1.91 |
| 2005-04-01 | 1.84 |
| 2005-05-01 | 2.02 |
| 2005-06-01 | 1.85 |
| 2005-07-01 | 1.74 |
| 2005-08-01 | 1.77 |
| 2005-09-01 | 1.74 |
| 2005-10-01 | 1.78 |
| 2005-11-01 | 1.78 |
| 2005-12-01 | 1.70 |
| 2006-01-01 | 1.61 |
| 2006-02-01 | 1.66 |
| 2006-03-01 | 1.49 |
| 2006-04-01 | 1.49 |
| 2006-05-01 | 1.56 |
| 2006-06-01 | 1.52 |
| 2006-07-01 | 1.63 |
| 2006-08-01 | 1.51 |
| 2006-09-01 | 1.45 |
| 2006-10-01 | 1.47 |
| 2006-11-01 | 1.48 |
| 2006-12-01 | 1.46 |
| 2007-01-01 | 1.49 |
| 2007-02-01 | 1.47 |
| 2007-03-01 | 1.36 |
| 2007-04-01 | 1.46 |
| 2007-05-01 | 1.45 |
| 2007-06-01 | 1.44 |
| 2007-07-01 | 1.55 |
| 2007-08-01 | 1.55 |
| 2007-09-01 | 1.54 |
| 2007-10-01 | 1.56 |
| 2007-11-01 | 1.56 |
| 2007-12-01 | 1.68 |
| 2008-01-01 | 1.66 |
| 2008-02-01 | 1.75 |
| 2008-03-01 | 1.85 |
| 2008-04-01 | 1.89 |
| 2008-05-01 | 2.00 |
| 2008-06-01 | 2.24 |
| 2008-07-01 | 2.38 |
| 2008-08-01 | 2.57 |
| 2008-09-01 | 2.95 |
| 2008-10-01 | 2.98 |
| 2008-11-01 | 3.26 |
| 2008-12-01 | 3.59 |
| 2009-01-01 | 4.40 |
| 2009-02-01 | 4.50 |
| 2009-03-01 | 5.30 |
| 2009-04-01 | 6.04 |
| 2009-05-01 | 5.69 |
| 2009-06-01 | 5.88 |
| 2009-07-01 | 6.54 |
| 2009-08-01 | 6.34 |
| 2009-09-01 | 6.03 |
| 2009-10-01 | 6.38 |
| 2009-11-01 | 6.08 |
| 2009-12-01 | 5.88 |
| 2010-01-01 | 5.30 |
| 2010-02-01 | 5.67 |
| 2010-03-01 | 5.67 |
| 2010-04-01 | 4.86 |
| 2010-05-01 | 4.97 |
| 2010-06-01 | 5.17 |
| 2010-07-01 | 4.71 |
| 2010-08-01 | 4.88 |
| 2010-09-01 | 5.00 |
| 2010-10-01 | 4.49 |
| 2010-11-01 | 4.70 |
| 2010-12-01 | 4.69 |
| 2011-01-01 | 4.51 |
| 2011-02-01 | 4.28 |
| 2011-03-01 | 4.21 |
| 2011-04-01 | 4.28 |
| 2011-05-01 | 4.36 |
| 2011-06-01 | 4.04 |
| 2011-07-01 | 3.80 |
| 2011-08-01 | 4.15 |
| 2011-09-01 | 3.70 |
| 2011-10-01 | 3.76 |
| 2011-11-01 | 3.73 |
| 2011-12-01 | 3.47 |
| 2012-01-01 | 3.27 |
| 2012-02-01 | 3.54 |
| 2012-03-01 | 3.20 |
| 2012-04-01 | 3.33 |
| 2012-05-01 | 3.30 |
| 2012-06-01 | 3.25 |
| 2012-07-01 | 3.39 |
| 2012-08-01 | 3.27 |
| 2012-09-01 | 3.12 |
| 2012-10-01 | 3.21 |
| 2012-11-01 | 3.10 |
| 2012-12-01 | 3.10 |
| 2013-01-01 | 3.18 |
| 2013-02-01 | 2.98 |
| 2013-03-01 | 2.87 |
| 2013-04-01 | 2.95 |
| 2013-05-01 | 2.81 |
| 2013-06-01 | 2.83 |
| 2013-07-01 | 2.92 |
| 2013-08-01 | 2.76 |
| 2013-09-01 | 2.73 |
| 2013-10-01 | 2.64 |
| 2013-11-01 | 2.62 |
| 2013-12-01 | 2.52 |
| 2014-01-01 | 2.47 |
| 2014-02-01 | 2.37 |
| 2014-03-01 | 2.37 |
| 2014-04-01 | 2.12 |
| 2014-05-01 | 2.08 |
| 2014-06-01 | 1.90 |
| 2014-07-01 | 1.98 |
| 2014-08-01 | 1.79 |
| 2014-09-01 | 1.88 |
| 2014-10-01 | 1.79 |
| 2014-11-01 | 1.88 |
| 2014-12-01 | 1.70 |
| 2015-01-01 | 1.66 |
| 2015-02-01 | 1.57 |
| 2015-03-01 | 1.63 |
| 2015-04-01 | 1.53 |
| 2015-05-01 | 1.59 |
| 2015-06-01 | 1.57 |
| 2015-07-01 | 1.35 |
| 2015-08-01 | 1.46 |
| 2015-09-01 | 1.44 |
| 2015-10-01 | 1.37 |
| 2015-11-01 | 1.40 |
| 2015-12-01 | 1.35 |
| 2016-01-01 | 1.27 |
| 2016-02-01 | 1.33 |
| 2016-03-01 | 1.30 |
| 2016-04-01 | 1.39 |
| 2016-05-01 | 1.32 |
| 2016-06-01 | 1.35 |
| 2016-07-01 | 1.28 |
| 2016-08-01 | 1.37 |
| 2016-09-01 | 1.36 |
| 2016-10-01 | 1.40 |
| 2016-11-01 | 1.26 |
| 2016-12-01 | 1.26 |
| 2017-01-01 | 1.33 |
| 2017-02-01 | 1.25 |
| 2017-03-01 | 1.22 |
| 2017-04-01 | 1.16 |
| 2017-05-01 | 1.20 |
| 2017-06-01 | 1.09 |
| 2017-07-01 | 1.10 |
| 2017-08-01 | 1.13 |
| 2017-09-01 | 1.08 |
| 2017-10-01 | 1.05 |
| 2017-11-01 | 1.08 |
| 2017-12-01 | 1.05 |
| 2018-01-01 | 0.99 |
| 2018-02-01 | 1.00 |
| 2018-03-01 | 0.95 |
| 2018-04-01 | 0.93 |
| 2018-05-01 | 0.88 |
| 2018-06-01 | 0.89 |
| 2018-07-01 | 0.86 |
| 2018-08-01 | 0.86 |
| 2018-09-01 | 0.83 |
| 2018-10-01 | 0.85 |
| 2018-11-01 | 0.81 |
| 2018-12-01 | 0.86 |
| 2019-01-01 | 0.86 |
| 2019-02-01 | 0.87 |
| 2019-03-01 | 0.84 |
| 2019-04-01 | 0.82 |
| 2019-05-01 | 0.81 |
| 2019-06-01 | 0.83 |
| 2019-07-01 | 0.85 |
| 2019-08-01 | 0.84 |
| 2019-09-01 | 0.81 |
| 2019-10-01 | 0.81 |
| 2019-11-01 | 0.86 |
| 2019-12-01 | 0.87 |
| 2020-01-01 | 0.81 |
| 2020-02-01 | 0.82 |
| 2020-03-01 | 1.21 |
| 2020-04-01 | 4.89 |
| 2020-05-01 | 3.85 |
| 2020-06-01 | 2.92 |
| 2020-07-01 | 2.46 |
| 2020-08-01 | 2.14 |
| 2020-09-01 | 1.94 |
| 2020-10-01 | 1.62 |
| 2020-11-01 | 1.57 |
| 2020-12-01 | 1.56 |
| 2021-01-01 | 1.41 |
| 2021-02-01 | 1.27 |
| 2021-03-01 | 1.14 |
| 2021-04-01 | 1.05 |
| 2021-05-01 | 0.96 |
| 2021-06-01 | 0.96 |
| 2021-07-01 | 0.80 |
| 2021-08-01 | 0.78 |
| 2021-09-01 | 0.72 |
| 2021-10-01 | 0.66 |
| 2021-11-01 | 0.62 |
| 2021-12-01 | 0.55 |
| 2022-01-01 | 0.58 |
| 2022-02-01 | 0.55 |
| 2022-03-01 | 0.50 |
| 2022-04-01 | 0.51 |
| 2022-05-01 | 0.53 |
| 2022-06-01 | 0.54 |
| 2022-07-01 | 0.51 |
| 2022-08-01 | 0.59 |
| 2022-09-01 | 0.53 |
| 2022-10-01 | 0.58 |
| 2022-11-01 | 0.56 |
| 2022-12-01 | 0.51 |
| 2023-01-01 | 0.55 |
| 2023-02-01 | 0.61 |
| 2023-03-01 | 0.61 |
| 2023-04-01 | 0.58 |
| 2023-05-01 | 0.66 |
| 2023-06-01 | 0.66 |
| 2023-07-01 | 0.67 |
| 2023-08-01 | 0.68 |
| 2023-09-01 | 0.68 |
| 2023-10-01 | 0.74 |
| 2023-11-01 | 0.70 |
| 2023-12-01 | 0.71 |
| 2024-01-01 | 0.70 |
| 2024-02-01 | 0.74 |
Notes: Shaded areas denote recessions. Unemployment levels represent the average of the unemployment level for the current month.
Source: EPI analysis of Bureau of Labor Statistics Job Openings and Labor Turnover Survey and Current Population Survey.
Hires are greater than quits in all sectors while lower wage sectors experience higher levels of quits and hires: Hires and quits rates by major sector, February 2024
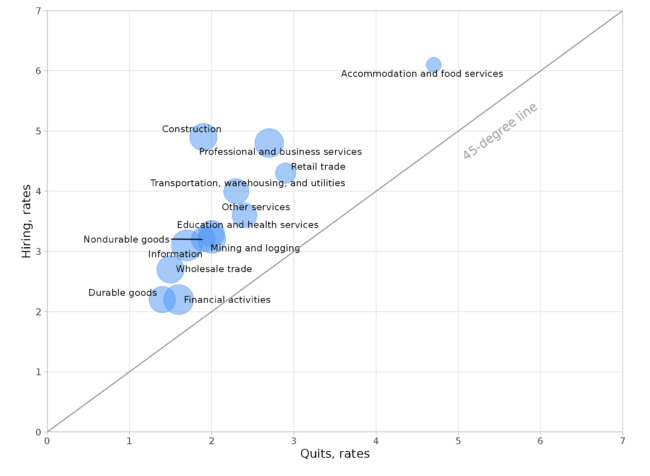
Notes: Data provided for all sectors with complementary information on both hires and quits rates for Job Openings and Labor Turnover Survey (x- and y-axis data) and private sector hourly wage rates from the Current Establishment Survey for the corresponding month (data for size of bubbles); 45 degree line represent data where hires rates are equal to quits rates in each sector.
Source: EPI analysis of Bureau of Labor Statistics Job Openings and Labor Turnover Survey and Current Employment Survey public data series.
Job openings levels and unemployment levels, 2000–2024
| date | Openings | Unemployment, two-month average |
|---|---|---|
| 2000-12-01 | 5,088 | 5,634 |
| 2001-01-01 | 5,234 | 6,023 |
| 2001-02-01 | 5,097 | 6,089 |
| 2001-03-01 | 4,762 | 6,141 |
| 2001-04-01 | 4,615 | 6,271 |
| 2001-05-01 | 4,425 | 6,226 |
| 2001-06-01 | 4,361 | 6,484 |
| 2001-07-01 | 4,447 | 6,583 |
| 2001-08-01 | 4,024 | 7,042 |
| 2001-09-01 | 4,071 | 7,142 |
| 2001-10-01 | 3,707 | 7,694 |
| 2001-11-01 | 3,775 | 8,003 |
| 2001-12-01 | 3,677 | 8,258 |
| 2002-01-01 | 3,699 | 8,182 |
| 2002-02-01 | 3,436 | 8,215 |
| 2002-03-01 | 3,612 | 8,304 |
| 2002-04-01 | 3,471 | 8,599 |
| 2002-05-01 | 3,457 | 8,399 |
| 2002-06-01 | 3,412 | 8,393 |
| 2002-07-01 | 3,367 | 8,390 |
| 2002-08-01 | 3,517 | 8,304 |
| 2002-09-01 | 3,301 | 8,251 |
| 2002-10-01 | 3,479 | 8,307 |
| 2002-11-01 | 3,514 | 8,520 |
| 2002-12-01 | 3,169 | 8,640 |
| 2003-01-01 | 3,441 | 8,520 |
| 2003-02-01 | 3,229 | 8,618 |
| 2003-03-01 | 3,099 | 8,588 |
| 2003-04-01 | 3,108 | 8,842 |
| 2003-05-01 | 3,289 | 8,957 |
| 2003-06-01 | 3,390 | 9,266 |
| 2003-07-01 | 2,981 | 9,011 |
| 2003-08-01 | 3,190 | 8,896 |
| 2003-09-01 | 3,091 | 8,921 |
| 2003-10-01 | 3,305 | 8,732 |
| 2003-11-01 | 3,324 | 8,576 |
| 2003-12-01 | 3,414 | 8,317 |
| 2004-01-01 | 3,424 | 8,370 |
| 2004-02-01 | 3,532 | 8,167 |
| 2004-03-01 | 3,525 | 8,491 |
| 2004-04-01 | 3,511 | 8,170 |
| 2004-05-01 | 3,710 | 8,212 |
| 2004-06-01 | 3,337 | 8,286 |
| 2004-07-01 | 3,814 | 8,136 |
| 2004-08-01 | 3,541 | 7,990 |
| 2004-09-01 | 3,821 | 7,927 |
| 2004-10-01 | 3,943 | 8,061 |
| 2004-11-01 | 3,472 | 7,932 |
| 2004-12-01 | 4,074 | 7,934 |
| 2005-01-01 | 3,804 | 7,784 |
| 2005-02-01 | 3,965 | 7,980 |
| 2005-03-01 | 4,044 | 7,737 |
| 2005-04-01 | 4,159 | 7,672 |
| 2005-05-01 | 3,797 | 7,651 |
| 2005-06-01 | 4,062 | 7,524 |
| 2005-07-01 | 4,256 | 7,406 |
| 2005-08-01 | 4,142 | 7,345 |
| 2005-09-01 | 4,352 | 7,553 |
| 2005-10-01 | 4,184 | 7,453 |
| 2005-11-01 | 4,248 | 7,566 |
| 2005-12-01 | 4,282 | 7,279 |
| 2006-01-01 | 4,397 | 7,064 |
| 2006-02-01 | 4,325 | 7,184 |
| 2006-03-01 | 4,732 | 7,072 |
| 2006-04-01 | 4,790 | 7,120 |
| 2006-05-01 | 4,463 | 6,980 |
| 2006-06-01 | 4,614 | 7,001 |
| 2006-07-01 | 4,394 | 7,175 |
| 2006-08-01 | 4,710 | 7,091 |
| 2006-09-01 | 4,737 | 6,847 |
| 2006-10-01 | 4,591 | 6,727 |
| 2006-11-01 | 4,645 | 6,872 |
| 2006-12-01 | 4,620 | 6,762 |
| 2007-01-01 | 4,763 | 7,116 |
| 2007-02-01 | 4,699 | 6,927 |
| 2007-03-01 | 4,962 | 6,731 |
| 2007-04-01 | 4,689 | 6,850 |
| 2007-05-01 | 4,657 | 6,766 |
| 2007-06-01 | 4,859 | 6,979 |
| 2007-07-01 | 4,598 | 7,149 |
| 2007-08-01 | 4,546 | 7,067 |
| 2007-09-01 | 4,652 | 7,170 |
| 2007-10-01 | 4,636 | 7,237 |
| 2007-11-01 | 4,646 | 7,240 |
| 2007-12-01 | 4,545 | 7,645 |
| 2008-01-01 | 4,624 | 7,685 |
| 2008-02-01 | 4,279 | 7,497 |
| 2008-03-01 | 4,225 | 7,822 |
| 2008-04-01 | 4,035 | 7,637 |
| 2008-05-01 | 4,194 | 8,395 |
| 2008-06-01 | 3,830 | 8,575 |
| 2008-07-01 | 3,749 | 8,937 |
| 2008-08-01 | 3,674 | 9,438 |
| 2008-09-01 | 3,222 | 9,494 |
| 2008-10-01 | 3,377 | 10,074 |
| 2008-11-01 | 3,231 | 10,538 |
| 2008-12-01 | 3,146 | 11,286 |
| 2009-01-01 | 2,738 | 12,058 |
| 2009-02-01 | 2,864 | 12,898 |
| 2009-03-01 | 2,534 | 13,426 |
| 2009-04-01 | 2,295 | 13,853 |
| 2009-05-01 | 2,549 | 14,499 |
| 2009-06-01 | 2,503 | 14,707 |
| 2009-07-01 | 2,232 | 14,601 |
| 2009-08-01 | 2,338 | 14,814 |
| 2009-09-01 | 2,487 | 15,009 |
| 2009-10-01 | 2,406 | 15,352 |
| 2009-11-01 | 2,503 | 15,219 |
| 2009-12-01 | 2,568 | 15,098 |
| 2010-01-01 | 2,837 | 15,046 |
| 2010-02-01 | 2,666 | 15,113 |
| 2010-03-01 | 2,679 | 15,202 |
| 2010-04-01 | 3,153 | 15,325 |
| 2010-05-01 | 2,988 | 14,849 |
| 2010-06-01 | 2,801 | 14,474 |
| 2010-07-01 | 3,082 | 14,512 |
| 2010-08-01 | 2,999 | 14,648 |
| 2010-09-01 | 2,918 | 14,579 |
| 2010-10-01 | 3,235 | 14,516 |
| 2010-11-01 | 3,211 | 15,081 |
| 2010-12-01 | 3,058 | 14,348 |
| 2011-01-01 | 3,104 | 14,013 |
| 2011-02-01 | 3,226 | 13,820 |
| 2011-03-01 | 3,261 | 13,737 |
| 2011-04-01 | 3,259 | 13,957 |
| 2011-05-01 | 3,179 | 13,855 |
| 2011-06-01 | 3,455 | 13,962 |
| 2011-07-01 | 3,623 | 13,763 |
| 2011-08-01 | 3,329 | 13,818 |
| 2011-09-01 | 3,774 | 13,948 |
| 2011-10-01 | 3,619 | 13,594 |
| 2011-11-01 | 3,565 | 13,302 |
| 2011-12-01 | 3,768 | 13,093 |
| 2012-01-01 | 3,909 | 12,797 |
| 2012-02-01 | 3,616 | 12,813 |
| 2012-03-01 | 3,979 | 12,713 |
| 2012-04-01 | 3,793 | 12,646 |
| 2012-05-01 | 3,835 | 12,660 |
| 2012-06-01 | 3,911 | 12,692 |
| 2012-07-01 | 3,735 | 12,656 |
| 2012-08-01 | 3,809 | 12,471 |
| 2012-09-01 | 3,882 | 12,115 |
| 2012-10-01 | 3,775 | 12,124 |
| 2012-11-01 | 3,878 | 12,005 |
| 2012-12-01 | 3,970 | 12,298 |
| 2013-01-01 | 3,923 | 12,471 |
| 2013-02-01 | 4,004 | 11,950 |
| 2013-03-01 | 4,076 | 11,689 |
| 2013-04-01 | 3,988 | 11,760 |
| 2013-05-01 | 4,145 | 11,654 |
| 2013-06-01 | 4,150 | 11,751 |
| 2013-07-01 | 3,885 | 11,335 |
| 2013-08-01 | 4,085 | 11,279 |
| 2013-09-01 | 4,128 | 11,270 |
| 2013-10-01 | 4,222 | 11,136 |
| 2013-11-01 | 4,119 | 10,787 |
| 2013-12-01 | 4,121 | 10,404 |
| 2014-01-01 | 4,127 | 10,202 |
| 2014-02-01 | 4,373 | 10,349 |
| 2014-03-01 | 4,388 | 10,380 |
| 2014-04-01 | 4,566 | 9,702 |
| 2014-05-01 | 4,747 | 9,859 |
| 2014-06-01 | 4,982 | 9,460 |
| 2014-07-01 | 4,846 | 9,608 |
| 2014-08-01 | 5,349 | 9,599 |
| 2014-09-01 | 4,914 | 9,262 |
| 2014-10-01 | 5,012 | 8,990 |
| 2014-11-01 | 4,843 | 9,090 |
| 2014-12-01 | 5,130 | 8,717 |
| 2015-01-01 | 5,344 | 8,885 |
| 2015-02-01 | 5,466 | 8,599 |
| 2015-03-01 | 5,210 | 8,515 |
| 2015-04-01 | 5,598 | 8,550 |
| 2015-05-01 | 5,563 | 8,834 |
| 2015-06-01 | 5,248 | 8,247 |
| 2015-07-01 | 6,056 | 8,167 |
| 2015-08-01 | 5,467 | 7,992 |
| 2015-09-01 | 5,488 | 7,907 |
| 2015-10-01 | 5,773 | 7,922 |
| 2015-11-01 | 5,708 | 8,000 |
| 2015-12-01 | 5,845 | 7,907 |
| 2016-01-01 | 6,012 | 7,627 |
| 2016-02-01 | 5,770 | 7,702 |
| 2016-03-01 | 6,129 | 7,961 |
| 2016-04-01 | 5,803 | 8,067 |
| 2016-05-01 | 5,777 | 7,652 |
| 2016-06-01 | 5,742 | 7,744 |
| 2016-07-01 | 5,962 | 7,641 |
| 2016-08-01 | 5,677 | 7,784 |
| 2016-09-01 | 5,868 | 7,953 |
| 2016-10-01 | 5,591 | 7,811 |
| 2016-11-01 | 5,971 | 7,553 |
| 2016-12-01 | 5,964 | 7,521 |
| 2017-01-01 | 5,617 | 7,468 |
| 2017-02-01 | 5,923 | 7,379 |
| 2017-03-01 | 5,811 | 7,073 |
| 2017-04-01 | 6,091 | 7,089 |
| 2017-05-01 | 5,826 | 7,000 |
| 2017-06-01 | 6,305 | 6,873 |
| 2017-07-01 | 6,238 | 6,892 |
| 2017-08-01 | 6,276 | 7,082 |
| 2017-09-01 | 6,320 | 6,854 |
| 2017-10-01 | 6,408 | 6,700 |
| 2017-11-01 | 6,271 | 6,774 |
| 2017-12-01 | 6,336 | 6,632 |
| 2018-01-01 | 6,621 | 6,489 |
| 2018-02-01 | 6,552 | 6,581 |
| 2018-03-01 | 6,818 | 6,472 |
| 2018-04-01 | 6,877 | 6,459 |
| 2018-05-01 | 7,016 | 6,196 |
| 2018-06-01 | 7,230 | 6,447 |
| 2018-07-01 | 7,190 | 6,195 |
| 2018-08-01 | 7,208 | 6,156 |
| 2018-09-01 | 7,411 | 6,073 |
| 2018-10-01 | 7,304 | 6,211 |
| 2018-11-01 | 7,594 | 6,115 |
| 2018-12-01 | 7,489 | 6,389 |
| 2019-01-01 | 7,517 | 6,439 |
| 2019-02-01 | 7,072 | 6,115 |
| 2019-03-01 | 7,337 | 6,182 |
| 2019-04-01 | 7,191 | 5,911 |
| 2019-05-01 | 7,311 | 5,941 |
| 2019-06-01 | 7,139 | 5,909 |
| 2019-07-01 | 7,051 | 6,008 |
| 2019-08-01 | 7,172 | 5,981 |
| 2019-09-01 | 7,160 | 5,775 |
| 2019-10-01 | 7,325 | 5,957 |
| 2019-11-01 | 6,919 | 5,911 |
| 2019-12-01 | 6,709 | 5,870 |
| 2020-01-01 | 7,184 | 5,804 |
| 2020-02-01 | 6,995 | 5,708 |
| 2020-03-01 | 5,794 | 7,184 |
| 2020-04-01 | 4,686 | 23,050 |
| 2020-05-01 | 5,581 | 20,939 |
| 2020-06-01 | 6,119 | 17,624 |
| 2020-07-01 | 6,514 | 16,324 |
| 2020-08-01 | 6,360 | 13,521 |
| 2020-09-01 | 6,512 | 12,599 |
| 2020-10-01 | 6,820 | 11,090 |
| 2020-11-01 | 6,875 | 10,760 |
| 2020-12-01 | 6,854 | 10,795 |
| 2021-01-01 | 7,175 | 10,155 |
| 2021-02-01 | 7,760 | 9,982 |
| 2021-03-01 | 8,399 | 9,712 |
| 2021-04-01 | 9,288 | 9,737 |
| 2021-05-01 | 9,840 | 9,257 |
| 2021-06-01 | 10,069 | 9,508 |
| 2021-07-01 | 10,882 | 8,704 |
| 2021-08-01 | 10,960 | 8,324 |
| 2021-09-01 | 10,882 | 7,677 |
| 2021-10-01 | 11,368 | 7,345 |
| 2021-11-01 | 11,232 | 6,780 |
| 2021-12-01 | 11,826 | 6,329 |
| 2022-01-01 | 11,487 | 6,511 |
| 2022-02-01 | 11,601 | 6,272 |
| 2022-03-01 | 12,027 | 5,972 |
| 2022-04-01 | 11,755 | 5,968 |
| 2022-05-01 | 11,443 | 5,979 |
| 2022-06-01 | 10,961 | 5,945 |
| 2022-07-01 | 11,380 | 5,718 |
| 2022-08-01 | 10,198 | 6,021 |
| 2022-09-01 | 10,854 | 5,770 |
| 2022-10-01 | 10,471 | 6,053 |
| 2022-11-01 | 10,746 | 6,000 |
| 2022-12-01 | 11,234 | 5,722 |
| 2023-01-01 | 10,425 | 5,719 |
| 2023-02-01 | 9,849 | 5,962 |
| 2023-03-01 | 9,623 | 5,866 |
| 2023-04-01 | 9,904 | 5,715 |
| 2023-05-01 | 9,311 | 6,117 |
| 2023-06-01 | 9,125 | 5,997 |
| 2023-07-01 | 8,805 | 5,904 |
| 2023-08-01 | 9,358 | 6,340 |
| 2023-09-01 | 9,307 | 6,347 |
| 2023-10-01 | 8,685 | 6,443 |
| 2023-11-01 | 8,931 | 6,262 |
| 2023-12-01 | 8,889 | 6,268 |
| 2024-01-01 | 8,748 | 6,124 |
| 2024-02-01 | 8,756 | 6,458 |
Notes: Shaded areas denote recessions. Unemployment levels represent the average of the unemployment level for the current month and the subsequent month in the Current Population Survey to better line up with the job openings data from the Job Openings and Labor Turnover Survey.
Source: EPI analysis of Bureau of Labor Statistics Job Openings and Labor Turnover Survey and Current Population Survey. Unemployment levels represent the average of the unemployment level for the current month and the subsequent month to better line up with the job openings data.
Job openings levels, 2000–2024
| date | Openings |
|---|---|
| 2000-12-01 | 5,088 |
| 2001-01-01 | 5,234 |
| 2001-02-01 | 5,097 |
| 2001-03-01 | 4,762 |
| 2001-04-01 | 4,615 |
| 2001-05-01 | 4,425 |
| 2001-06-01 | 4,361 |
| 2001-07-01 | 4,447 |
| 2001-08-01 | 4,024 |
| 2001-09-01 | 4,071 |
| 2001-10-01 | 3,707 |
| 2001-11-01 | 3,775 |
| 2001-12-01 | 3,677 |
| 2002-01-01 | 3,699 |
| 2002-02-01 | 3,436 |
| 2002-03-01 | 3,612 |
| 2002-04-01 | 3,471 |
| 2002-05-01 | 3,457 |
| 2002-06-01 | 3,412 |
| 2002-07-01 | 3,367 |
| 2002-08-01 | 3,517 |
| 2002-09-01 | 3,301 |
| 2002-10-01 | 3,479 |
| 2002-11-01 | 3,514 |
| 2002-12-01 | 3,169 |
| 2003-01-01 | 3,441 |
| 2003-02-01 | 3,229 |
| 2003-03-01 | 3,099 |
| 2003-04-01 | 3,108 |
| 2003-05-01 | 3,289 |
| 2003-06-01 | 3,390 |
| 2003-07-01 | 2,981 |
| 2003-08-01 | 3,190 |
| 2003-09-01 | 3,091 |
| 2003-10-01 | 3,305 |
| 2003-11-01 | 3,324 |
| 2003-12-01 | 3,414 |
| 2004-01-01 | 3,424 |
| 2004-02-01 | 3,532 |
| 2004-03-01 | 3,525 |
| 2004-04-01 | 3,511 |
| 2004-05-01 | 3,710 |
| 2004-06-01 | 3,337 |
| 2004-07-01 | 3,814 |
| 2004-08-01 | 3,541 |
| 2004-09-01 | 3,821 |
| 2004-10-01 | 3,943 |
| 2004-11-01 | 3,472 |
| 2004-12-01 | 4,074 |
| 2005-01-01 | 3,804 |
| 2005-02-01 | 3,965 |
| 2005-03-01 | 4,044 |
| 2005-04-01 | 4,159 |
| 2005-05-01 | 3,797 |
| 2005-06-01 | 4,062 |
| 2005-07-01 | 4,256 |
| 2005-08-01 | 4,142 |
| 2005-09-01 | 4,352 |
| 2005-10-01 | 4,184 |
| 2005-11-01 | 4,248 |
| 2005-12-01 | 4,282 |
| 2006-01-01 | 4,397 |
| 2006-02-01 | 4,325 |
| 2006-03-01 | 4,732 |
| 2006-04-01 | 4,790 |
| 2006-05-01 | 4,463 |
| 2006-06-01 | 4,614 |
| 2006-07-01 | 4,394 |
| 2006-08-01 | 4,710 |
| 2006-09-01 | 4,737 |
| 2006-10-01 | 4,591 |
| 2006-11-01 | 4,645 |
| 2006-12-01 | 4,620 |
| 2007-01-01 | 4,763 |
| 2007-02-01 | 4,699 |
| 2007-03-01 | 4,962 |
| 2007-04-01 | 4,689 |
| 2007-05-01 | 4,657 |
| 2007-06-01 | 4,859 |
| 2007-07-01 | 4,598 |
| 2007-08-01 | 4,546 |
| 2007-09-01 | 4,652 |
| 2007-10-01 | 4,636 |
| 2007-11-01 | 4,646 |
| 2007-12-01 | 4,545 |
| 2008-01-01 | 4,624 |
| 2008-02-01 | 4,279 |
| 2008-03-01 | 4,225 |
| 2008-04-01 | 4,035 |
| 2008-05-01 | 4,194 |
| 2008-06-01 | 3,830 |
| 2008-07-01 | 3,749 |
| 2008-08-01 | 3,674 |
| 2008-09-01 | 3,222 |
| 2008-10-01 | 3,377 |
| 2008-11-01 | 3,231 |
| 2008-12-01 | 3,146 |
| 2009-01-01 | 2,738 |
| 2009-02-01 | 2,864 |
| 2009-03-01 | 2,534 |
| 2009-04-01 | 2,295 |
| 2009-05-01 | 2,549 |
| 2009-06-01 | 2,503 |
| 2009-07-01 | 2,232 |
| 2009-08-01 | 2,338 |
| 2009-09-01 | 2,487 |
| 2009-10-01 | 2,406 |
| 2009-11-01 | 2,503 |
| 2009-12-01 | 2,568 |
| 2010-01-01 | 2,837 |
| 2010-02-01 | 2,666 |
| 2010-03-01 | 2,679 |
| 2010-04-01 | 3,153 |
| 2010-05-01 | 2,988 |
| 2010-06-01 | 2,801 |
| 2010-07-01 | 3,082 |
| 2010-08-01 | 2,999 |
| 2010-09-01 | 2,918 |
| 2010-10-01 | 3,235 |
| 2010-11-01 | 3,211 |
| 2010-12-01 | 3,058 |
| 2011-01-01 | 3,104 |
| 2011-02-01 | 3,226 |
| 2011-03-01 | 3,261 |
| 2011-04-01 | 3,259 |
| 2011-05-01 | 3,179 |
| 2011-06-01 | 3,455 |
| 2011-07-01 | 3,623 |
| 2011-08-01 | 3,329 |
| 2011-09-01 | 3,774 |
| 2011-10-01 | 3,619 |
| 2011-11-01 | 3,565 |
| 2011-12-01 | 3,768 |
| 2012-01-01 | 3,909 |
| 2012-02-01 | 3,616 |
| 2012-03-01 | 3,979 |
| 2012-04-01 | 3,793 |
| 2012-05-01 | 3,835 |
| 2012-06-01 | 3,911 |
| 2012-07-01 | 3,735 |
| 2012-08-01 | 3,809 |
| 2012-09-01 | 3,882 |
| 2012-10-01 | 3,775 |
| 2012-11-01 | 3,878 |
| 2012-12-01 | 3,970 |
| 2013-01-01 | 3,923 |
| 2013-02-01 | 4,004 |
| 2013-03-01 | 4,076 |
| 2013-04-01 | 3,988 |
| 2013-05-01 | 4,145 |
| 2013-06-01 | 4,150 |
| 2013-07-01 | 3,885 |
| 2013-08-01 | 4,085 |
| 2013-09-01 | 4,128 |
| 2013-10-01 | 4,222 |
| 2013-11-01 | 4,119 |
| 2013-12-01 | 4,121 |
| 2014-01-01 | 4,127 |
| 2014-02-01 | 4,373 |
| 2014-03-01 | 4,388 |
| 2014-04-01 | 4,566 |
| 2014-05-01 | 4,747 |
| 2014-06-01 | 4,982 |
| 2014-07-01 | 4,846 |
| 2014-08-01 | 5,349 |
| 2014-09-01 | 4,914 |
| 2014-10-01 | 5,012 |
| 2014-11-01 | 4,843 |
| 2014-12-01 | 5,130 |
| 2015-01-01 | 5,344 |
| 2015-02-01 | 5,466 |
| 2015-03-01 | 5,210 |
| 2015-04-01 | 5,598 |
| 2015-05-01 | 5,563 |
| 2015-06-01 | 5,248 |
| 2015-07-01 | 6,056 |
| 2015-08-01 | 5,467 |
| 2015-09-01 | 5,488 |
| 2015-10-01 | 5,773 |
| 2015-11-01 | 5,708 |
| 2015-12-01 | 5,845 |
| 2016-01-01 | 6,012 |
| 2016-02-01 | 5,770 |
| 2016-03-01 | 6,129 |
| 2016-04-01 | 5,803 |
| 2016-05-01 | 5,777 |
| 2016-06-01 | 5,742 |
| 2016-07-01 | 5,962 |
| 2016-08-01 | 5,677 |
| 2016-09-01 | 5,868 |
| 2016-10-01 | 5,591 |
| 2016-11-01 | 5,971 |
| 2016-12-01 | 5,964 |
| 2017-01-01 | 5,617 |
| 2017-02-01 | 5,923 |
| 2017-03-01 | 5,811 |
| 2017-04-01 | 6,091 |
| 2017-05-01 | 5,826 |
| 2017-06-01 | 6,305 |
| 2017-07-01 | 6,238 |
| 2017-08-01 | 6,276 |
| 2017-09-01 | 6,320 |
| 2017-10-01 | 6,408 |
| 2017-11-01 | 6,271 |
| 2017-12-01 | 6,336 |
| 2018-01-01 | 6,621 |
| 2018-02-01 | 6,552 |
| 2018-03-01 | 6,818 |
| 2018-04-01 | 6,877 |
| 2018-05-01 | 7,016 |
| 2018-06-01 | 7,230 |
| 2018-07-01 | 7,190 |
| 2018-08-01 | 7,208 |
| 2018-09-01 | 7,411 |
| 2018-10-01 | 7,304 |
| 2018-11-01 | 7,594 |
| 2018-12-01 | 7,489 |
| 2019-01-01 | 7,517 |
| 2019-02-01 | 7,072 |
| 2019-03-01 | 7,337 |
| 2019-04-01 | 7,191 |
| 2019-05-01 | 7,311 |
| 2019-06-01 | 7,139 |
| 2019-07-01 | 7,051 |
| 2019-08-01 | 7,172 |
| 2019-09-01 | 7,160 |
| 2019-10-01 | 7,325 |
| 2019-11-01 | 6,919 |
| 2019-12-01 | 6,709 |
| 2020-01-01 | 7,184 |
| 2020-02-01 | 6,995 |
| 2020-03-01 | 5,794 |
| 2020-04-01 | 4,686 |
| 2020-05-01 | 5,581 |
| 2020-06-01 | 6,119 |
| 2020-07-01 | 6,514 |
| 2020-08-01 | 6,360 |
| 2020-09-01 | 6,512 |
| 2020-10-01 | 6,820 |
| 2020-11-01 | 6,875 |
| 2020-12-01 | 6,854 |
| 2021-01-01 | 7,175 |
| 2021-02-01 | 7,760 |
| 2021-03-01 | 8,399 |
| 2021-04-01 | 9,288 |
| 2021-05-01 | 9,840 |
| 2021-06-01 | 10,069 |
| 2021-07-01 | 10,882 |
| 2021-08-01 | 10,960 |
| 2021-09-01 | 10,882 |
| 2021-10-01 | 11,368 |
| 2021-11-01 | 11,232 |
| 2021-12-01 | 11,826 |
| 2022-01-01 | 11,487 |
| 2022-02-01 | 11,601 |
| 2022-03-01 | 12,027 |
| 2022-04-01 | 11,755 |
| 2022-05-01 | 11,443 |
| 2022-06-01 | 10,961 |
| 2022-07-01 | 11,380 |
| 2022-08-01 | 10,198 |
| 2022-09-01 | 10,854 |
| 2022-10-01 | 10,471 |
| 2022-11-01 | 10,746 |
| 2022-12-01 | 11,234 |
| 2023-01-01 | 10,425 |
| 2023-02-01 | 9,849 |
| 2023-03-01 | 9,623 |
| 2023-04-01 | 9,904 |
| 2023-05-01 | 9,311 |
| 2023-06-01 | 9,125 |
| 2023-07-01 | 8,805 |
| 2023-08-01 | 9,358 |
| 2023-09-01 | 9,307 |
| 2023-10-01 | 8,685 |
| 2023-11-01 | 8,931 |
| 2023-12-01 | 8,889 |
| 2024-01-01 | 8,748 |
| 2024-02-01 | 8,756 |
Notes: Shaded areas denote recessions.
Source: EPI analysis of Bureau of Labor Statistics Job Openings and Labor Turnover Survey.