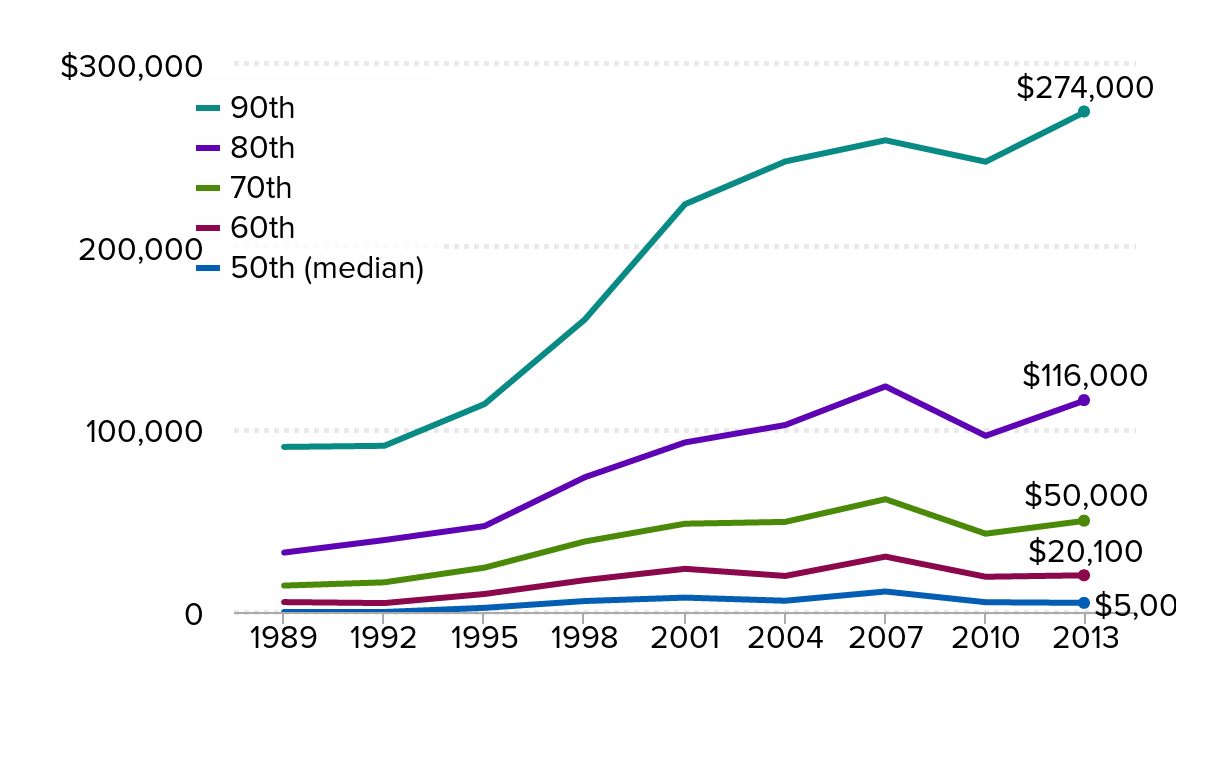
The gap between the retirement ‘haves’ and ‘have-nots’ has grown since the recession: Retirement account savings of families age 32–61 by savings percentile, 1989–2013 (2013 dollars)
| 50th (median) | 60th | 70th | 80th | 90th | |
|---|---|---|---|---|---|
| 1989 | $0 | $5,423 | $14,461 | $32,536 | $90,379 |
| 1992 | $0 | $4,874 | $16,248 | $39,384 | $90,987 |
| 1995 | $2,277 | $9,866 | $24,286 | $47,054 | $113,841 |
| 1998 | $6,004 | $17,440 | $38,597 | $73,763 | $160,106 |
| 2001 | $7,879 | $23,638 | $48,326 | $92,818 | $223,247 |
| 2004 | $6,166 | $19,730 | $49,326 | $102,351 | $246,628 |
| 2007 | $11,228 | $30,315 | $61,754 | $123,508 | $258,243 |
| 2010 | $5,358 | $19,291 | $42,868 | $96,453 | $246,490 |
| 2013 | $5,000 | $20,100 | $50,000 | $116,000 | $274,000 |

Note: Retirement account savings include 401(k)s, IRAs, and Keogh plans. Scale changed to accommodate larger values.
Source: Adapted from Figure 9 in Monique Morrissey, The State of American Retirement:
How 401(k)s have failed most American workers, Economic Policy Institute Report, March 3, 2016