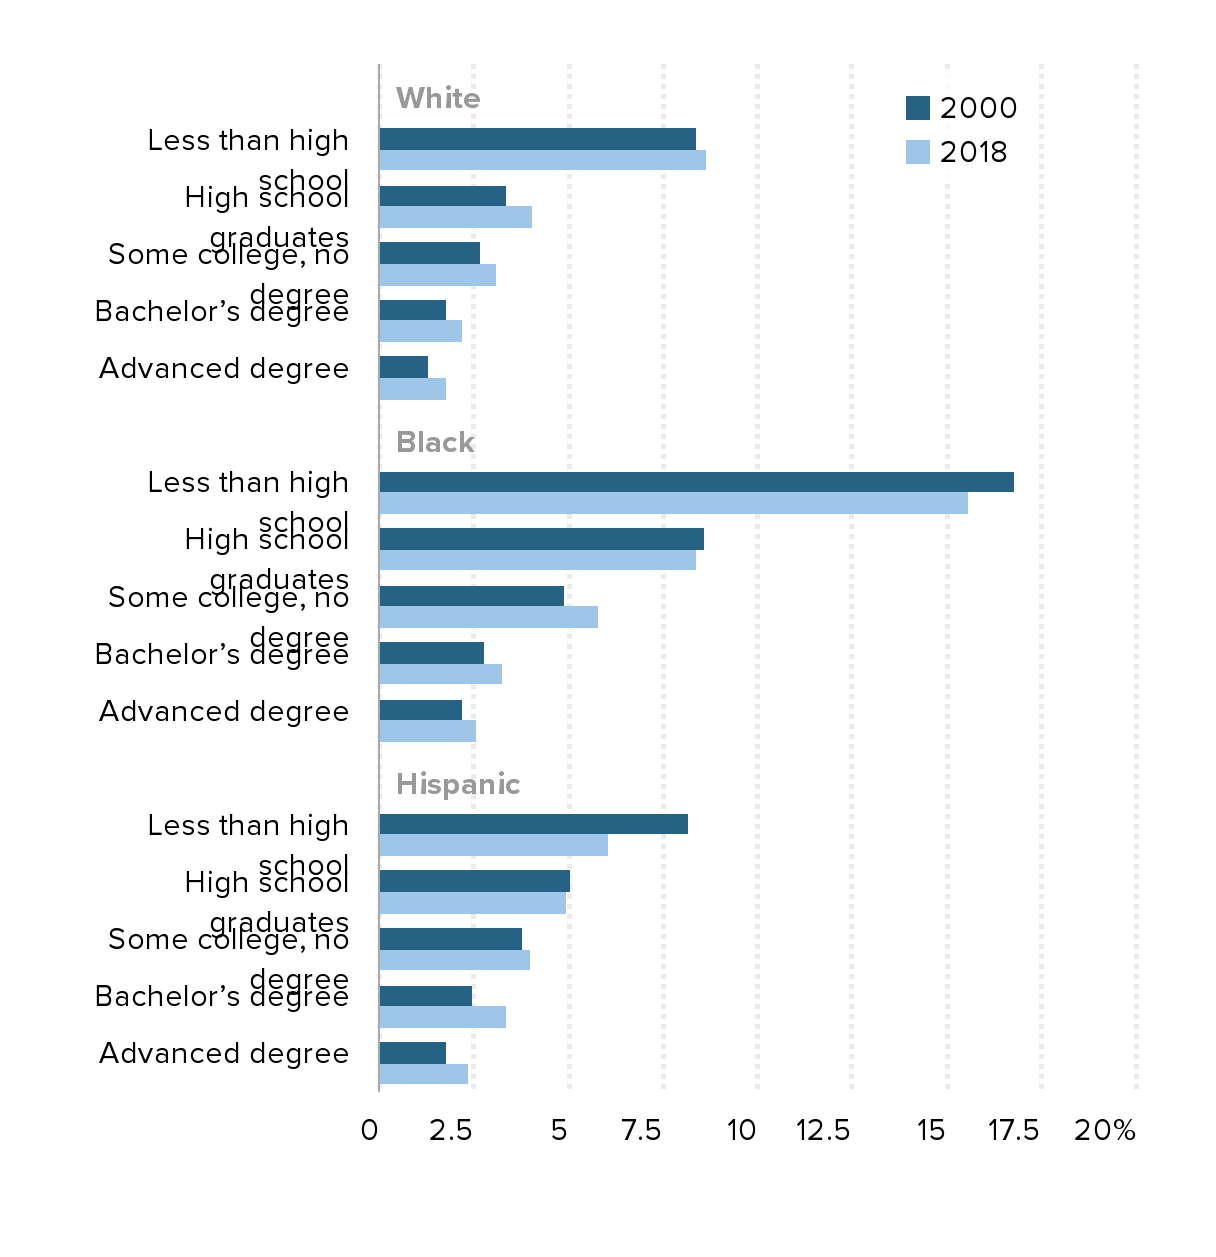
Unemployment rate by race/ethnicity and education, 2000 and 2018
| 2000 | 2018 | |
|---|---|---|
| Less than high school | 8.4% | 8.7% |
| High school graduates | 3.4% | 4.1% |
| Some college, no degree | 2.7% | 3.1% |
| Bachelor’s degree | 1.8% | 2.2% |
| Advanced degree | 1.3% | 1.8% |
| Less than high school | 16.8% | 15.6% |
| High school graduates | 8.6% | 8.4% |
| Some college, no degree | 4.9% | 5.8% |
| Bachelor’s degree | 2.8% | 3.3% |
| Advanced degree | 2.2% | 2.6% |
| Less than high school | 8.2% | 6.1% |
| High school graduates | 5.1% | 5.0% |
| Some college, no degree | 3.8% | 4.0% |
| Bachelor’s degree | 2.5% | 3.4% |
| Advanced degree | 1.8% | 2.4% |

Source: EPI analysis of Bureau of Labor Statistics Current Population Survey microdata