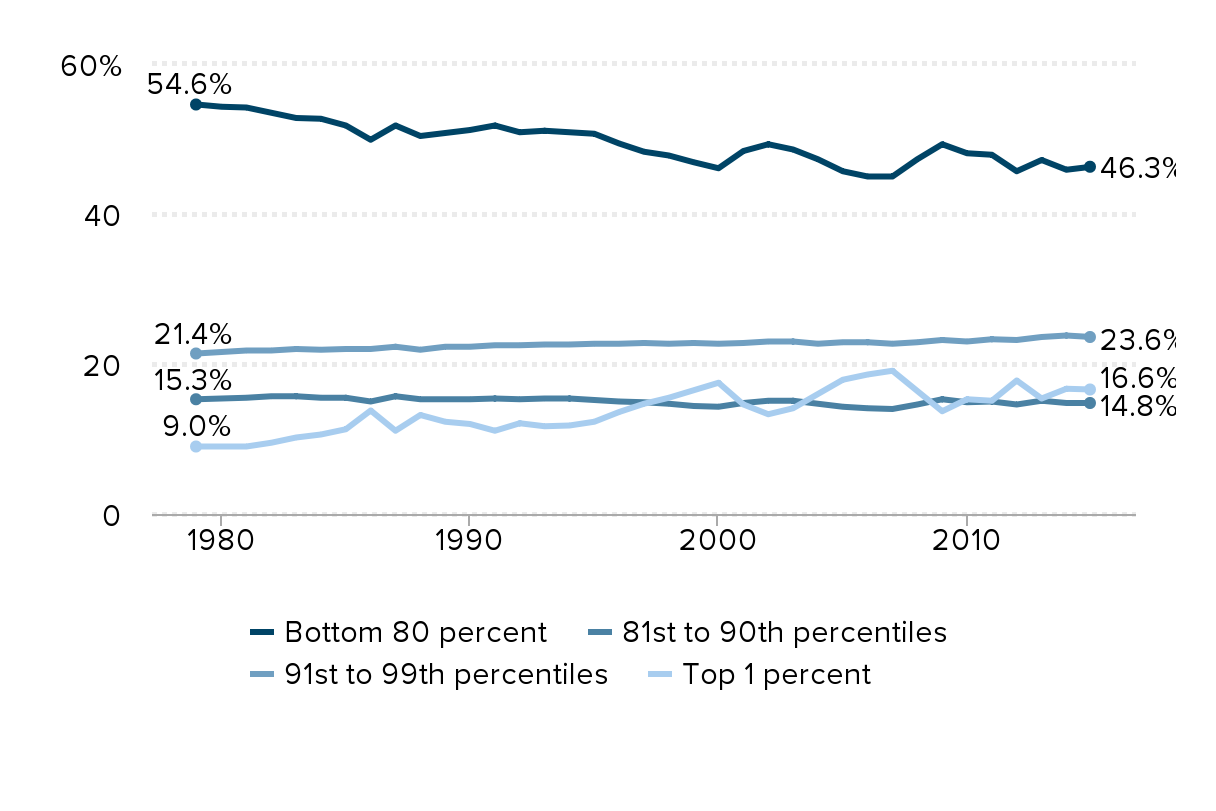
The top 10 percent have seen their share of income grow since 1979, while the share going to the bottom 90 percent has fallen: Shares of before-tax-and-transfer income, by percentile group, 1979–2015
| Year | Bottom 80 percent | 81st to 90th percentiles | 91st to 99th percentiles | Top 1 percent |
|---|---|---|---|---|
| 1979 | 54.6% | 15.3 | 21.4 | 9.0 |
| 1980 | 54.3 | 15.4 | 21.6 | 9.0 |
| 1981 | 54.2 | 15.5 | 21.8 | 9.0 |
| 1982 | 53.5 | 15.7 | 21.8 | 9.5 |
| 1983 | 52.8 | 15.7 | 22.0 | 10.2 |
| 1984 | 52.7 | 15.5 | 21.9 | 10.6 |
| 1985 | 51.8 | 15.5 | 22.0 | 11.3 |
| 1986 | 49.9 | 15.0 | 22.0 | 13.8 |
| 1987 | 51.8 | 15.7 | 22.3 | 11.1 |
| 1988 | 50.4 | 15.3 | 21.9 | 13.2 |
| 1989 | 50.8 | 15.3 | 22.3 | 12.3 |
| 1990 | 51.2 | 15.3 | 22.3 | 12.0 |
| 1991 | 51.8 | 15.4 | 22.5 | 11.1 |
| 1992 | 50.9 | 15.3 | 22.5 | 12.1 |
| 1993 | 51.1 | 15.4 | 22.6 | 11.7 |
| 1994 | 50.9 | 15.4 | 22.6 | 11.8 |
| 1995 | 50.7 | 15.2 | 22.7 | 12.3 |
| 1996 | 49.4 | 15.0 | 22.7 | 13.6 |
| 1997 | 48.3 | 14.9 | 22.8 | 14.7 |
| 1998 | 47.8 | 14.7 | 22.7 | 15.5 |
| 1999 | 46.9 | 14.4 | 22.8 | 16.5 |
| 2000 | 46.1 | 14.3 | 22.7 | 17.5 |
| 2001 | 48.4 | 14.8 | 22.8 | 14.6 |
| 2002 | 49.3 | 15.1 | 23.0 | 13.3 |
| 2003 | 48.6 | 15.1 | 23.0 | 14.1 |
| 2004 | 47.3 | 14.7 | 22.7 | 16.0 |
| 2005 | 45.7 | 14.3 | 22.9 | 17.9 |
| 2006 | 45.0 | 14.1 | 22.9 | 18.6 |
| 2007 | 45.0 | 14.0 | 22.7 | 19.1 |
| 2008 | 47.3 | 14.6 | 22.9 | 16.4 |
| 2009 | 49.3 | 15.3 | 23.2 | 13.7 |
| 2010 | 48.1 | 14.9 | 23.0 | 15.3 |
| 2011 | 47.9 | 15.0 | 23.3 | 15.1 |
| 2012 | 45.7 | 14.6 | 23.2 | 17.8 |
| 2013 | 47.2 | 15.1 | 23.6 | 15.4 |
| 2014 | 45.9 | 14.8 | 23.8 | 16.7 |
| 2015 | 46.3 | 14.8 | 23.6 | 16.6 |

Source: EPI analysis of CBO 2018