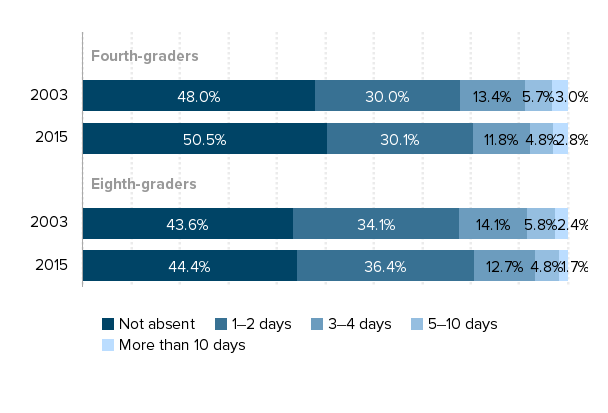
Are there significant differences in student absenteeism rates across grades and over time?: Shares of fourth-graders and eighth-graders who missed school no days, 1–2 days, 3–4 days, 5–10 days, and more than 10 days in the month before the NAEP mathematics assessment, 2003 and 2015
| Not absent | 1–2 days | 3–4 days | 5–10 days | More than 10 days | |
|---|---|---|---|---|---|
| 2003 | 48.0% | 30.0% | 13.4% | 5.7% | 3.0% |
| 2015 | 50.5% | 30.1% | 11.8% | 4.8% | 2.8% |
| 2003 | 43.6% | 34.1% | 14.1% | 5.8% | 2.4% |
| 2015 | 44.4% | 36.4% | 12.7% | 4.8% | 1.7% |

Source: EPI analysis of National Assessment of Educational Progress microdata, 2003 and 2015