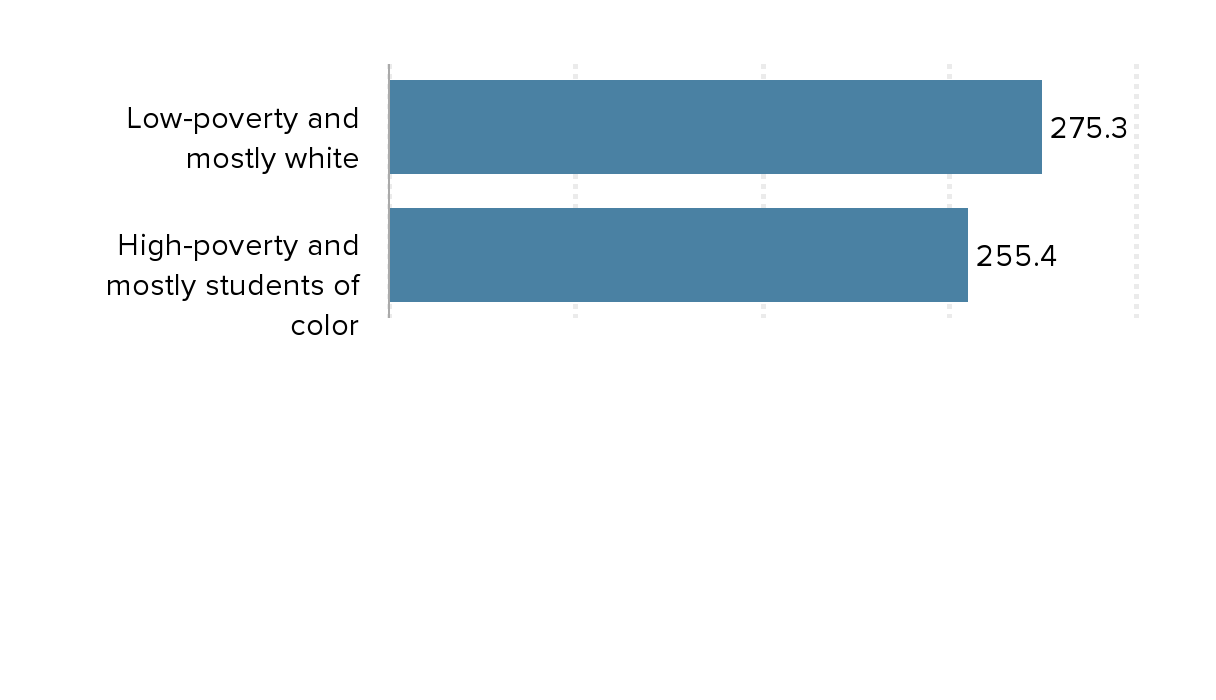
Performance of black students suffers when these students attend high-poverty schools with high shares of students of color: Math performance of black students by school segregation, 2017
| Black | |
|---|---|
| Low-poverty and mostly white | 275.3 |
| High-poverty and mostly students of color | 255.4 |

Notes: Schools with a high concentration of students of color are those in which 51–100% of students are black, Hispanic, Asian, or American Indian. Mostly white schools are those in which more than 75% of students are white. High-poverty schools are schools in which 51–100% of students are eligible for free or reduced-price lunch (FRPL). Low-poverty schools are those in which up to 25% are FRPL eligible.
Note: Results are obtained using regression analyses and the subsample of white and black students participating in the 8th-grade mathematics assessment in the 2017 NAEP. Schools with a high concentration of students of color are those in which 51–100% of students are black, Hispanic, Asian, or American Indian. Mostly white schools are those in which more than 75% of students are white. High-poverty schools are schools in which 51–100% of students are eligible for free or reduced-price lunch (FRPL). Low-poverty schools are those in which up to 25% are FRPL eligible.