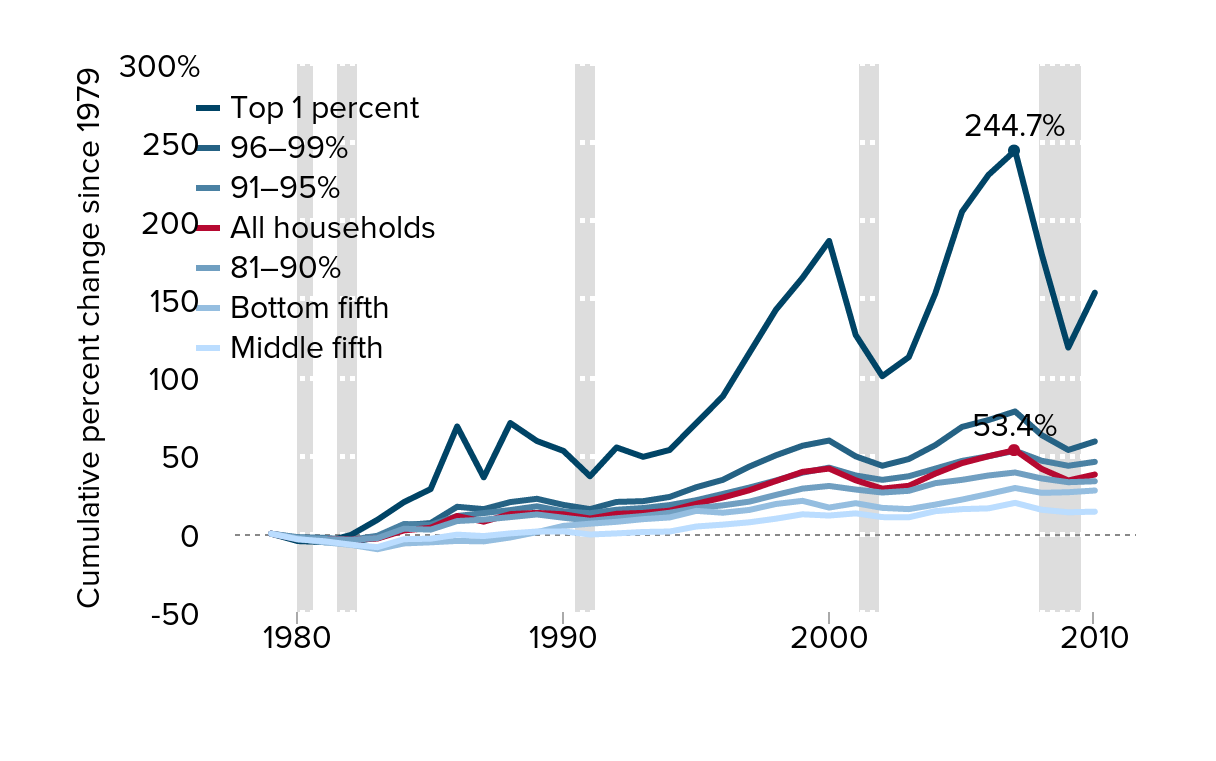
Change in average real annual household income, by income group, 1979–2010
| Year | All households | Bottom fifth | Middle fifth | 81–90% | 91–95% | 96–99% | Top 1 percent |
|---|---|---|---|---|---|---|---|
| 1979/01/01 | 0.0% | 0.0% | 0.0% | 0.0% | 0.0% | 0.0% | 0.0% |
| 1980/01/01 | -3.3% | -3.2% | -3.6% | -2.6% | -2.2% | -3.8% | -4.7% |
| 1981/01/01 | -3.5% | -5.5% | -4.8% | -3.4% | -2.6% | -5.4% | -5.3% |
| 1982/01/01 | -3.8% | -7.1% | -7.0% | -3.9% | -3.9% | -5.4% | -0.8% |
| 1983/01/01 | -3.1% | -9.9% | -8.6% | -2.8% | -1.3% | -2.4% | 8.9% |
| 1984/01/01 | 2.1% | -6.2% | -3.5% | 3.2% | 6.2% | 5.5% | 20.2% |
| 1985/01/01 | 3.8% | -5.5% | -3.2% | 2.6% | 5.7% | 6.8% | 28.5% |
| 1986/01/01 | 11.3% | -4.6% | -0.6% | 8.1% | 11.3% | 17.2% | 68.5% |
| 1987/01/01 | 7.7% | -4.9% | -1.5% | 9.0% | 13.2% | 15.7% | 36.0% |
| 1988/01/01 | 12.5% | -2.4% | 0.2% | 10.6% | 15.1% | 20.2% | 70.7% |
| 1989/01/01 | 13.3% | 1.0% | 1.4% | 12.3% | 17.5% | 22.3% | 59.2% |
| 1990/01/01 | 12.4% | 5.0% | 1.5% | 10.2% | 14.3% | 18.4% | 52.9% |
| 1991/01/01 | 9.7% | 6.4% | -0.5% | 8.3% | 13.1% | 15.7% | 36.7% |
| 1992/01/01 | 12.7% | 7.6% | 0.2% | 9.9% | 15.3% | 20.3% | 55.1% |
| 1993/01/01 | 13.3% | 9.3% | 1.1% | 11.3% | 16.4% | 20.8% | 49.1% |
| 1994/01/01 | 14.7% | 10.4% | 1.4% | 13.4% | 18.3% | 23.5% | 53.5% |
| 1995/01/01 | 19.1% | 14.6% | 4.6% | 16.4% | 21.4% | 29.7% | 70.7% |
| 1996/01/01 | 23.1% | 13.4% | 5.8% | 18.1% | 25.4% | 34.4% | 87.7% |
| 1997/01/01 | 27.8% | 15.2% | 7.3% | 20.5% | 29.5% | 42.9% | 115.5% |
| 1998/01/01 | 33.7% | 19.0% | 9.6% | 24.8% | 34.0% | 50.1% | 143.1% |
| 1999/01/01 | 39.5% | 21.0% | 12.4% | 28.8% | 39.0% | 56.2% | 163.5% |
| 2000/01/01 | 41.6% | 16.7% | 11.6% | 30.5% | 42.2% | 59.5% | 187.0% |
| 2001/01/01 | 34.1% | 19.5% | 13.0% | 28.2% | 37.2% | 49.4% | 126.9% |
| 2002/01/01 | 28.8% | 16.5% | 10.6% | 26.3% | 34.4% | 43.4% | 100.6% |
| 2003/01/01 | 30.6% | 15.7% | 10.5% | 27.4% | 36.7% | 47.7% | 112.8% |
| 2004/01/01 | 38.4% | 18.6% | 14.4% | 32.3% | 41.6% | 56.6% | 153.5% |
| 2005/01/01 | 45.1% | 21.8% | 15.7% | 34.4% | 46.5% | 68.2% | 205.6% |
| 2006/01/01 | 49.5% | 25.4% | 16.2% | 37.2% | 49.5% | 72.6% | 229.2% |
| 2007/01/01 | 53.4% | 29.2% | 19.7% | 39.1% | 53.0% | 78.1% | 244.7% |
| 2008/01/01 | 41.4% | 26.1% | 15.3% | 35.3% | 46.6% | 63.0% | 178.7% |
| 2009/01/01 | 34.0% | 26.5% | 13.7% | 32.9% | 43.4% | 53.5% | 118.9% |
| 2010/01/01 | 37.8% | 27.6% | 14.1% | 33.5% | 45.9% | 58.9% | 153.9% |

Note: Data are for comprehensive income. Shaded areas denote recessions. To be consistent with other income and earnings measures in this paper, we use the CPI-U-RS to deflate this series, instead of the personal consumption expenditures deflator used by CBO.
Source: Authors' analysis of Congressional Budget Office (2013)