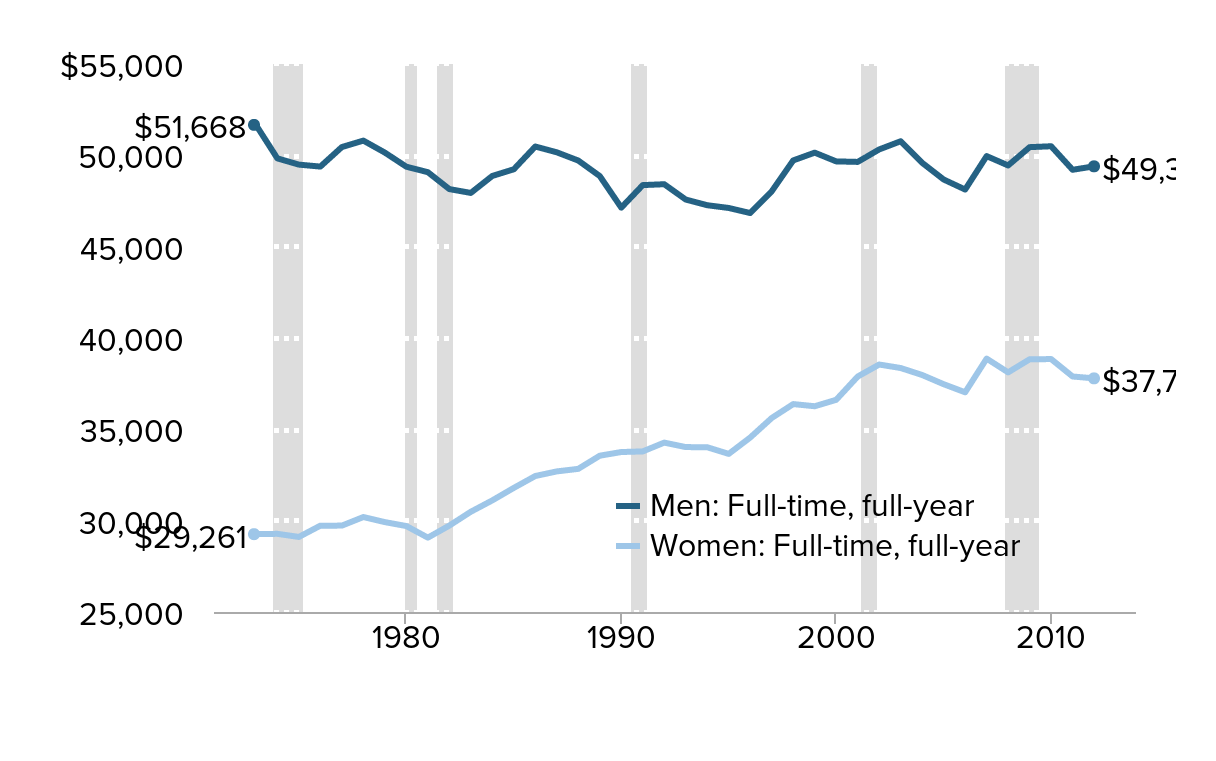
Real earnings of workers, by gender, 1973–2012 (2012 dollars)
| Year | Men: Full-time, full-year | Women: Full-time, full-year |
|---|---|---|
| 1973 | $51,668 | $29,261 |
| 1974 | $49,833 | $29,279 |
| 1975 | $49,492 | $29,110 |
| 1976 | $49,384 | $29,726 |
| 1977 | $50,454 | $29,729 |
| 1978 | $50,806 | $30,199 |
| 1979 | $50,150 | $29,921 |
| 1980 | $49,378 | $29,706 |
| 1981 | $49,078 | $29,071 |
| 1982 | $48,152 | $29,731 |
| 1983 | $47,942 | $30,488 |
| 1984 | $48,871 | $31,110 |
| 1985 | $49,237 | $31,795 |
| 1986 | $50,482 | $32,445 |
| 1987 | $50,166 | $32,697 |
| 1988 | $49,715 | $32,836 |
| 1989 | $48,865 | $33,557 |
| 1990 | $47,136 | $33,757 |
| 1991 | $48,370 | $33,791 |
| 1992 | $48,419 | $34,273 |
| 1993 | $47,579 | $34,028 |
| 1994 | $47,269 | $34,019 |
| 1995 | $47,118 | $33,656 |
| 1996 | $46,841 | $34,551 |
| 1997 | $48,032 | $35,621 |
| 1998 | $49,722 | $36,382 |
| 1999 | $50,147 | $36,264 |
| 2000 | $49,669 | $36,616 |
| 2001 | $49,640 | $37,890 |
| 2002 | $50,323 | $38,548 |
| 2003 | $50,771 | $38,357 |
| 2004 | $49,591 | $37,975 |
| 2005 | $48,676 | $37,470 |
| 2006 | $48,127 | $37,028 |
| 2007 | $49,958 | $38,872 |
| 2008 | $49,446 | $38,119 |
| 2009 | $50,448 | $38,835 |
| 2010 | $50,497 | $38,846 |
| 2011 | $49,209 | $37,893 |
| 2012 | $49,398 | $37,791 |

Note: Earnings are wage and salary income. Shaded areas denote recessions.
Source: Current Population Survey Annual Social and Economic Supplement Historical Income Tables (Table P-41)