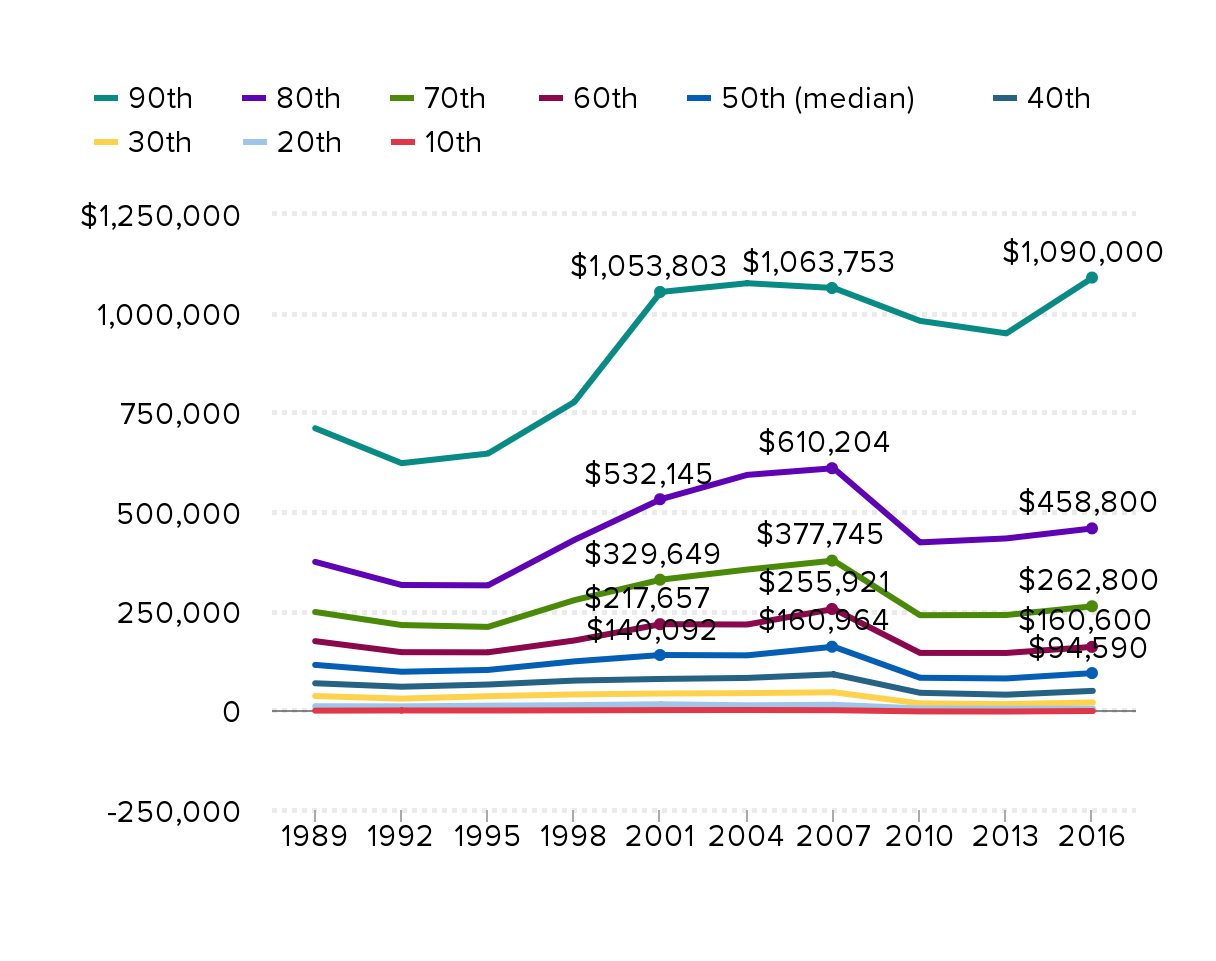
The recession did not halt the decades-long growth in wealth inequality: Net worth of families age 32–61, by net worth percentile, 1989–2016 (2016 dollars)
| 10th | 20th | 30th | 40th | 50th (median) | 60th | 70th | 80th | 90th | |
|---|---|---|---|---|---|---|---|---|---|
| 1989 | $56 | $11,195 | $36,795 | $68,962 | $115,240 | $174,906 | $248,365 | $374,478 | $710,799 |
| 1992 | $553 | $10,901 | $30,355 | $60,224 | $97,941 | $147,230 | $215,503 | $316,295 | $622,863 |
| 1995 | $438 | $12,575 | $36,488 | $65,772 | $102,495 | $146,844 | $210,862 | $315,393 | $647,073 |
| 1998 | $856 | $13,869 | $40,855 | $75,720 | $124,071 | $176,657 | $278,124 | $429,830 | $776,932 |
| 2001 | $1,490 | $16,124 | $43,152 | $79,828 | $140,092 | $217,657 | $329,649 | $532,145 | $1,053,803 |
| 2004 | $1,653 | $13,532 | $44,093 | $82,411 | $139,247 | $216,839 | $355,094 | $593,413 | $1,075,800 |
| 2007 | $1,158 | $14,823 | $46,321 | $91,483 | $160,964 | $255,921 | $377,745 | $610,204 | $1,063,753 |
| 2010 | -$1,868 | $5,527 | $18,282 | $44,987 | $82,789 | $145,351 | $240,265 | $423,562 | $981,091 |
| 2013 | -$2,155 | $4,784 | $16,446 | $40,213 | $81,107 | $145,252 | $240,763 | $433,476 | $949,544 |
| 2016 | -$820 | $5,200 | $20,700 | $49,800 | $94,590 | $160,600 | $262,800 | $458,800 | $1,090,000 |

Note: Scale changed to accommodate larger values.
Source: EPI analysis of Survey of Consumer Finance data, 2016.