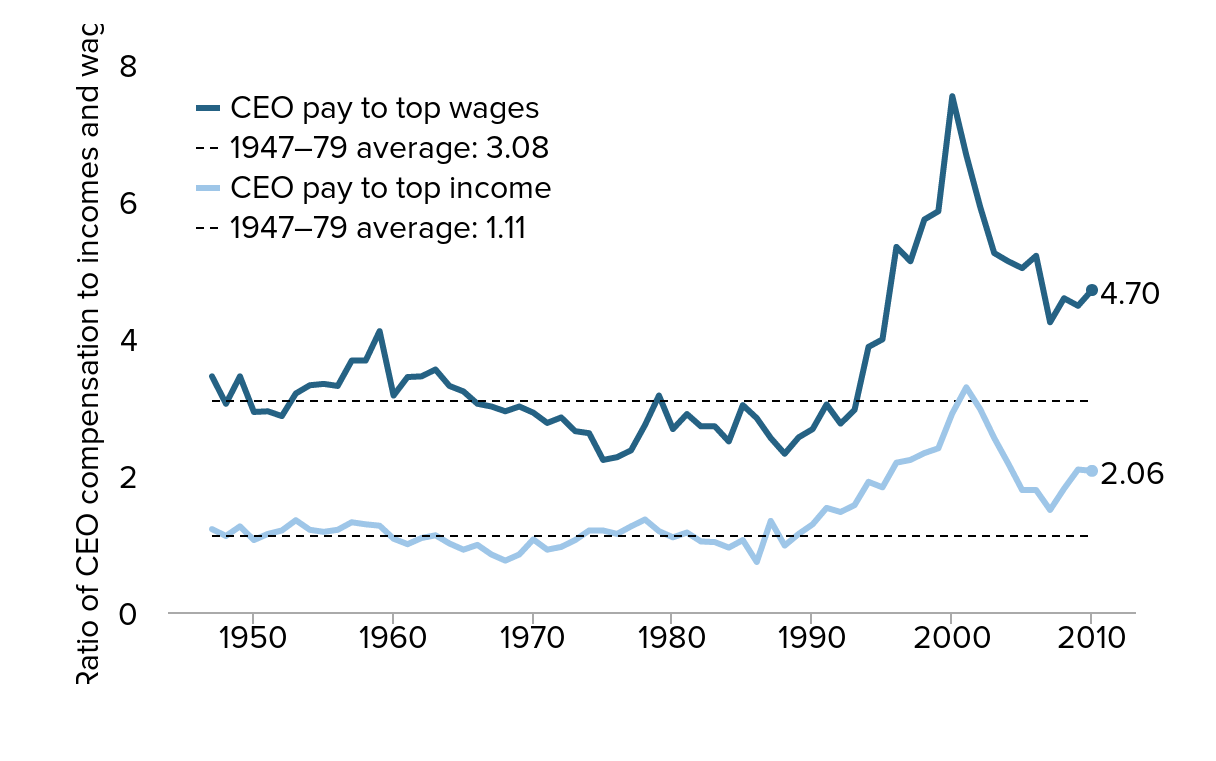
Comparison of CEO compensation to top incomes and wages, 1947–2010
| Year | CEO pay to top income | CEO pay to top wages | 1947–79 average: 1.11 | 1947–79 average: 3.08 |
|---|---|---|---|---|
| 1947 | 1.21 | 3.44 | 1.11 | 3.08 |
| 1948 | 1.11 | 3.04 | 1.11 | 3.08 |
| 1949 | 1.25 | 3.44 | 1.11 | 3.08 |
| 1950 | 1.05 | 2.92 | 1.11 | 3.08 |
| 1951 | 1.14 | 2.93 | 1.11 | 3.08 |
| 1952 | 1.19 | 2.86 | 1.11 | 3.08 |
| 1953 | 1.34 | 3.19 | 1.11 | 3.08 |
| 1954 | 1.20 | 3.31 | 1.11 | 3.08 |
| 1955 | 1.17 | 3.33 | 1.11 | 3.08 |
| 1956 | 1.20 | 3.30 | 1.11 | 3.08 |
| 1957 | 1.31 | 3.67 | 1.11 | 3.08 |
| 1958 | 1.28 | 3.67 | 1.11 | 3.08 |
| 1959 | 1.26 | 4.10 | 1.11 | 3.08 |
| 1960 | 1.07 | 3.16 | 1.11 | 3.08 |
| 1961 | 0.99 | 3.43 | 1.11 | 3.08 |
| 1962 | 1.08 | 3.44 | 1.11 | 3.08 |
| 1963 | 1.12 | 3.54 | 1.11 | 3.08 |
| 1964 | 1.00 | 3.30 | 1.11 | 3.08 |
| 1965 | 0.91 | 3.22 | 1.11 | 3.08 |
| 1966 | 0.98 | 3.04 | 1.11 | 3.08 |
| 1967 | 0.84 | 3.00 | 1.11 | 3.08 |
| 1968 | 0.75 | 2.93 | 1.11 | 3.08 |
| 1969 | 0.84 | 3.00 | 1.11 | 3.08 |
| 1970 | 1.06 | 2.91 | 1.11 | 3.08 |
| 1971 | 0.91 | 2.76 | 1.11 | 3.08 |
| 1972 | 0.95 | 2.84 | 1.11 | 3.08 |
| 1973 | 1.05 | 2.64 | 1.11 | 3.08 |
| 1974 | 1.19 | 2.61 | 1.11 | 3.08 |
| 1975 | 1.19 | 2.22 | 1.11 | 3.08 |
| 1976 | 1.14 | 2.26 | 1.11 | 3.08 |
| 1977 | 1.25 | 2.36 | 1.11 | 3.08 |
| 1978 | 1.35 | 2.73 | 1.11 | 3.08 |
| 1979 | 1.18 | 3.16 | 1.11 | 3.08 |
| 1980 | 1.09 | 2.67 | 1.11 | 3.08 |
| 1981 | 1.16 | 2.89 | 1.11 | 3.08 |
| 1982 | 1.03 | 2.71 | 1.11 | 3.08 |
| 1983 | 1.02 | 2.71 | 1.11 | 3.08 |
| 1984 | 0.94 | 2.49 | 1.11 | 3.08 |
| 1985 | 1.05 | 3.02 | 1.11 | 3.08 |
| 1986 | 0.73 | 2.83 | 1.11 | 3.08 |
| 1987 | 1.33 | 2.54 | 1.11 | 3.08 |
| 1988 | 0.97 | 2.31 | 1.11 | 3.08 |
| 1989 | 1.14 | 2.55 | 1.11 | 3.08 |
| 1990 | 1.28 | 2.67 | 1.11 | 3.08 |
| 1991 | 1.52 | 3.03 | 1.11 | 3.08 |
| 1992 | 1.46 | 2.75 | 1.11 | 3.08 |
| 1993 | 1.56 | 2.95 | 1.11 | 3.08 |
| 1994 | 1.90 | 3.87 | 1.11 | 3.08 |
| 1995 | 1.82 | 3.98 | 1.11 | 3.08 |
| 1996 | 2.18 | 5.33 | 1.11 | 3.08 |
| 1997 | 2.22 | 5.12 | 1.11 | 3.08 |
| 1998 | 2.32 | 5.73 | 1.11 | 3.08 |
| 1999 | 2.39 | 5.85 | 1.11 | 3.08 |
| 2000 | 2.90 | 7.53 | 1.11 | 3.08 |
| 2001 | 3.28 | 6.67 | 1.11 | 3.08 |
| 2002 | 2.96 | 5.91 | 1.11 | 3.08 |
| 2003 | 2.54 | 5.24 | 1.11 | 3.08 |
| 2004 | 2.17 | 5.12 | 1.11 | 3.08 |
| 2005 | 1.78 | 5.02 | 1.11 | 3.08 |
| 2006 | 1.78 | 5.20 | 1.11 | 3.08 |
| 2007 | 1.49 | 4.23 | 1.11 | 3.08 |
| 2008 | 1.80 | 4.58 | 1.11 | 3.08 |
| 2009 | 2.08 | 4.47 | 1.11 | 3.08 |
| 2010 | 2.06 | 4.70 | 1.11 | 3.08 |

Note: "Top wages" are annual wages of the top 0.1% of wage earners. "Top income" is average annual income of the top 0.1% of households.
Source: Authors' analysis of Kaplan (2012b) and Mishel et al. (2012, Table 4.8)