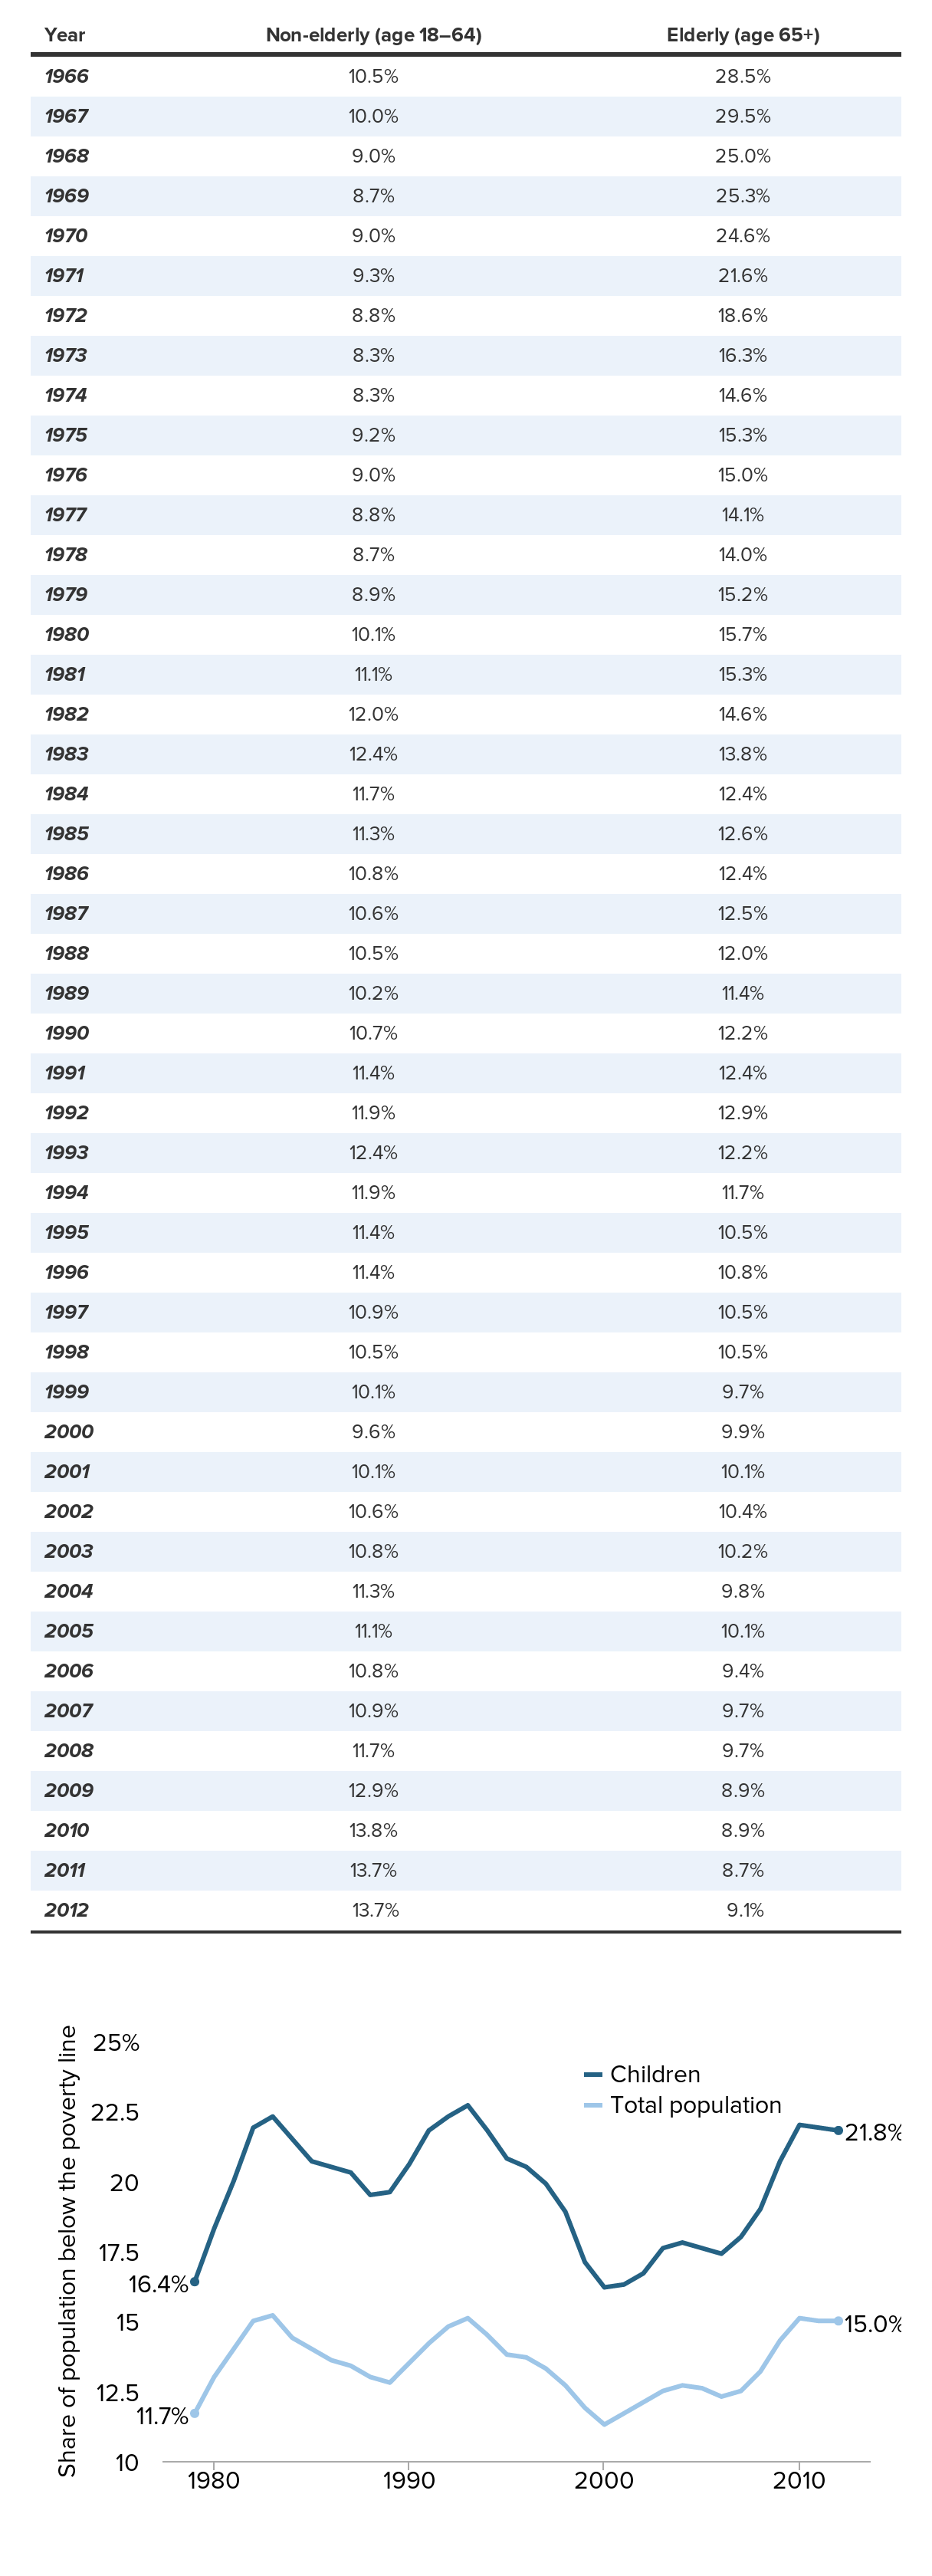
Poverty rate for elderly and non-elderly adults, 1966–2012
| Year | Non-elderly (age 18–64) | Elderly (age 65+) |
|---|---|---|
| 1966 | 10.5% | 28.5% |
| 1967 | 10.0% | 29.5% |
| 1968 | 9.0% | 25.0% |
| 1969 | 8.7% | 25.3% |
| 1970 | 9.0% | 24.6% |
| 1971 | 9.3% | 21.6% |
| 1972 | 8.8% | 18.6% |
| 1973 | 8.3% | 16.3% |
| 1974 | 8.3% | 14.6% |
| 1975 | 9.2% | 15.3% |
| 1976 | 9.0% | 15.0% |
| 1977 | 8.8% | 14.1% |
| 1978 | 8.7% | 14.0% |
| 1979 | 8.9% | 15.2% |
| 1980 | 10.1% | 15.7% |
| 1981 | 11.1% | 15.3% |
| 1982 | 12.0% | 14.6% |
| 1983 | 12.4% | 13.8% |
| 1984 | 11.7% | 12.4% |
| 1985 | 11.3% | 12.6% |
| 1986 | 10.8% | 12.4% |
| 1987 | 10.6% | 12.5% |
| 1988 | 10.5% | 12.0% |
| 1989 | 10.2% | 11.4% |
| 1990 | 10.7% | 12.2% |
| 1991 | 11.4% | 12.4% |
| 1992 | 11.9% | 12.9% |
| 1993 | 12.4% | 12.2% |
| 1994 | 11.9% | 11.7% |
| 1995 | 11.4% | 10.5% |
| 1996 | 11.4% | 10.8% |
| 1997 | 10.9% | 10.5% |
| 1998 | 10.5% | 10.5% |
| 1999 | 10.1% | 9.7% |
| 2000 | 9.6% | 9.9% |
| 2001 | 10.1% | 10.1% |
| 2002 | 10.6% | 10.4% |
| 2003 | 10.8% | 10.2% |
| 2004 | 11.3% | 9.8% |
| 2005 | 11.1% | 10.1% |
| 2006 | 10.8% | 9.4% |
| 2007 | 10.9% | 9.7% |
| 2008 | 11.7% | 9.7% |
| 2009 | 12.9% | 8.9% |
| 2010 | 13.8% | 8.9% |
| 2011 | 13.7% | 8.7% |
| 2012 | 13.7% | 9.1% |
Source: Authors’ analysis of Current Population Survey Annual Social and Economic Supplement Historical Poverty Tables (Table 3)
