Ratio of California county share of federal employment law violations detected by the Wage and Hour Division among agricultural employers to the share of agricultural employment in the county, fiscal years 2005–2019
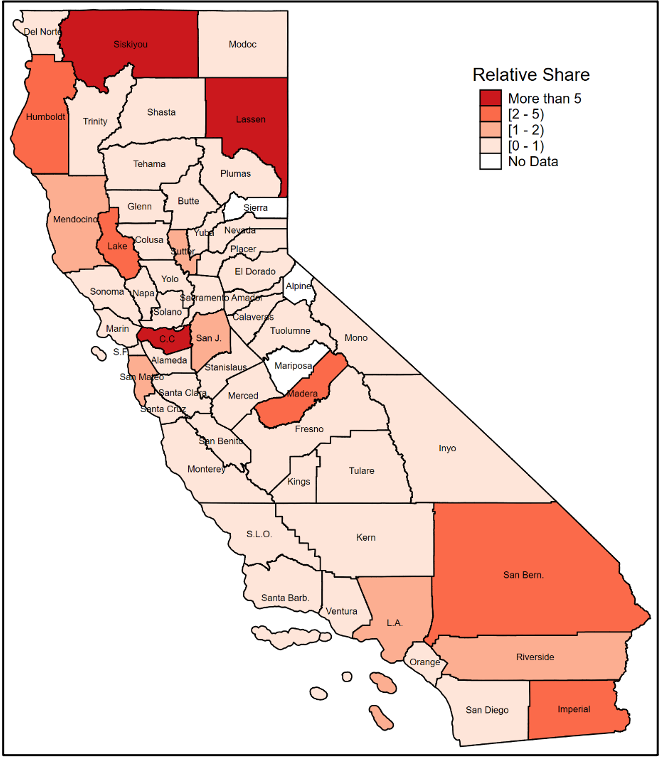
Note: The figure depicts the ratio of each county's share of farm labor violations that were detected between fiscal years 2005 and 2019 relative to the county’s share of agricultural employment. Values less than 1 indicate that a county has a smaller share of violations compared to its share of employment. Larger values indicate that the agricultural employers who were investigated within a county were generally less compliant with employment laws.
Source: Authors' analysis of U.S. Department of Labor, Wage and Hour Compliance Action Data (U.S. DOL-WHD 2020f) and Bureau of Labor Statistics, Quarterly Census of Employment and Wages data for North American Industry Classification System code 11, agriculture, in 2018 (BLS-QCEW 2020a).