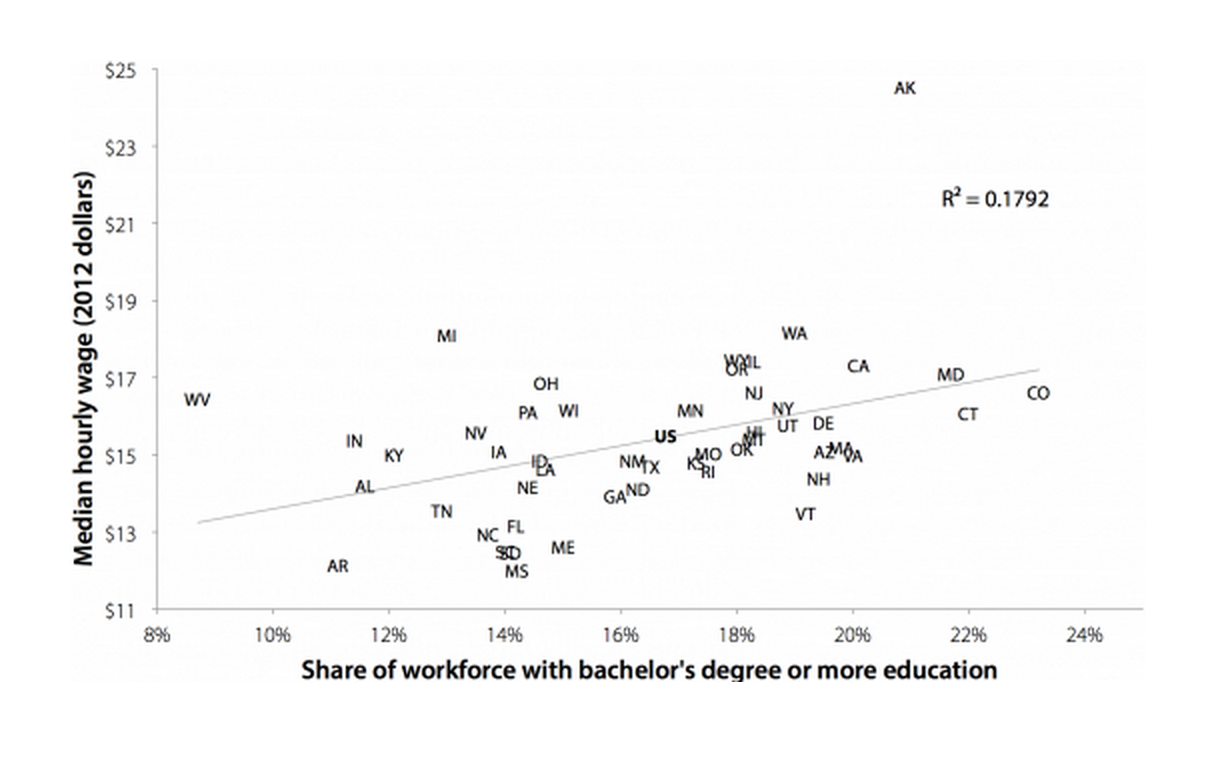
There was a much weaker correlation between education and wages as recently as 1979: Relationship between state median hourly wage and share of state workforce with a bachelor's degree or more education in 1979
| State | Share of labor force with bachelor’s degree or more education | Median Hourly Wage |
|---|---|---|
| WY | 0.18 | $17.48 |
| AR | 0.111 | $12.15 |
| NV | 0.135 | $15.60 |
| MS | 0.142 | $12.02 |
| LA | 0.147 | $14.65 |
| WV | 0.087 | $16.47 |
| IN | 0.114 | $15.39 |
| KY | 0.121 | $15.02 |
| OH | 0.147 | $16.88 |
| SD | 0.141 | $12.48 |
| ID | 0.146 | $14.86 |
| OK | 0.181 | $15.17 |
| UT | 0.189 | $15.78 |
| AK | 0.209 | $24.54 |
| SC | 0.14 | $12.52 |
| AL | 0.116 | $14.22 |
| TX | 0.165 | $14.72 |
| TN | 0.129 | $13.57 |
| IA | 0.139 | $15.10 |
| AZ | 0.195 | $15.11 |
| NC | 0.137 | $12.95 |
| MT | 0.183 | $15.42 |
| WI | 0.151 | $16.17 |
| MI | 0.13 | $18.12 |
| NE | 0.144 | $14.19 |
| MO | 0.175 | $15.06 |
| FL | 0.142 | $13.18 |
| ME | 0.15 | $12.64 |
| PA | 0.144 | $16.12 |
| NM | 0.162 | $14.87 |
| HI | 0.183 | $15.62 |
| ND | 0.163 | $14.13 |
| GA | 0.159 | $13.95 |
| US | 0.168 | $15.52 |
| DE | 0.195 | $15.86 |
| OR | 0.18 | $17.25 |
| RI | 0.175 | $14.59 |
| CA | 0.201 | $17.33 |
| WA | 0.19 | $18.19 |
| MN | 0.172 | $16.18 |
| KS | 0.173 | $14.81 |
| VT | 0.192 | $13.50 |
| IL | 0.183 | $17.44 |
| NH | 0.194 | $14.41 |
| NY | 0.188 | $16.23 |
| VA | 0.2 | $15.00 |
| CO | 0.232 | $16.64 |
| NJ | 0.183 | $16.64 |
| MD | 0.217 | $17.11 |
| CT | 0.22 | $16.18 |
| MA | 0.198 | $15.21 |

Source: Authors' analysis of Current Population Survey (CPS) basic monthly and CPS Outgoing Rotation Group microdata