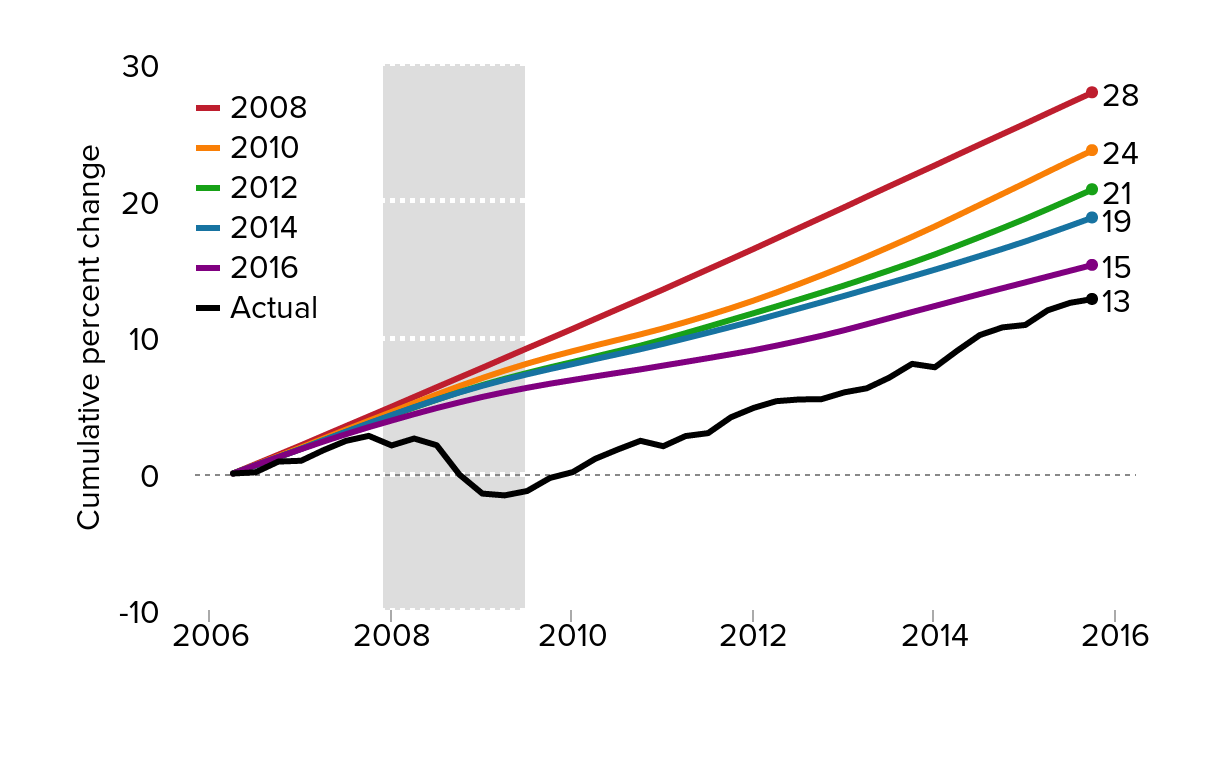
Recovery has been defined downward: Actual GDP and estimates of potential GDP in various years, 2008–2015
| Date | 2008 | 2010 | 2012 | 2014 | 2016 | Actual |
|---|---|---|---|---|---|---|
| 2006Q2 | 0 | 0 | 0 | 0 | 0 | 0 |
| 2006Q3 | 0.6849 | 0.6269 | 0.5938 | 0.5998 | 0.6070 | 0.0891 |
| 2006Q4 | 1.3753 | 1.2631 | 1.1943 | 1.2065 | 1.2057 | 0.8725 |
| 2007Q1 | 2.0700 | 1.9094 | 1.8034 | 1.8132 | 1.7846 | 0.9349 |
| 2007Q2 | 2.7704 | 2.5580 | 2.4221 | 2.4405 | 2.3421 | 1.7074 |
| 2007Q3 | 3.4748 | 3.2105 | 3.0398 | 3.0610 | 2.8805 | 2.3914 |
| 2007Q4 | 4.1828 | 3.8630 | 3.6518 | 3.6815 | 3.3963 | 2.7568 |
| 2008Q1 | 4.8941 | 4.5101 | 4.2483 | 4.2813 | 3.8798 | 2.0556 |
| 2008Q2 | 5.6065 | 5.1579 | 4.8400 | 4.8604 | 4.3489 | 2.5621 |
| 2008Q3 | 6.3197 | 5.7926 | 5.4135 | 5.4119 | 4.7940 | 2.0700 |
| 2008Q4 | 7.0333 | 6.4056 | 5.9632 | 5.9428 | 5.2131 | -0.0864 |
| 2009Q1 | 7.7461 | 6.9930 | 6.4772 | 6.4254 | 5.6095 | -1.4709 |
| 2009Q2 | 8.4594 | 7.5393 | 6.9347 | 6.8597 | 5.9572 | -1.6039 |
| 2009Q3 | 9.1729 | 8.0492 | 7.3660 | 7.2665 | 6.2788 | -1.2824 |
| 2009Q4 | 9.8871 | 8.5250 | 7.7777 | 7.6525 | 6.5779 | -0.3269 |
| 2010Q1 | 10.6028 | 8.9628 | 8.1682 | 8.0179 | 6.8502 | 0.1042 |
| 2010Q2 | 11.3185 | 9.3766 | 8.5612 | 8.3833 | 7.1142 | 1.0713 |
| 2010Q3 | 12.0366 | 9.7827 | 8.9579 | 8.7418 | 7.3714 | 1.7540 |
| 2010Q4 | 12.7582 | 10.1934 | 9.3654 | 9.1072 | 7.6279 | 2.3949 |
| 2011Q1 | 13.4843 | 10.6289 | 9.8152 | 9.5002 | 7.9063 | 1.9994 |
| 2011Q2 | 14.2172 | 11.0931 | 10.2809 | 9.9000 | 8.1745 | 2.7417 |
| 2011Q3 | 14.9568 | 11.5867 | 10.7598 | 10.3137 | 8.4495 | 2.9576 |
| 2011Q4 | 15.7028 | 12.1121 | 11.2544 | 10.7411 | 8.7362 | 4.1173 |
| 2012Q1 | 16.4566 | 12.6716 | 11.7467 | 11.1755 | 9.0339 | 4.8075 |
| 2012Q2 | 17.2158 | 13.2598 | 12.2398 | 11.6305 | 9.3637 | 5.2969 |
| 2012Q3 | 17.9789 | 13.8774 | 12.7412 | 12.0855 | 9.7156 | 5.4230 |
| 2012Q4 | 18.7447 | 14.5230 | 13.2533 | 12.5474 | 10.0894 | 5.4470 |
| 2013Q1 | 19.5107 | 15.1894 | 13.7783 | 13.0162 | 10.4995 | 5.9467 |
| 2013Q2 | 20.2771 | 15.8814 | 14.3187 | 13.4850 | 10.9329 | 6.2414 |
| 2013Q3 | 21.0435 | 16.5990 | 14.8759 | 13.9607 | 11.3781 | 7.0242 |
| 2013Q4 | 21.8094 | 17.3383 | 15.4519 | 14.4433 | 11.8300 | 8.0324 |
| 2014Q1 | 22.5747 | 18.1016 | 16.0534 | 14.9328 | 12.2710 | 7.7816 |
| 2014Q2 | 23.3391 | 18.8843 | 16.6756 | 15.4223 | 12.7072 | 8.9920 |
| 2014Q3 | 24.1030 | 19.6801 | 17.3180 | 15.9324 | 13.1420 | 10.1387 |
| 2014Q4 | 24.8665 | 20.4845 | 17.9801 | 16.4564 | 13.5748 | 10.7049 |
| 2015Q1 | 25.6302 | 21.2904 | 18.6614 | 17.0010 | 14.0028 | 10.8824 |
| 2015Q2 | 26.3940 | 22.0948 | 19.3634 | 17.5664 | 14.4273 | 11.9537 |
| 2015Q3 | 27.1591 | 22.8961 | 20.0843 | 18.1524 | 14.8532 | 12.5048 |
| 2015Q4 | 27.9257 | 23.6904 | 20.8233 | 18.7590 | 15.2846 | 12.7865 |

Note: Shaded area denotes recession. Measures of potential output are from forecasts in successive editions of the CBO Budget and Economic Outlook from 2008 to 2016.
Source: Author’s analysis of data from BEA NIPA Table 1.1.6 and the Congressional Budget Office (on potential gross domestic product)