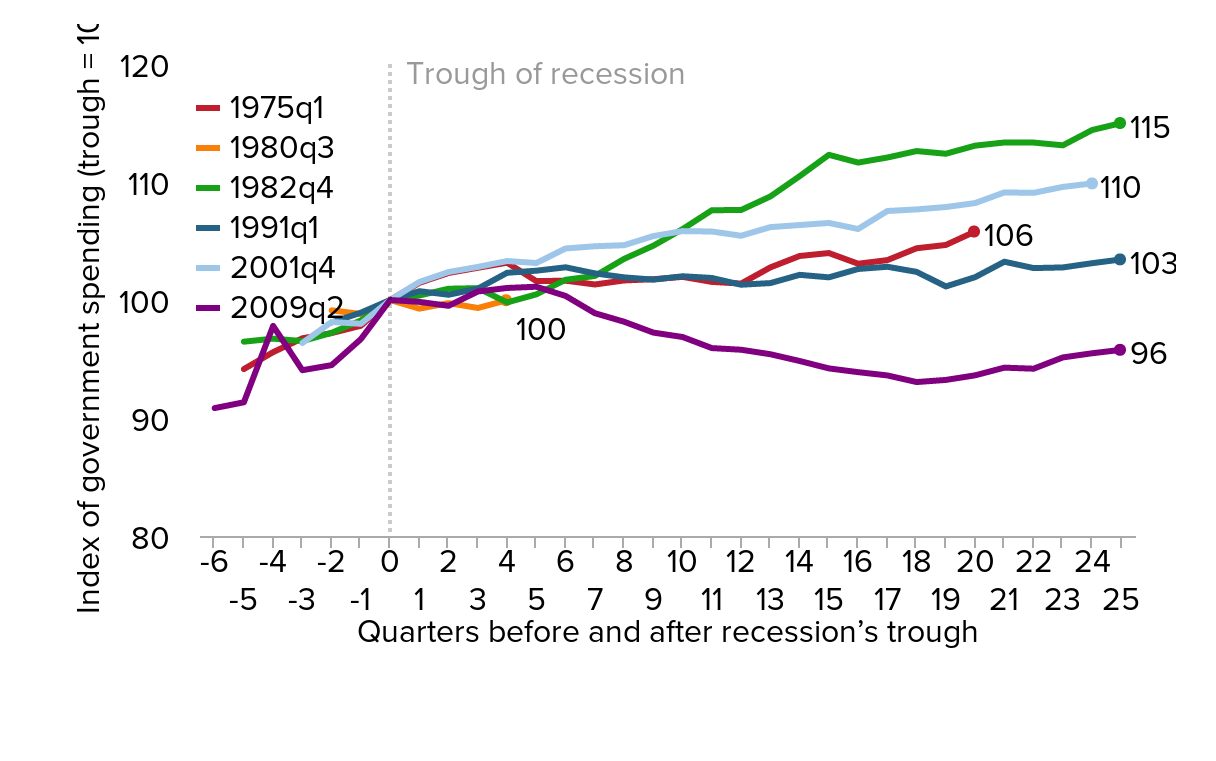
Fiscal austerity explains the slow recovery: Change in per capita government spending over past six business cycles
| Quarters before and after recession’s trough (trough = 0) | 1975q1 | 1980q3 | 1982q4 | 1991q1 | 2001q4 | 2009q2 |
|---|---|---|---|---|---|---|
| -6 | 90.83817 | |||||
| -5 | 94.14608 | 96.46779 | 91.33168 | |||
| -4 | 95.58078 | 96.72548 | 97.80345 | |||
| -3 | 96.75442 | 96.51523 | 96.35624 | 94.05089 | ||
| -2 | 97.19567 | 99.12375 | 97.21731 | 98.09825 | 98.14218 | 94.4813 |
| -1 | 97.81814 | 98.81721 | 98.26435 | 98.92533 | 97.98324 | 96.68474 |
| 0 | 100 | 100 | 100 | 100 | 100 | 100 |
| 1 | 101.4549 | 99.26806 | 100.3829 | 100.7468 | 101.5275 | 99.84022 |
| 2 | 102.2914 | 99.73443 | 100.9558 | 100.4456 | 102.3723 | 99.50632 |
| 3 | 102.7309 | 99.32341 | 101.005 | 100.9653 | 102.8023 | 100.7222 |
| 4 | 103.1591 | 99.98405 | 99.79553 | 102.3054 | 103.3013 | 101.0192 |
| 5 | 101.5995 | 100.4771 | 102.4831 | 103.1351 | 101.1242 | |
| 6 | 101.6376 | 101.715 | 102.7714 | 104.3665 | 100.3429 | |
| 7 | 101.3162 | 102.037 | 102.2554 | 104.5556 | 98.8815 | |
| 8 | 101.6571 | 103.485 | 101.9195 | 104.6451 | 98.15728 | |
| 9 | 101.7618 | 104.602 | 101.724 | 105.4192 | 97.23711 | |
| 10 | 101.9609 | 106.0107 | 102.011 | 105.8382 | 96.8626 | |
| 11 | 101.5335 | 107.6073 | 101.868 | 105.804 | 95.92456 | |
| 12 | 101.3926 | 107.6288 | 101.2959 | 105.4445 | 95.78462 | |
| 13 | 102.7633 | 108.7749 | 101.4328 | 106.1767 | 95.40432 | |
| 14 | 103.7289 | 110.4932 | 102.1325 | 106.3521 | 94.83228 | |
| 15 | 103.9792 | 112.3029 | 101.9209 | 106.5289 | 94.20283 | |
| 16 | 103.0743 | 111.6476 | 102.6275 | 106.0185 | 93.88481 | |
| 17 | 103.3799 | 112.0741 | 102.8173 | 107.5423 | 93.60793 | |
| 18 | 104.385 | 112.6221 | 102.3836 | 107.6773 | 93.04602 | |
| 19 | 104.6642 | 112.3952 | 101.1486 | 107.8776 | 93.22673 | |
| 20 | 105.8042 | 113.0807 | 101.9359 | 108.2144 | 93.61573 | |
| 21 | 113.3476 | 103.2437 | 109.1187 | 94.26683 | ||
| 22 | 113.3408 | 102.7047 | 109.0787 | 94.17814 | ||
| 23 | 113.108 | 102.7598 | 109.5846 | 95.13453 | ||
| 24 | 114.405 | 103.1194 | 109.8789 | 95.48556 | ||
| 25 | 114.9973 | 103.4402 | 95.77813 |

Note: For total government spending, we deflated government consumption and investment expenditures with the NIPA price deflator. Government transfer payments were deflated with the price deflator for personal consumption expenditures. This figure includes state and local government spending. We agree that it is appropriate to include this spending in a measure of the federal government's failure to combat austerity in the current recovery. Only the federal government has the significant ability to run deficits during recessions, and historically many federal efforts to combat recessions and spur recovery have involved giving aid to state and local governments to spend.
Source: Author’s analysis of data from Tables 1.1.4, 3.1, and 3.9.4 from the National Income and Product Accounts (NIPA) of the Bureau of Economic Analysis (BEA)