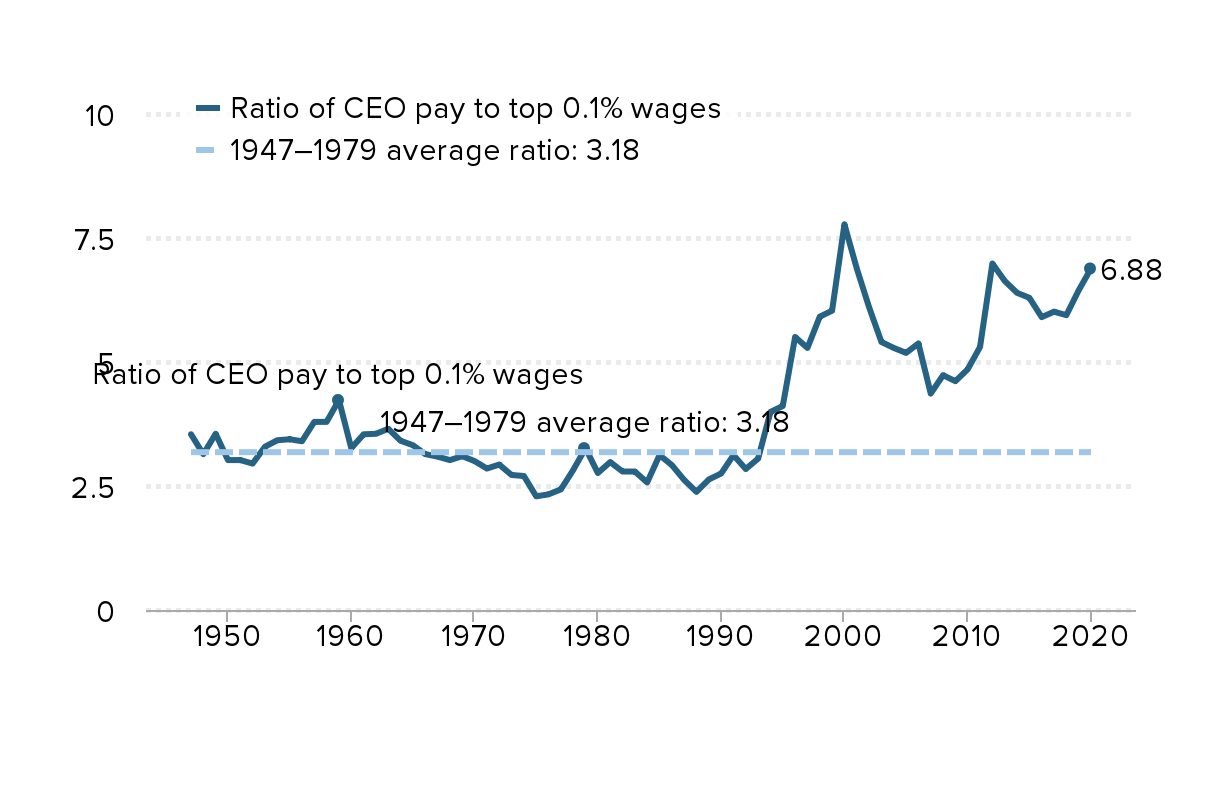
CEO compensation relative to top 0.1% earners is much higher than it was in the 1947–1979 period: Ratio of CEO compensation to top 0.1% wages, 1947–2020
| year | Ratio of CEO pay to top 0.1% wages | 1947–1979 average ratio: 3.18 |
|---|---|---|
| 1947 | 3.54 | 3.18 |
| 1948 | 3.14 | 3.18 |
| 1949 | 3.55 | 3.18 |
| 1950 | 3.02 | 3.18 |
| 1951 | 3.02 | 3.18 |
| 1952 | 2.95 | 3.18 |
| 1953 | 3.29 | 3.18 |
| 1954 | 3.42 | 3.18 |
| 1955 | 3.44 | 3.18 |
| 1956 | 3.40 | 3.18 |
| 1957 | 3.79 | 3.18 |
| 1958 | 3.79 | 3.18 |
| 1959 | 4.23 | 3.18 |
| 1960 | 3.26 | 3.18 |
| 1961 | 3.54 | 3.18 |
| 1962 | 3.55 | 3.18 |
| 1963 | 3.65 | 3.18 |
| 1964 | 3.41 | 3.18 |
| 1965 | 3.32 | 3.18 |
| 1966 | 3.14 | 3.18 |
| 1967 | 3.09 | 3.18 |
| 1968 | 3.02 | 3.18 |
| 1969 | 3.10 | 3.18 |
| 1970 | 3.00 | 3.18 |
| 1971 | 2.85 | 3.18 |
| 1972 | 2.93 | 3.18 |
| 1973 | 2.72 | 3.18 |
| 1974 | 2.70 | 3.18 |
| 1975 | 2.29 | 3.18 |
| 1976 | 2.33 | 3.18 |
| 1977 | 2.43 | 3.18 |
| 1978 | 2.82 | 3.18 |
| 1979 | 3.26 | 3.18 |
| 1980 | 2.76 | 3.18 |
| 1981 | 2.98 | 3.18 |
| 1982 | 2.79 | 3.18 |
| 1983 | 2.79 | 3.18 |
| 1984 | 2.57 | 3.18 |
| 1985 | 3.12 | 3.18 |
| 1986 | 2.92 | 3.18 |
| 1987 | 2.62 | 3.18 |
| 1988 | 2.38 | 3.18 |
| 1989 | 2.63 | 3.18 |
| 1990 | 2.75 | 3.18 |
| 1991 | 3.12 | 3.18 |
| 1992 | 2.84 | 3.18 |
| 1993 | 3.05 | 3.18 |
| 1994 | 3.99 | 3.18 |
| 1995 | 4.11 | 3.18 |
| 1996 | 5.50 | 3.18 |
| 1997 | 5.28 | 3.18 |
| 1998 | 5.91 | 3.18 |
| 1999 | 6.03 | 3.18 |
| 2000 | 7.77 | 3.18 |
| 2001 | 6.88 | 3.18 |
| 2002 | 6.10 | 3.18 |
| 2003 | 5.40 | 3.18 |
| 2004 | 5.28 | 3.18 |
| 2005 | 5.18 | 3.18 |
| 2006 | 5.37 | 3.18 |
| 2007 | 4.36 | 3.18 |
| 2008 | 4.73 | 3.18 |
| 2009 | 4.61 | 3.18 |
| 2010 | 4.85 | 3.18 |
| 2011 | 5.30 | 3.18 |
| 2012 | 6.98 | 3.18 |
| 2013 | 6.63 | 3.18 |
| 2014 | 6.39 | 3.18 |
| 2015 | 6.29 | 3.18 |
| 2016 | 5.90 | 3.18 |
| 2017 | 6.01 | 3.18 |
| 2018 | 5.94 | 3.18 |
| 2019 | 6.44 | 3.18 |
| 2020 | 6.88 | 3.18 |

Note: Wages of top 0.1% of wage earners reflect W-2 annual earnings, which includes the value of exercised stock options and vested stock awards.
Source: Authors’ analysis of EPI State of Working America Data Library data on top 0.1% wages in Mishel and Kandra 2020 and data on CEO compensation from an extrapolation of Kaplan’s (2012b) CEO compensation series.