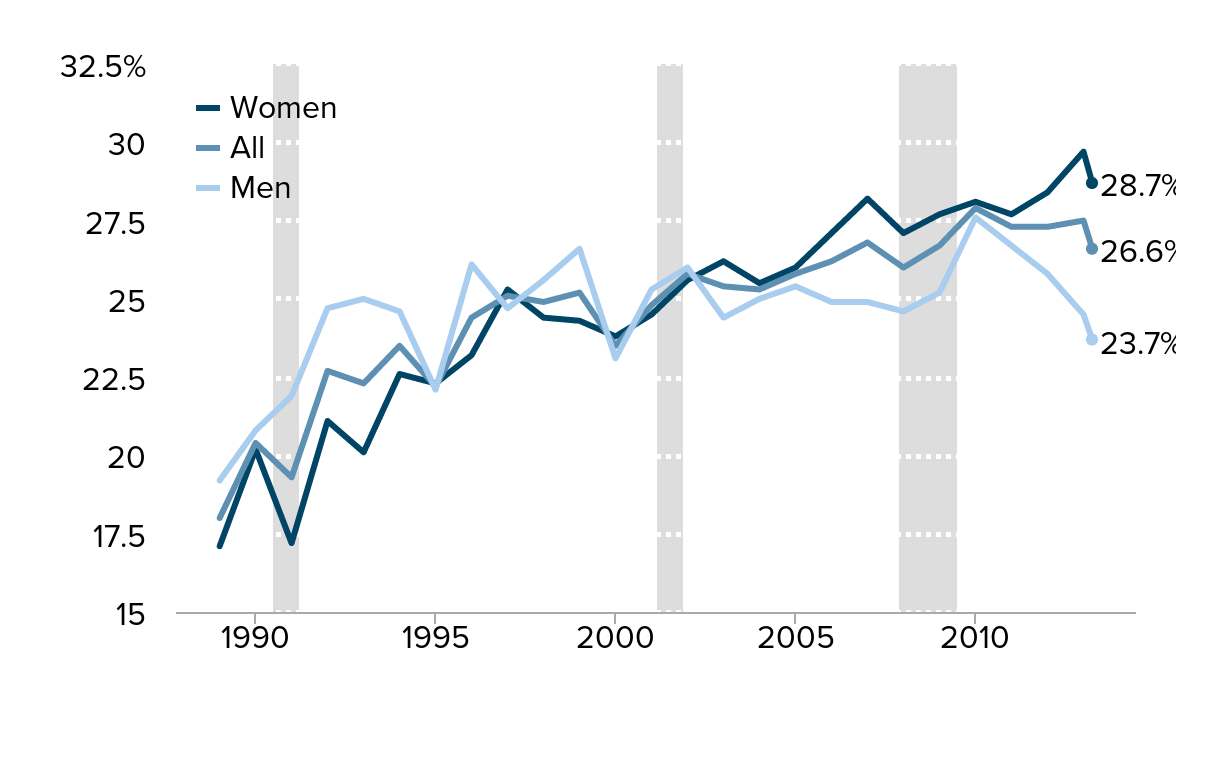
Share of young college graduates enrolled in further education, by gender, 1989–2014*
| Year | All | Men | Women |
|---|---|---|---|
| 1989 | 18.0% | 19.2% | 17.1% |
| 1990 | 20.4% | 20.8% | 20.2% |
| 1991 | 19.3% | 21.9% | 17.2% |
| 1992 | 22.7% | 24.7% | 21.1% |
| 1993 | 22.3% | 25.0% | 20.1% |
| 1994 | 23.5% | 24.6% | 22.6% |
| 1995 | 22.2% | 22.1% | 22.3% |
| 1996 | 24.4% | 26.1% | 23.2% |
| 1997 | 25.1% | 24.7% | 25.3% |
| 1998 | 24.9% | 25.6% | 24.4% |
| 1999 | 25.2% | 26.6% | 24.3% |
| 2000 | 23.5% | 23.1% | 23.8% |
| 2001 | 24.8% | 25.3% | 24.5% |
| 2002 | 25.8% | 26.0% | 25.6% |
| 2003 | 25.4% | 24.4% | 26.2% |
| 2004 | 25.3% | 25.0% | 25.5% |
| 2005 | 25.8% | 25.4% | 26.0% |
| 2006 | 26.2% | 24.9% | 27.1% |
| 2007 | 26.8% | 24.9% | 28.2% |
| 2008 | 26.0% | 24.6% | 27.1% |
| 2009 | 26.7% | 25.2% | 27.7% |
| 2010 | 27.9% | 27.6% | 28.1% |
| 2011 | 27.3% | 26.7% | 27.7% |
| 2012 | 27.3% | 25.8% | 28.4% |
| 2013 | 27.5% | 24.5% | 29.7% |
| 2013-04-01 | 26.6% | 23.7% | 28.7% |

* Data for 2014 represent 12-month average from April 2013–March 2014.
Note: Data are for college graduates (bachelor's degree only) age 21–24. Shaded areas denote recessions.
Source: Authors' analysis of Current Population Survey Outgoing Rotation Group microdata