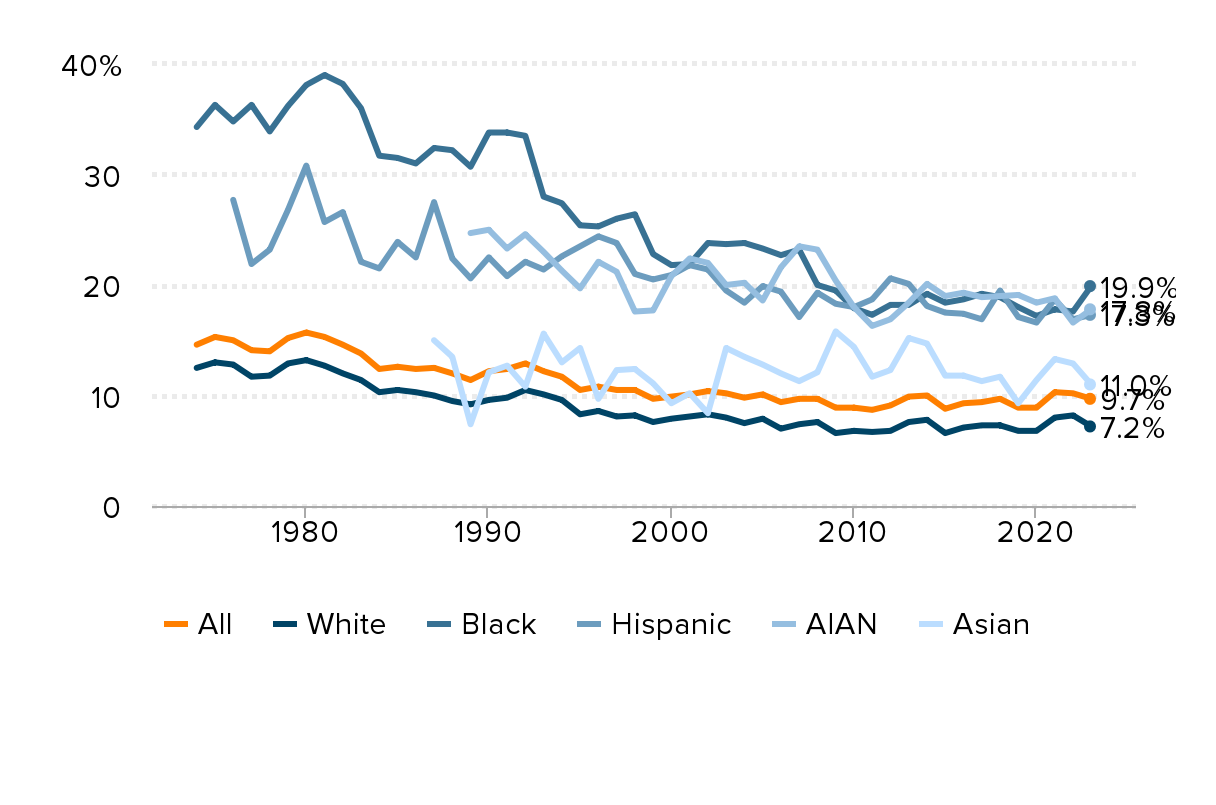
There are large racial disparities in poverty at older ages (65 and older)—likely reflecting differences in retirement preparedness and/or lifetime income disparities: Poverty rates for people ages 65 and older, by race and ethnicity, 1974–2023
| Year | All | White | Black | Hispanic | AIAN | Asian |
|---|---|---|---|---|---|---|
| 1974 | 14.6% | 12.5% | 34.3% | |||
| 1975 | 15.3 | 13.0 | 36.3 | |||
| 1976 | 15.0 | 12.8 | 34.8 | 27.7% | ||
| 1977 | 14.1 | 11.7 | 36.3 | 21.9 | ||
| 1978 | 14.0 | 11.8 | 33.9 | 23.2 | ||
| 1979 | 15.2 | 12.9 | 36.2 | 26.8 | ||
| 1980 | 15.7 | 13.2 | 38.1 | 30.8 | ||
| 1981 | 15.3 | 12.7 | 39.0 | 25.7 | ||
| 1982 | 14.6 | 12.0 | 38.2 | 26.6 | ||
| 1983 | 13.8 | 11.4 | 36.0 | 22.1 | ||
| 1984 | 12.4 | 10.3 | 31.7 | 21.5 | ||
| 1985 | 12.6 | 10.5 | 31.5 | 23.9 | ||
| 1986 | 12.4 | 10.3 | 31.0 | 22.5 | ||
| 1987 | 12.5 | 10.0 | 32.4 | 27.5 | 15.0% | |
| 1988 | 12.0 | 9.5 | 32.2 | 22.4 | 13.5 | |
| 1989 | 11.4 | 9.2 | 30.7 | 20.6 | 24.7% | 7.4 |
| 1990 | 12.2 | 9.6 | 33.8 | 22.5 | 25.0 | 12.1 |
| 1991 | 12.4 | 9.8 | 33.8 | 20.8 | 23.3 | 12.7 |
| 1992 | 12.9 | 10.5 | 33.5 | 22.1 | 24.6 | 10.8 |
| 1993 | 12.2 | 10.1 | 28.0 | 21.4 | 23.0 | 15.6 |
| 1994 | 11.7 | 9.6 | 27.4 | 22.6 | 21.3 | 13.0 |
| 1995 | 10.5 | 8.3 | 25.4 | 23.5 | 19.7 | 14.3 |
| 1996 | 10.8 | 8.6 | 25.3 | 24.4 | 22.1 | 9.7 |
| 1997 | 10.5 | 8.1 | 26.0 | 23.8 | 21.2 | 12.3 |
| 1998 | 10.5 | 8.2 | 26.4 | 21.0 | 17.6 | 12.4 |
| 1999 | 9.7 | 7.6 | 22.8 | 20.5 | 17.7 | 11.1 |
| 2000 | 9.9 | 7.9 | 21.8 | 20.9 | 20.8 | 9.3 |
| 2001 | 10.1 | 8.1 | 21.9 | 21.8 | 22.4 | 10.2 |
| 2002 | 10.4 | 8.3 | 23.8 | 21.4 | 22.0 | 8.4 |
| 2003 | 10.2 | 8.0 | 23.7 | 19.5 | 20.0 | 14.3 |
| 2004 | 9.8 | 7.5 | 23.8 | 18.4 | 20.2 | 13.5 |
| 2005 | 10.1 | 7.9 | 23.3 | 19.9 | 18.6 | 12.8 |
| 2006 | 9.4 | 7.0 | 22.7 | 19.4 | 21.6 | 12.0 |
| 2007 | 9.7 | 7.4 | 23.2 | 17.1 | 23.5 | 11.3 |
| 2008 | 9.7 | 7.6 | 20.0 | 19.3 | 23.2 | 12.1 |
| 2009 | 8.9 | 6.6 | 19.5 | 18.3 | 20.4 | 15.8 |
| 2010 | 8.9 | 6.8 | 17.9 | 18.0 | 18.0 | 14.4 |
| 2011 | 8.7 | 6.7 | 17.3 | 18.7 | 16.3 | 11.7 |
| 2012 | 9.1 | 6.8 | 18.2 | 20.6 | 16.9 | 12.3 |
| 2013 | 9.9 | 7.6 | 18.2 | 20.1 | 18.4 | 15.2 |
| 2014 | 10.0 | 7.8 | 19.2 | 18.1 | 20.1 | 14.7 |
| 2015 | 8.8 | 6.6 | 18.4 | 17.5 | 19.0 | 11.8 |
| 2016 | 9.3 | 7.1 | 18.7 | 17.4 | 19.3 | 11.8 |
| 2017 | 9.4 | 7.3 | 19.2 | 16.9 | 18.9 | 11.3 |
| 2018 | 9.7 | 7.3 | 18.9 | 19.5 | 19.0 | 11.7 |
| 2019 | 8.9 | 6.8 | 18.0 | 17.1 | 19.1 | 9.3 |
| 2020 | 8.9 | 6.8 | 17.2 | 16.6 | 18.4 | 11.4 |
| 2021 | 10.3 | 8.0 | 17.8 | 18.7 | 18.8 | 13.3 |
| 2022 | 10.2 | 8.2 | 17.6 | 16.9 | 16.6 | 12.9 |
| 2023 | 9.7 | 7.2 | 19.9 | 17.3 | 17.8 | 11.0 |

Notes: AIAN refers to American Indian and Alaska Native. All race categories are single race and do not distinguish Hispanic ethnicity from non-Hispanic ethnicity, except for white, which is exclusive of Hispanic ethnicity (i.e., non-Hispanic white alone, Black alone, AIAN alone, and Asian alone).Hispanic can be of any race. AIAN data are 3-year pooled averages to account for sample size restrictions. Please see Appendix Table 1 for 1-year estimates.
Source: Economic Policy Institute analysis of U.S. Census Bureau Current Population Survey Poverty in the United States, Table A-3.
Source: Economic Policy Institute analysis of U.S. Census Bureau Current Population Survey–Annual Social and Economic Supplements 1959 to 2023. “Table A-3. Poverty Status of People by Age, Race, and Hispanic Origin: 1959 to 2023” (Excel table) from Poverty in the United States: 2023, September 2024.