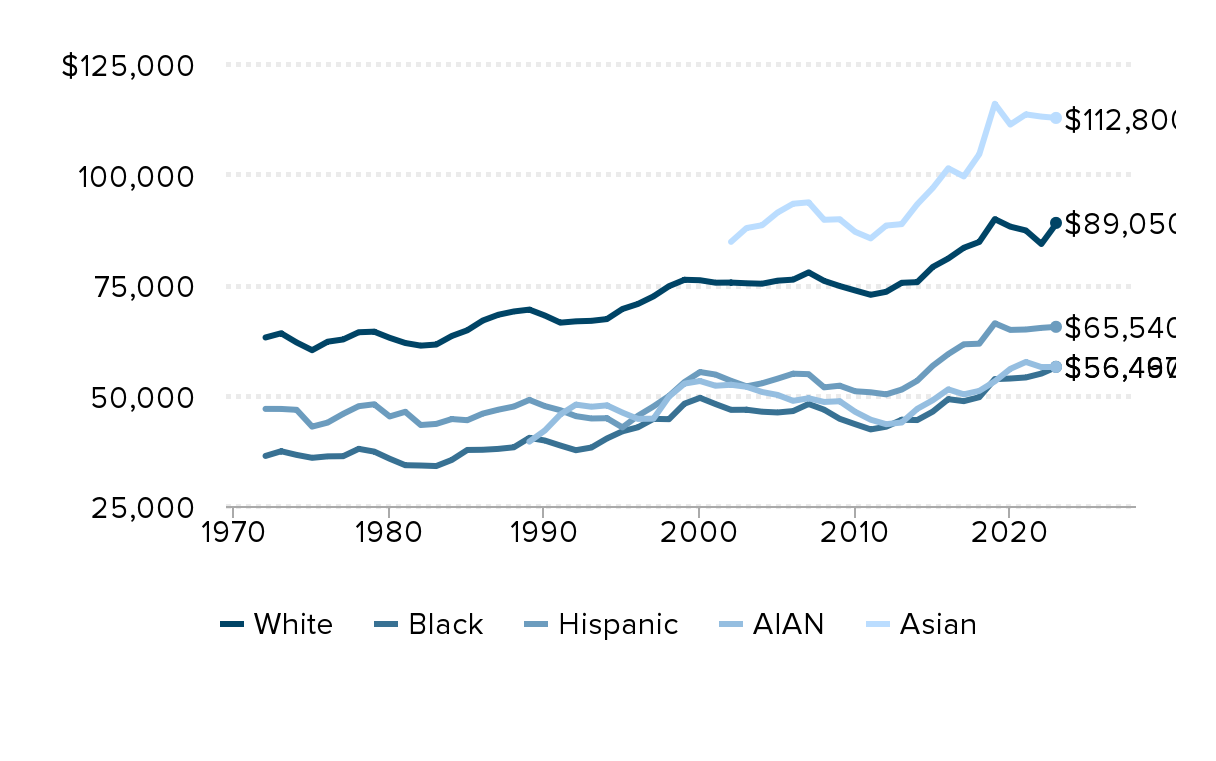
Racial and ethnic disparities in median household income have been largely persistent across time: Inflation-adjusted median household income (2023 dollars), by race and ethnicity, 1972–2023
| Year | White | Black | Hispanic | AIAN | Asian |
|---|---|---|---|---|---|
| 1972 | $63,130 | $36,330 | $46,970 | ||
| 1973 | 64,080 | 37,390 | 46,960 | ||
| 1974 | 62,000 | 36,560 | 46,760 | ||
| 1975 | 60,250 | 35,900 | 42,960 | ||
| 1976 | 62,170 | 36,230 | 43,870 | ||
| 1977 | 62,680 | 36,270 | 45,850 | ||
| 1978 | 64,310 | 37,930 | 47,580 | ||
| 1979 | 64,440 | 37,310 | 48,020 | ||
| 1980 | 63,050 | 35,690 | 45,260 | ||
| 1981 | 61,880 | 34,230 | 46,310 | ||
| 1982 | 61,280 | 34,160 | 43,320 | ||
| 1983 | 61,530 | 34,040 | 43,570 | ||
| 1984 | 63,460 | 35,420 | 44,670 | ||
| 1985 | 64,750 | 37,680 | 44,410 | ||
| 1986 | 66,960 | 37,720 | 45,910 | ||
| 1987 | 68,270 | 37,920 | 46,790 | ||
| 1988 | 69,010 | 38,280 | 47,500 | ||
| 1989 | 69,430 | 40,420 | 49,000 | $39,563 | |
| 1990 | 68,090 | 39,810 | 47,600 | 42,083 | |
| 1991 | 66,480 | 38,680 | 46,670 | 45,713 | |
| 1992 | 66,780 | 37,620 | 45,330 | 47,937 | |
| 1993 | 66,890 | 38,230 | 44,800 | 47,457 | |
| 1994 | 67,290 | 40,280 | 44,860 | 47,767 | |
| 1995 | 69,570 | 41,900 | 42,780 | 46,133 | |
| 1996 | 70,710 | 42,810 | 45,410 | 44,703 | |
| 1997 | 72,430 | 44,710 | 47,530 | 44,757 | |
| 1998 | 74,730 | 44,640 | 49,890 | 49,753 | |
| 1999 | 76,180 | 48,150 | 53,040 | 52,690 | |
| 2000 | 76,080 | 49,470 | 55,310 | 53,277 | |
| 2001 | 75,520 | 48,060 | 54,740 | 52,210 | |
| 2002 | 75,550 | 46,750 | 53,320 | 52,427 | $84,770 |
| 2003 | 75,390 | 46,780 | 52,070 | 51,977 | 87,890 |
| 2004 | 75,290 | 46,330 | 52,760 | 50,793 | 88,520 |
| 2005 | 75,980 | 46,160 | 53,810 | 50,130 | 91,400 |
| 2006 | 76,210 | 46,480 | 54,930 | 48,790 | 93,390 |
| 2007 | 77,850 | 48,080 | 54,830 | 49,377 | 93,700 |
| 2008 | 75,930 | 46,790 | 51,840 | 48,540 | 89,750 |
| 2009 | 74,770 | 44,730 | 52,220 | 48,703 | 89,880 |
| 2010 | 73,760 | 43,510 | 50,960 | 46,313 | 87,030 |
| 2011 | 72,780 | 42,330 | 50,730 | 44,523 | 85,550 |
| 2012 | 73,460 | 42,940 | 50,260 | 43,507 | 88,450 |
| 2013 | 75,500 | 44,510 | 51,340 | 43,893 | 88,775 |
| 2014 | 75,640 | 44,440 | 53,340 | 46,977 | 93,270 |
| 2015 | 79,080 | 46,350 | 56,720 | 48,927 | 96,940 |
| 2016 | 80,990 | 49,170 | 59,370 | 51,387 | 101,400 |
| 2017 | 83,420 | 48,720 | 61,585 | 50,260 | 99,565 |
| 2018 | 84,740 | 49,620 | 61,720 | 51,043 | 104,600 |
| 2019 | 89,900 | 53,710 | 66,330 | 53,203 | 116,000 |
| 2020 | 88,200 | 53,840 | 64,840 | 56,020 | 111,300 |
| 2021 | 87,340 | 54,080 | 64,930 | 57,590 | 113,600 |
| 2022 | 84,280 | 54,960 | 65,300 | 56,433 | 113,100 |
| 2023 | 89,050 | 56,490 | 65,540 | 56,467 | 112,800 |

Note: AIAN refers to American Indian and Alaska Native. All race categories are single race and do not distinguish Hispanic ethnicity from non-Hispanic ethnicity, except for white, which is exclusive of Hispanic ethnicity (i.e., non-Hispanic white alone, Black alone, AIAN alone, and Asian alone). Hispanic can be of any race. AIAN data are 3-year pooled averages to account for sample size restrictions. Please see Appendix Table 1 for 1-year estimates.
Notes: AIAN refers to American Indian and Alaska Native.All race categories are single race and do not distinguish Hispanic ethnicity from non-Hispanic ethnicity, except for white, which is exclusive of Hispanic ethnicity (i.e., non-Hispanic white alone, Black alone, AIAN alone, and Asian alone). Hispanic can be of any race. AIAN data are 3-year pooled averages to account for sample size restrictions. Please see Appendix Table 1 for 1-year estimates. Due to a redesign of the income questions in the Current Population Survey— Annual Social and Economic Supplement (CPS ASEC) in 2013 and an update to the CPS ASEC processing system in 2017, the U.S. Census Bureau reported two estimates of income in each of those years. The 2013 and 2017 income values in this graph are an average of the two estimates reported in each year.
Source: Economic Policy Institute analysis of U.S. Census Bureau Current Population Survey, Income and Poverty in the United States 2023 data, Table A-2.
Source: Economic Policy Institute analysis of U.S. Census Bureau, Current Population Survey–Annual Social and Economic Supplements 1968 to 2023. “Table A-2. Households by Total Money Income, Race, and Hispanic Origin of Householder: 1967 to 2023” (Excel table) from Income and Poverty in the United States: 2023, September 2024.