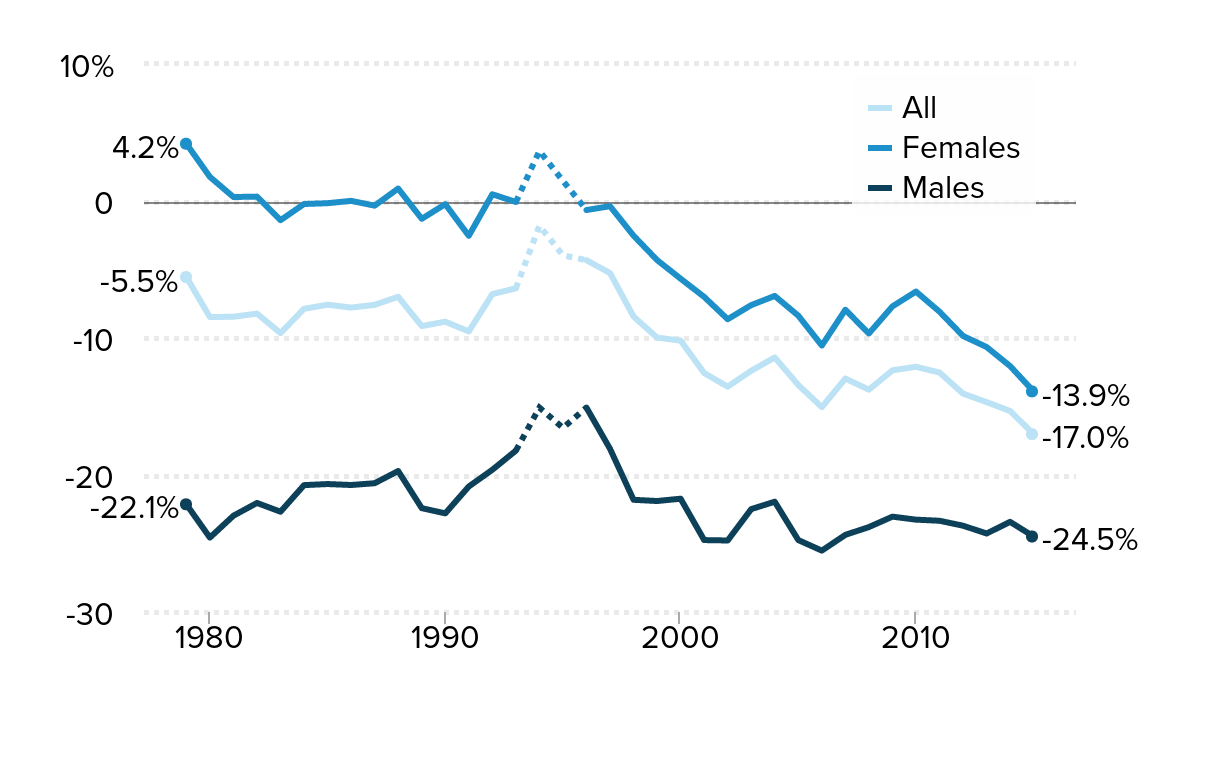
The teacher wage gap grew from -5.5 percent in 1979 to a record -17.0 percent in 2015: Wage gap between public school teachers and similar workers, 1979–2015
| Year | All | Females | Males | All 1993-1996 | Females 1993-1996 | Males 1993-1996 | All 1996-2015 | Females 1996-2015 | Males 1996-2015 |
|---|---|---|---|---|---|---|---|---|---|
| 1979 | -5.55% | 4.18% | -22.14% | ||||||
| 1980 | -8.47% | 1.76% | -24.57% | ||||||
| 1981 | -8.45% | 0.29% | -22.97% | ||||||
| 1982 | -8.22% | 0.32% | -22.04% | ||||||
| 1983 | -9.64% | -1.40% | -22.68% | ||||||
| 1984 | -7.87% | -0.22% | -20.74% | ||||||
| 1985 | -7.57% | -0.16% | -20.66% | ||||||
| 1986 | -7.78% | 0.01% | -20.73% | ||||||
| 1987 | -7.58% | -0.34% | -20.60% | ||||||
| 1988 | -6.99% | 0.91% | -19.71% | ||||||
| 1989 | -9.13% | -1.30% | -22.42% | ||||||
| 1990 | -8.81% | -0.23% | -22.80% | ||||||
| 1991 | -9.52% | -2.54% | -20.84% | ||||||
| 1992 | -6.80% | 0.49% | -19.62% | ||||||
| 1993 | -6.37% | -0.07% | -18.22% | -6.37% | -0.07% | -18.22% | |||
| 1994 | -1.81% | 3.65% | -15.08% | ||||||
| 1995 | -3.96% | 1.47% | -16.56% | ||||||
| 1996 | -4.32% | -0.66% | -15.08% | -4.32% | -0.66% | -15.08% | |||
| 1997 | -5.26% | -0.38% | -18.09% | ||||||
| 1998 | -8.43% | -2.53% | -21.81% | ||||||
| 1999 | -9.97% | -4.31% | -21.90% | ||||||
| 2000 | -10.19% | -5.67% | -21.73% | ||||||
| 2001 | -12.56% | -7.00% | -24.75% | ||||||
| 2002 | -13.55% | -8.63% | -24.78% | ||||||
| 2003 | -12.39% | -7.60% | -22.49% | ||||||
| 2004 | -11.42% | -6.93% | -21.95% | ||||||
| 2005 | -13.43% | -8.37% | -24.75% | ||||||
| 2006 | -15.05% | -10.55% | -25.52% | ||||||
| 2007 | -12.96% | -7.94% | -24.37% | ||||||
| 2008 | -13.77% | -9.67% | -23.80% | ||||||
| 2009 | -12.36% | -7.69% | -23.04% | ||||||
| 2010 | -12.10% | -6.61% | -23.26% | ||||||
| 2011 | -12.52% | -8.08% | -23.34% | ||||||
| 2012 | -14.06% | -9.85% | -23.70% | ||||||
| 2013 | -14.68% | -10.66% | -24.27% | ||||||
| 2014 | -15.33% | -12.05% | -23.42% | ||||||
| 2015 | -17.02% | -13.90% | -24.49% |

Note: Figure compares weekly wages. Regression-adjusted estimates include controls for age (quartic), education, race/ethnicity, geographical region, marital status, and gender for the pooled sample. Data are for workers age 18–64 with positive wages (excluding self-employed workers). Non-imputed data are not available for 1994 and 1995; data points for these years have been extrapolated and are represented by dotted lines (see Appendix A for more detail).
Source: Authors' analysis of Current Population Survey Outgoing Rotation Group data