Wage growth targets are good economics—if you get the details right: EPI Macroeconomics Newsletter

Josh Bivens, director of research at EPI
Earlier this month, Olivier Blanchard—the former chief economist at the International Monetary Fund and an influential figure in macroeconomics—suggested that the Federal Reserve should consider targeting inflation in nominal wages rather than (or in addition to) inflation in prices. I was predictably intrigued by this: I proposed a nominal wage inflation target for the Fed a few years back.
This edition of the newsletter quickly sketches out the logic of a nominal wage inflation target to guide Fed decision-making on interest rates, and it highlights one particularly important detail: the assumed rate of productivity growth used to specify the target. If the rate of productivity growth is endogenous to the degree of labor market slack (as some evidence indicates), then using real-time estimates of productivity growth as an input into the wage target could threaten to lock in the damage to wage growth done by too-slack labor markets.
The key takeaways are:
- A nominal wage growth target has many virtues over the Fed’s current approach of targeting price inflation.
- Price inflation is affected by many factors besides the pace of wage growth, yet only wage growth is the proper target for the Fed’s aggregate demand management. A wage growth target hence carries more signal and less noise than the price inflation target.
- One key determinant of price inflation—the size of markups of firms’ prices over labor costs—actually varies countercyclically over wide phases of the business cycle. This introduces unuseful noise into the target the Fed is aiming for.
- A relatively long-lagged measure of trend productivity growth is the best input to use for specifying a nominal wage target.
- High-frequency (real-time) measures of productivity growth are notoriously volatile, making them a bad input for any policy target.
- As the economy exits a steep recession, real-time measures of productivity growth can be dragged down by the wage-suppressing effects of lingering labor market slack. Using these real-time measures in the construction of a nominal wage target can lead to a too-conservative target and prompt the Fed to raise interest rates prematurely.
- There is some preliminary evidence that the steady tightening of U.S. labor markets over the past decade seems to finally be pushing up productivity growth rates. This provides more evidence that accepting low productivity growth rates posted when there was substantial labor market slack as unchangeable could be a large policy error.
What is a nominal wage target and why does it makes sense?
It is relatively well known that the Fed has a target for price inflation—2%—and that this target guides its decisions on setting interest rates. Given this price inflation target, as long as one is willing to make an assumption about the underlying trend in productivity growth, it is possible to specify a nominal wage inflation target that is consistent with an overall price inflation target.
The short version of this nominal wage target is that it should equal the sum of the Fed’s price inflation target plus the estimated trend rate of productivity growth. Productivity is simply the amount of output (i.e., income) produced in an average hour of work in the economy. As long as nominal wages are growing at or beneath the rate of productivity growth, then labor costs are putting no upward pressure on prices. Say that both nominal wages and productivity rose 2% in a year. Hourly wages climb 2%, but the amount produced in each hour of work—the definition of productivity—also rises by 2%, so costs per unit of output (i.e., prices) would not rise.
Of course, the Fed isn’t committed to zero upward pressure on prices. Fed officials say they’re comfortable with 2% price inflation. (I’d argue that they should be comfortable with inflation well above that, but we’ll take their target for now.) This price inflation target means that nominal wage growth can be 2% higher than trend productivity growth before wages threaten to push price inflation over the Fed’s target. If trend productivity growth is estimated to be 1.5%, this would mean that nominal wage growth of 3.5% would be needed before labor costs stopped dragging on the Fed’s ability to push price inflation up to its 2% target.
However, while it’s possible to specify a nominal wage growth target that is consistent with the Fed’s 2% price inflation target, is it useful to do this? It is. Put simply, the only determinant of price inflation that the Fed should reliably try to control is wage growth. Wages (or labor costs generally) are by far the largest single component of costs, so the Fed having influence only over wages with its interest-rate setting is not a problem per se. But nonwage determinants of price inflation either cannot or should not be targeted by the Fed as it raises rates as the economy heats up or lowers rates as the economy cools down.
Take the most obvious case where nonwage determinants should not factor into the Fed’s decision-making on inflation: the distinction between core and noncore prices. The Fed tends to ignore price inflation changes stemming from the volatile prices of food and energy. It is right to do this: Food or energy prices can spike upward even in a depressed economy simply because the weather changes. It would be a disaster if the Fed responded to food and energy price spikes when the economy is depressed by raising rates. This is not an academic concern: In 2011 the European Central Bank (ECB) raised rates twice, hard on the heels of the Great Recession, because of a small transitory increase in inflation. This was a grievous policy mistake.
Take a less obvious case of when nonwage determinants of prices can send the wrong signal to the Fed: the rise and fall of profit margins. Given the large and prolonged rise in unemployment stemming from the Great Recession, one might have expected a collapse in price inflation, or maybe even deflation, in the years after 2009. Yet price inflation (after stripping out food and energy) held up reasonably well. In fact, looking only at the price data might have convinced some that aggregate demand (spending by households, businesses, and governments) was not really all that depressed relative to the economy’s potential. But even as price inflation held up reasonably well, unit labor costs saw zero growth for a number of years. The only thing that kept price inflation from stagnating was an enormous increase in profit margins. In this case, trends in the labor market (flat unit labor costs stemming from anemic wage growth) were providing a much better signal of continued slack in aggregate demand than trends in price inflation (which was subdued, but not terribly so). In the years following the Great Recession, the Fed did the right thing in putting much more weight on wage growth than price inflation and kept monetary policy strongly expansionary. It was right to do so. Why not just operationalize this more formally by specifying a wage target?
Why the right productivity assumption is crucial for specifying the right wage growth target
In his remarks calling for a wage growth target, Blanchard argued that the target had essentially already been hit and that “we are more or less at full employment.” More specifically, he indicated that 1% should be taken as the proper assumption regarding productivity growth: “So, when you see wage inflation at 3% and you see productivity [growth] of 1% then you’re home.”
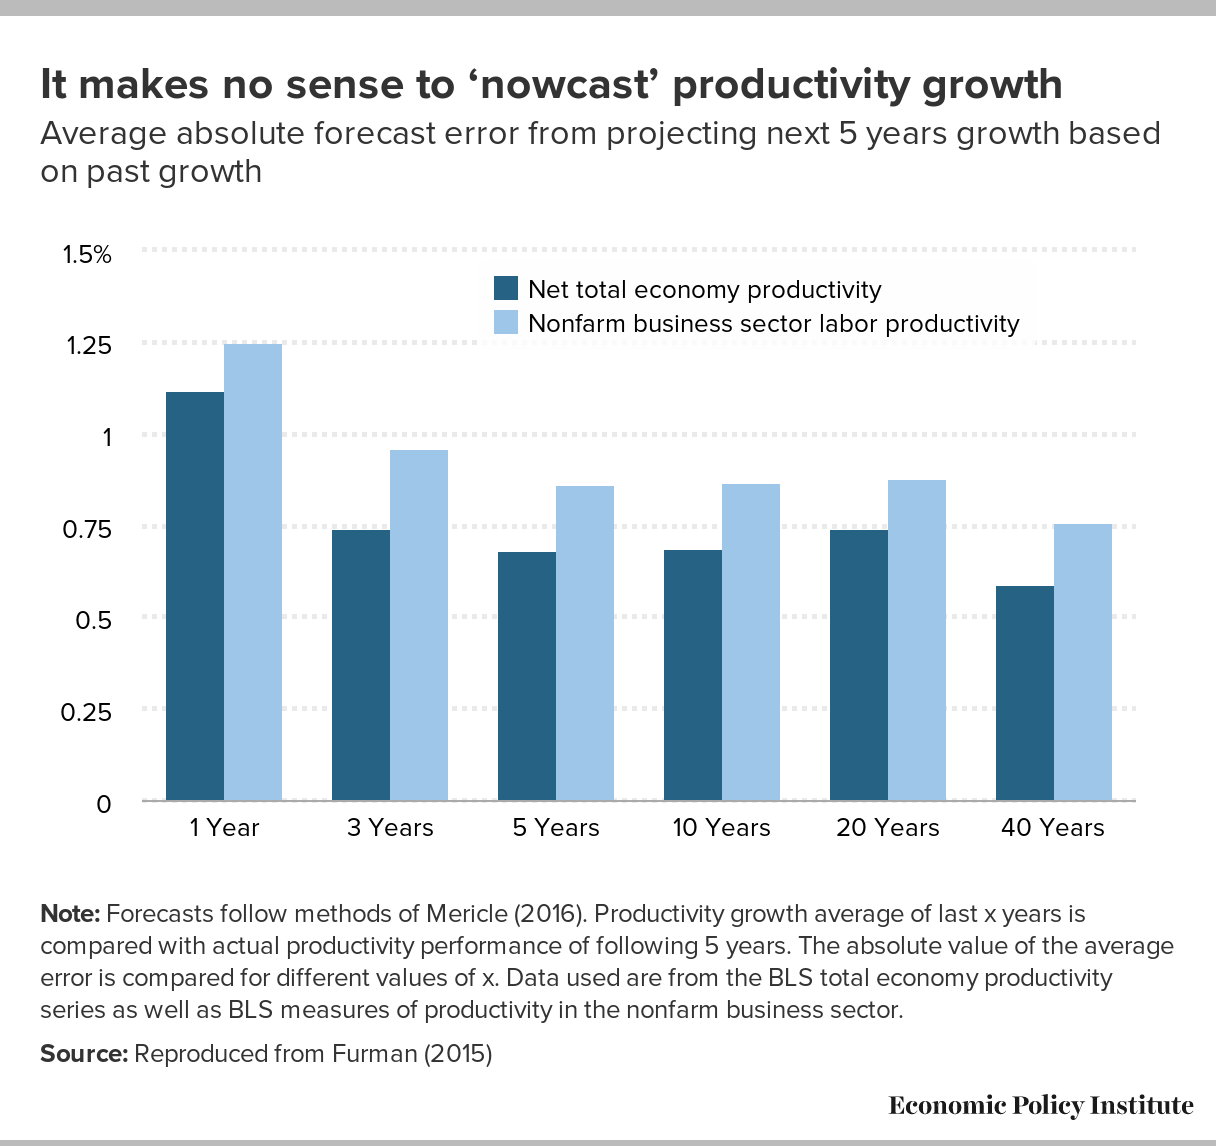
But a 1% productivity growth assumption is too pessimistic. It’s true that a three-year rolling average of productivity growth since 2008 saw it sit below 1% between 2011 and 2018. However, it has been shown decisively that when forecasting future productivity growth, one should use a long lag of past trends—even longer than seven years. In this longer run, 1.5% is a conservative estimate of trend productivity growth.
The need to examine long-run trends when making productivity forecasts is especially true given that the weak productivity growth of the current decade is almost certainly a casualty of the slack demand caused by the Great Recession. Surely it’s not a coincidence that productivity growth collapsed right as the economy entered the worst recession in many generations. Further, there is compelling evidence that a tightening labor market can spur labor-saving investments and organizational change. The logic is simple: When workers are plentiful and cheap because the economy is depressed, containing future labor costs is not a huge priority for businesses—and they certainly may be loath to borrow or take on other risk to make uncertain investments to keep labor costs in check. But when labor markets tighten and wage growth solidifies, investments to contain future labor costs make a lot more sense.
I noted nearly two years ago that tightening labor markets appeared to be nudging up productivity growth. This nudge seems to have become a shove in recent quarters. Figure A shows the three-year average of productivity growth (measured as total economy productivity—the broadest measure). Given how volatile short-run measures of productivity are, three years is essentially the shortest timespan over which one can look at these trends to get any signal at all through the noise. As we noted earlier, for forecasting future trends, one would want to look over a much longer past period. The spike in productivity shown on the graph during the worst of the Great Recession is a statistical fluke indicating only that employment actually fell faster than gross domestic product (GDP) in these years. The key thing to focus on is the sharp recent upturn within the last two years: Productivity growth is indeed closing in rapidly on the longer-run trend of 1.5%.
Tightening labor markets are finally pushing up productivity growth: Three-year average productivity growth rate, 2006Q1–2019Q2
| Productivity growth | |
|---|---|
| 2006-Q1 | 2.522% |
| 2006-Q2 | 2.062% |
| 2006-Q3 | 1.356% |
| 2006-Q4 | 1.208% |
| 2007-Q1 | 1.249% |
| 2007-Q2 | 1.098% |
| 2007-Q3 | 1.153% |
| 2007-Q4 | 0.974% |
| 2008-Q1 | 0.596% |
| 2008-Q2 | 0.914% |
| 2008-Q3 | 0.750% |
| 2008-Q4 | 0.303% |
| 2009-Q1 | 0.347% |
| 2009-Q2 | 0.865% |
| 2009-Q3 | 1.544% |
| 2009-Q4 | 1.879% |
| 2010-Q1 | 1.936% |
| 2010-Q2 | 1.836% |
| 2010-Q3 | 1.892% |
| 2010-Q4 | 1.887% |
| 2011-Q1 | 1.851% |
| 2011-Q2 | 1.586% |
| 2011-Q3 | 1.425% |
| 2011-Q4 | 2.001% |
| 2012-Q1 | 1.888% |
| 2012-Q2 | 1.499% |
| 2012-Q3 | 0.747% |
| 2012-Q4 | 0.214% |
| 2013-Q1 | 0.359% |
| 2013-Q2 | 0.363% |
| 2013-Q3 | 0.173% |
| 2013-Q4 | 0.179% |
| 2014-Q1 | 0.220% |
| 2014-Q2 | 0.401% |
| 2014-Q3 | 0.809% |
| 2014-Q4 | 0.410% |
| 2015-Q1 | 0.458% |
| 2015-Q2 | 0.490% |
| 2015-Q3 | 0.796% |
| 2015-Q4 | 0.666% |
| 2016-Q1 | 0.444% |
| 2016-Q2 | 0.524% |
| 2016-Q3 | 0.517% |
| 2016-Q4 | 0.610% |
| 2017-Q1 | 0.811% |
| 2017-Q2 | 0.582% |
| 2017-Q3 | 0.555% |
| 2017-Q4 | 0.711% |
| 2018-Q1 | 0.664% |
| 2018-Q2 | 0.679% |
| 2018-Q3 | 0.613% |
| 2018-Q4 | 0.780% |
| 2019-Q1 | 1.250% |
| 2019-Q2 | 1.379% |
Note: Productivity measure is total economy productivity (TEP), a nonpublished data series from the Bureau of Labor Statistics. Line shows the annualized average rate of growth over the most recent three years. Shaded area indicates recession.
Source: Bureau of Labor Statistics
Given that the Fed should be looking to overshoot any long-run wage target for a long spell to undo damage done by years of undershooting, the choice of productivity assumption matters a lot here. Figure B compares cumulative growth in (real) wages and productivity with productivity at a 1.5% growth trend. If wage levels just need to regain the level implied by growth in actual productivity in recent years (i.e., rise fast enough to close the gap between the bottom two lines), then this should not take too much more time. If, however, we want to target a clawback of productivity lost due to demand weakness in the post–Great Recession period (i.e., close the gap between the top and bottom lines by accelerating actual productivity growth), then labor markets will need to be hot for quite a long time.
Wage target shouldn't be set too low: Cumulative growth in real wages, productivity, and 1.5% trend productivity growth, 2006Q1–2019Q2
| year | Nominal wage growth minus 2% | Actual productivity growth | 1.5% trend productivity |
|---|---|---|---|
| 2006-Q1 | 0.0 | 0.0 | 0.0 |
| 2006-Q2 | 0.5 | 0.5 | 0.4 |
| 2006-Q3 | 1.0 | 0.9 | 0.7 |
| 2006-Q4 | 1.5 | 1.2 | 1.1 |
| 2007-Q1 | 2.0 | 1.5 | 1.5 |
| 2007-Q2 | 2.6 | 1.7 | 1.9 |
| 2007-Q3 | 3.1 | 2.0 | 2.3 |
| 2007-Q4 | 3.5 | 2.3 | 2.6 |
| 2008-Q1 | 4.0 | 2.4 | 3.0 |
| 2008-Q2 | 4.4 | 2.7 | 3.4 |
| 2008-Q3 | 4.9 | 2.9 | 3.8 |
| 2008-Q4 | 5.4 | 2.9 | 4.2 |
| 2009-Q1 | 5.8 | 3.0 | 4.6 |
| 2009-Q2 | 6.1 | 3.3 | 5.0 |
| 2009-Q3 | 6.3 | 3.6 | 5.3 |
| 2009-Q4 | 6.4 | 4.1 | 5.7 |
| 2010-Q1 | 6.6 | 4.6 | 6.1 |
| 2010-Q2 | 6.7 | 5.1 | 6.5 |
| 2010-Q3 | 6.8 | 5.6 | 6.9 |
| 2010-Q4 | 6.8 | 6.1 | 7.3 |
| 2011-Q1 | 6.9 | 6.6 | 7.7 |
| 2011-Q2 | 6.9 | 7.0 | 8.1 |
| 2011-Q3 | 6.9 | 7.4 | 8.5 |
| 2011-Q4 | 6.9 | 7.9 | 8.9 |
| 2012-Q1 | 6.7 | 8.4 | 9.3 |
| 2012-Q2 | 6.6 | 8.8 | 9.8 |
| 2012-Q3 | 6.5 | 9.0 | 10.2 |
| 2012-Q4 | 6.3 | 9.1 | 10.6 |
| 2013-Q1 | 6.3 | 9.2 | 11.0 |
| 2013-Q2 | 6.3 | 9.3 | 11.4 |
| 2013-Q3 | 6.3 | 9.3 | 11.8 |
| 2013-Q4 | 6.4 | 9.4 | 12.2 |
| 2014-Q1 | 6.5 | 9.4 | 12.6 |
| 2014-Q2 | 6.6 | 9.6 | 13.1 |
| 2014-Q3 | 6.7 | 9.8 | 13.5 |
| 2014-Q4 | 6.7 | 9.9 | 13.9 |
| 2015-Q1 | 6.7 | 10.0 | 14.3 |
| 2015-Q2 | 6.7 | 10.1 | 14.8 |
| 2015-Q3 | 6.7 | 10.4 | 15.2 |
| 2015-Q4 | 6.8 | 10.5 | 15.6 |
| 2016-Q1 | 6.9 | 10.7 | 16.1 |
| 2016-Q2 | 7.0 | 10.8 | 16.5 |
| 2016-Q3 | 7.2 | 11.0 | 16.9 |
| 2016-Q4 | 7.3 | 11.1 | 17.4 |
| 2017-Q1 | 7.4 | 11.3 | 17.8 |
| 2017-Q2 | 7.5 | 11.5 | 18.2 |
| 2017-Q3 | 7.6 | 11.7 | 18.7 |
| 2017-Q4 | 7.7 | 11.9 | 19.1 |
| 2018-Q1 | 7.8 | 12.0 | 19.6 |
| 2018-Q2 | 8.1 | 12.2 | 20.0 |
| 2018-Q3 | 8.3 | 12.4 | 20.5 |
| 2018-Q4 | 8.7 | 12.6 | 20.9 |
| 2019-Q1 | 9.1 | 13.0 | 21.4 |
| 2019-Q2 | 9.4 | 13.4 | 21.8 |
Note: The real wage measure is constructed by calculating growth in average hourly earnings from the Bureau of Labor Statistics (BLS) Current Employment Statistics (CES) program and subtracting 2% annualized growth to reflect the Fed's inflation target. Productivity growth is the same measure as Figure A, and the trend line shows growth at a 1.5% annualized rate.
Source: Bureau of Labor Statistics
Year-over-year nominal wage growth has flattened out well below 3.5% in 2019. Adopting a 1.5% productivity growth assumption for nominal wage targeting implies that this is below full employment levels—and that a long period of being above full employment is still needed to undo the wage-flattening effects of the many years of below-target growth. Olivier Blanchard’s reintroduction of nominal wage inflation as a target of monetary policy is most welcome, but we should be careful about what assumptions are being embedded in this target when we pin a number to it.
Enjoyed this post?
Sign up for EPI's newsletter so you never miss our research and insights on ways to make the economy work better for everyone.