Cutting UI benefits by $400 per week will significantly harm U.S. families, jobs, and growth: 3.4 million fewer jobs will be created over the next year as a result
Last month, we estimated the effect of allowing the $600 supplement to weekly unemployment insurance (UI) benefits to lapse at the end of July, as is currently scheduled. We found that this would strip away enough aggregate demand from the economy to slow growth in gross domestic product (GDP) by 3.7% over the next year. This slower growth would result in 5.1 million fewer jobs created over the next year.
Currently Senate Republicans are offering a proposal to reduce this weekly $600 supplement to closer to $200. This is better than allowing the $600 benefit to go all the way to zero, but this would still lead to GDP that was lower by 2.5% a year from now and would lead to 3.4 million fewer jobs created over the next year.
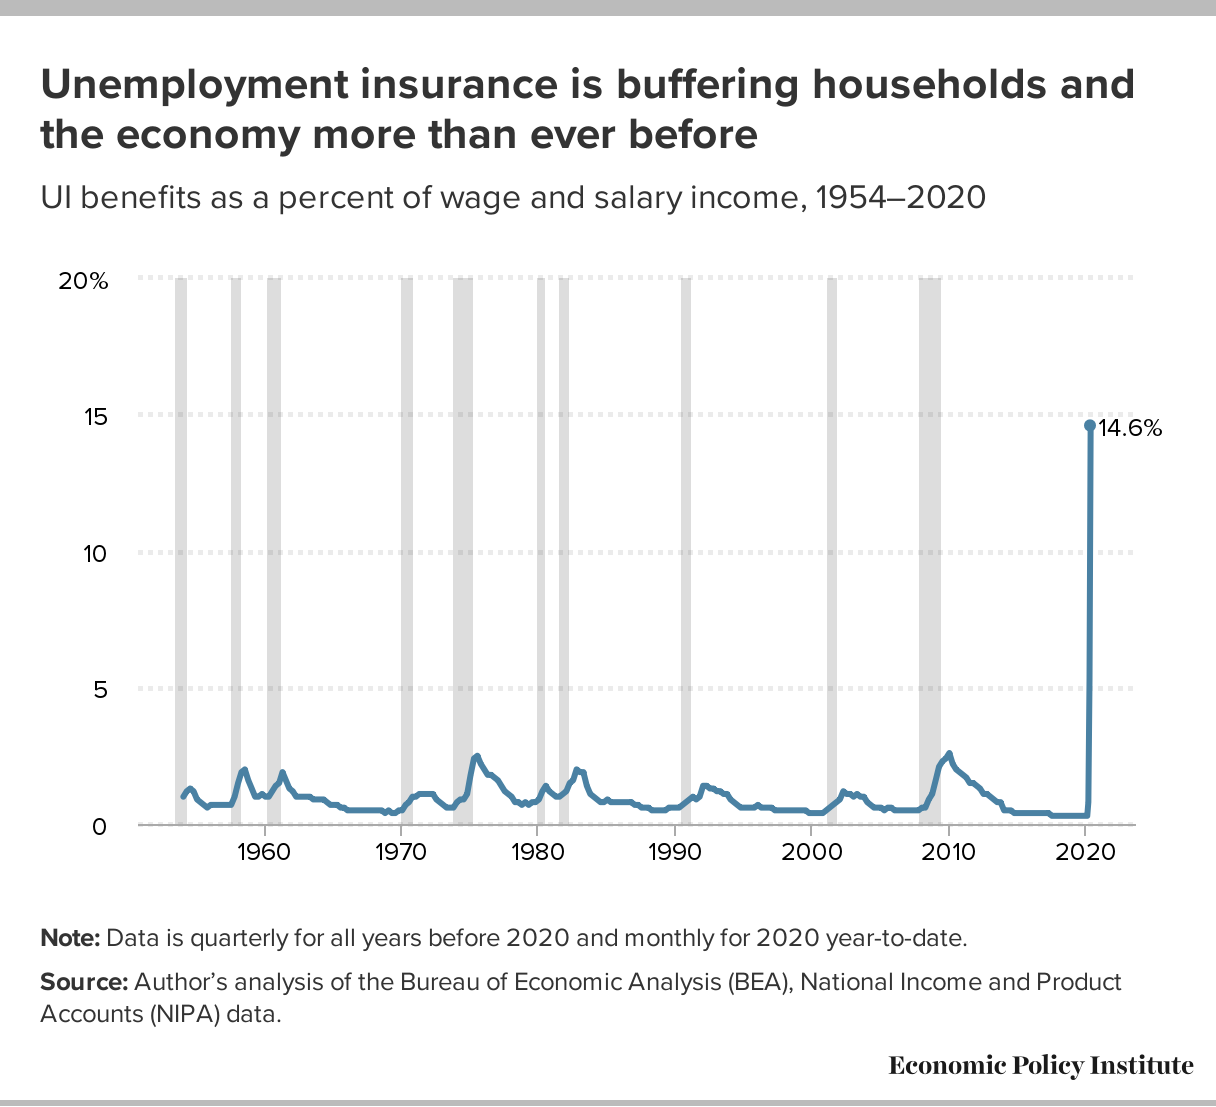
These are huge numbers—but they are driven by the fact that the support this extra $600 has given tens of millions of working families is huge. The economic shock of COVID-19 was enormous, but the large expansions to the UI system included in the CARES Act of March were incredibly effective in blunting the effect of this shock. The only problem with these expansions was that they begin running out next week—while the job market remains fundamentally damaged.
Next week (July 30) will see data on growth in GDP for the second quarter of 2020 released. This data is all but guaranteed to show the largest one-quarter collapse in economic growth in U.S. history. The week after that (on August 7), we will see data on job growth for the month of July. Early indications strongly signal that we lost jobs in July, reversing the last two months’ gains—which were already wholly insufficient to declare the labor market healthy enough to begin ramping down the generosity of UI benefits. The big constraint on economic growth right now is the spread of the coronavirus. If we allow the $600 supplement to lapse, another huge constraint on growth will be imposed—collapsing incomes for the tens of millions of U.S. families that have had to rely on these benefits in recent months.
If the weekly unemployment insurance increase is cut by $400, how many jobs will it cost over the next year?: Jobs cost as a level and as a share of employment
| State | Jobs cost | Jobs cost, as a share of employment |
|---|---|---|
| Alabama | 28,841 | 1.4% |
| Alaska | 8,305 | 2.5% |
| Arizona | 37,044 | 1.2% |
| Arkansas | 19,989 | 1.6% |
| California | 557,428 | 3.2% |
| Colorado | 44,599 | 1.6% |
| Connecticut | 49,793 | 2.9% |
| Delaware | 9,747 | 2.1% |
| Washington D.C. | 13,074 | 1.6% |
| Florida | 163,280 | 1.8% |
| Georgia | 124,403 | 2.7% |
| Hawaii | 21,834 | 3.3% |
| Idaho | 6,699 | 0.9% |
| Illinois | 130,099 | 2.1% |
| Indiana | 39,629 | 1.2% |
| Iowa | 28,387 | 1.8% |
| Kansas | 17,393 | 1.2% |
| Kentucky | 33,168 | 1.7% |
| Louisiana | 54,630 | 2.7% |
| Maine | 12,017 | 1.9% |
| Maryland | 44,991 | 1.6% |
| Massachusetts | 104,775 | 2.8% |
| Michigan | 129,680 | 2.9% |
| Minnesota | 71,756 | 2.4% |
| Mississippi | 28,496 | 2.4% |
| Missouri | 39,607 | 1.4% |
| Montana | 7,867 | 1.6% |
| Nebraska | 10,282 | 1.0% |
| Nevada | 56,111 | 3.9% |
| New Hampshire | 17,961 | 2.6% |
| New Jersey | 98,607 | 2.3% |
| New Mexico | 19,341 | 2.2% |
| New York | 309,312 | 3.1% |
| North Carolina | 94,997 | 2.1% |
| North Dakota | 6,195 | 1.4% |
| Ohio | 86,399 | 1.5% |
| Oklahoma | 30,679 | 1.8% |
| Oregon | 77,066 | 3.9% |
| Pennsylvania | 168,428 | 2.8% |
| Rhode Island | 13,485 | 2.7% |
| South Carolina | 36,322 | 1.6% |
| South Dakota | 3,405 | 0.8% |
| Tennessee | 53,513 | 1.7% |
| Texas | 243,051 | 1.9% |
| Utah | 13,819 | 0.9% |
| Vermont | 7,888 | 2.5% |
| Virginia | 71,033 | 1.7% |
| Washington | 81,483 | 2.3% |
| West Virginia | 15,071 | 2.1% |
| Wisconsin | 43,757 | 1.5% |
| Wyoming | 3,064 | 1.1% |
Notes: We take the relationship between the unemployment rate and the boost to personal income from the extra $600 payment that held in May of 2020 and assume it falls to $200 beginning August. We apply a multiplier of 1.5 to the personal income decline provided by cutting back on the enhanced UI benefit. We then divide this boost by overall GDP, and apply the resulting percentage change to the average level of employment in the first quarter of 2020 to get an implied employment reduction. The numbers in the chart are the average reductions to personal income, GDP, and employment between the third quarter of 2020 and the second quarter of 2021. Some quarters would see even larger effects.
Source: Author’s analysis based on data from the National Income and Product Accounts (NIPA) data from the Bureau of Economic Analysis (BEA), projections from the Congressional Budget Office (CBO), data on continuing unemployment insurance claims from the Department of Labor (DOL), and total nonfarm employment from the Bureau of Labor Statistics (BLS) Current Employment Statistics (CES).
Going from $600 to $200 will significantly damage job growth over the next year: Average reduction in personal income, GDP, and employment over the next year if $600 weekly UI supplement is reduced to $200, August 2020 to July 2021
| Personal income (millions) | GDP | Jobs supported | |
|---|---|---|---|
| U.S., total | $339,080 | 2.5% | 3,388,798 |
| Alabama | $3,266 | 2.1% | 28,841 |
| Alaska | $830 | 2.2% | 8,305 |
| Arizona | $3,746 | 1.5% | 37,044 |
| Arkansas | $2,040 | 2.3% | 19,989 |
| California | $48,639 | 2.3% | 557,428 |
| Colorado | $4,398 | 1.7% | 44,599 |
| Connecticut | $4,687 | 2.5% | 49,793 |
| Delaware | $891 | 1.8% | 9,747 |
| District of Columbia | $1,214 | 1.2% | 13,074 |
| Florida | $18,437 | 2.5% | 163,280 |
| Georgia | $12,822 | 3.1% | 124,403 |
| Hawaii | $2,260 | 3.5% | 21,834 |
| Idaho | $929 | 1.7% | 6,699 |
| Illinois | $12,746 | 2.1% | 130,099 |
| Indiana | $4,219 | 1.7% | 39,629 |
| Iowa | $2,948 | 2.3% | 28,387 |
| Kansas | $1,742 | 1.5% | 17,393 |
| Kentucky | $3,857 | 2.7% | 33,168 |
| Louisiana | $5,437 | 3.1% | 54,630 |
| Maine | $2,030 | 4.5% | 12,017 |
| Maryland | $4,316 | 1.5% | 44,991 |
| Massachusetts | $10,162 | 2.6% | 104,775 |
| Michigan | $15,813 | 4.4% | 129,680 |
| Minnesota | $7,073 | 2.8% | 71,756 |
| Mississippi | $3,007 | 3.8% | 28,496 |
| Missouri | $4,292 | 1.9% | 39,607 |
| Montana | $856 | 2.5% | 7,867 |
| Nebraska | $1,067 | 1.3% | 10,282 |
| Nevada | $5,953 | 5.0% | 56,111 |
| New Hampshire | $1,839 | 3.1% | 17,961 |
| New Jersey | $9,892 | 2.3% | 98,607 |
| New Mexico | $1,821 | 2.6% | 19,341 |
| New York | $30,758 | 2.7% | 309,312 |
| North Carolina | $9,721 | 2.5% | 94,997 |
| North Dakota | $535 | 1.4% | 6,195 |
| Ohio | $10,523 | 2.3% | 86,399 |
| Oklahoma | $2,601 | 1.9% | 30,679 |
| Oregon | $4,809 | 2.9% | 77,066 |
| Pennsylvania | $16,302 | 3.0% | 168,428 |
| Rhode Island | $1,434 | 3.4% | 13,485 |
| South Carolina | $3,990 | 2.4% | 36,322 |
| South Dakota | $379 | 1.1% | 3,405 |
| Tennessee | $5,571 | 2.2% | 53,513 |
| Texas | $22,370 | 1.8% | 243,051 |
| Utah | $1,404 | 1.1% | 13,819 |
| Vermont | $849 | 3.7% | 7,888 |
| Virginia | $6,900 | 1.9% | 71,033 |
| Washington | $11,019 | 2.8% | 81,483 |
| West Virginia | $1,550 | 3.0% | 15,071 |
| Wisconsin | $4,851 | 2.1% | 43,757 |
| Wyoming | $286 | 1.1% | 3,064 |
Note: We take the relationship between the unemployment rate and the boost to personal income from the extra $600 payment that held in May of 2020 and assume it falls to $200 beginning August. We apply a multiplier of 1.5 to the personal income decline provided by cutting back on the enhanced UI benefit. We then divide this boost by overall GDP, and apply the resulting percentage change to the average level of employment in the first quarter of 2020 to get an implied employment reduction. The numbers in the chart are the average reductions to personal income, GDP, and employment between the third quarter of 2020 and the second quarter of 2021. Some quarters would see even larger effects.
Source: Author’s analysis based on data from the National Income and Product Accounts (NIPA) data from the Bureau of Economic Analysis (BEA), projections from the Congressional Budget Office (CBO), and data on continuing unemployment insurance claims from the Department of Labor (DOL).
Enjoyed this post?
Sign up for EPI's newsletter so you never miss our research and insights on ways to make the economy work better for everyone.