As economic forecasts worsen, up to $1 trillion in federal aid to state and local governments could be needed by the end of 2021
Key takeaways:
- Congress should prioritize federal aid to state and local governments in the next relief and recovery legislation.
- New estimates show that the economic shock of the coronavirus could lead to a revenue shortfall of nearly $1 trillion by 2021 for state and local governments.
- Unemployment is forecast to be quite elevated even by the end of 2021, and so federal aid should continue as long as economic conditions warrant and not be set by arbitrary timelines.
As the next round of legislative relief and recovery packages are debated, federal aid to state and local governments has emerged as a high priority. This aid is absolutely crucial for avoiding a deep and prolonged recession.
The revenue shortfall facing state and local governments stemming from the collapse in economic activity—driven by the shock of the coronavirus—could reach nearly $1 trillion by the end of 2021. And even at the end of 2021, recent economic projections indicate that unless more relief and recovery is passed, the unemployment rate could still sit at just under 10%. In short, all facets of relief and recovery—including substantial aid to state and local governments—could well be needed for a long time, and their continuation should be tied explicitly to economic conditions and not to arbitrary timelines.
Tim Bartik at the Upjohn Institute has released updated projections of the revenue shortfall facing state and local governments. His projections are transparent and are largely based on estimated parameters from publicly available academic research. Bartik finds that if the recent projections for the path of the unemployment rate estimated by the Congressional Budget Office (CBO) come to pass, state and local governments will be facing a revenue shortfall of nearly $1 trillion by the end of 2021.*
One trillion dollars by the end of 2021 is a big number, even by the standards of federal budgeting. But it’s not a number plucked from the air—it is well grounded in transparent, high-quality research. And, in fact, it might actually be a bit too conservative in some ways. In what follows, we will quickly describe the reasoning and evidence behind Bartik’s estimate, and note two ways that it is even being slightly conservative.
Bartik’s estimates for the responsiveness of state revenue to higher unemployment are based in part on work by Fiedler, Furman, and Powell. This work finds that every 1-percentage-point increase in unemployment is associated with a 3.7% fall in state revenues. To adjust for potential local revenue shortfalls, he accounts for the fact that local revenues are smaller than state revenues and assumes that they are less sensitive to current economic conditions than state revenues. This assumption is based on the fact that local revenues are dominated by property taxes, and property taxes have traditionally been seen as largely insensitive to the business cycle. All of the parameters and assumptions driving his findings are transparent and well documented.
It’s worth noting a couple of things about these estimates. First, the Fiedler, Furman, and Powell findings are based on data from 1985–2018. But there is evidence that the sensitivity of state revenue to changes in unemployment has increased steadily over time. The figure below shows estimated coefficients from a regression of annual changes in all state and local taxes excluding property taxes on the annual change in unemployment and a time-trend. The measure of state and local taxes minus property taxes is not a terrible estimate of state revenue alone, as property taxes are mostly collected at the local level. The data run from 1959 to 2019. The coefficient on this measure, showing the decline in taxes associated with each 1-percentage-point increase in unemployment is more than twice as high in the last two decades (4.8%) as in the decades before (2%), and since 2000 it is significantly higher than the Fiedler, Furman, and Powell estimate of 3.7% (we should note that when restricting the data to 1985–2018 to mirror the Fiedler, Furman, and Powell estimate, we get a coefficient exactly matching theirs, even with a slightly different data set).
Growing cyclical sensitivity of state and local taxes: Annual decline in state and local taxes excluding property taxes associated with 1 percentage point rise in unemployment, pre- and post 2000
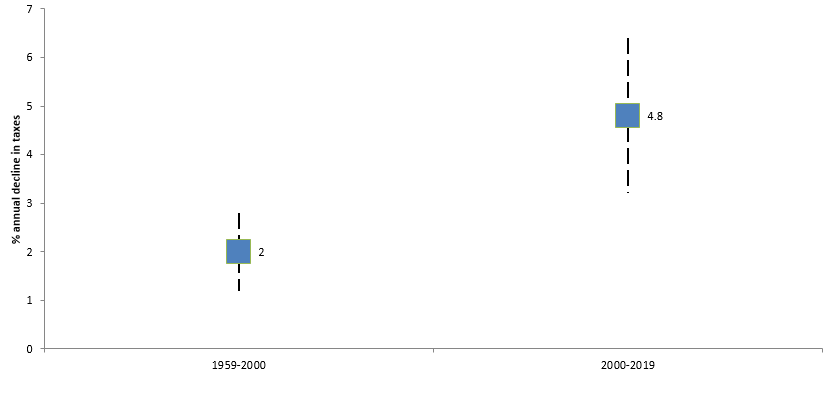
Note: The annual change in state and local taxes excluding property taxes is regressed on the annual change in the unemployment rate and a time trend. The earlier time-period includes the years from 1959 to 2000, while the later time period includes all years 2000 and after. The lines above and below the estimate represent 95% confidence intervals.
Source: EPI analysis of Bureau of Economic Analysis National Income and Product Accounts (NIPA) Table 3.3, and BLS Labor Force Statistics from the Current Population Survey.
Second, the common claim that property taxes are largely invariant to the business cycle also seems to change once one focuses on more recent data and allows for lagged effects. Property taxes change more slowly as the economy weakens than other taxes, such as sales or income taxes. Property taxes rely in part on assessments of value that are sometimes adjusted only in multi-year increments. Given this, it can take a while for a weaker economy to translate into lower property tax collections. The figure below shows the coefficient for a regression showing the annual change in property tax revenues associated with a 1-percentage-point change in unemployment lagged two years. Before 2000, this coefficient was effectively zero, validating the presumption that property taxes were largely insensitive to the business cycle. But since 2000, this coefficient has become statistically significant and economically meaningful, with property taxes falling as unemployment rises. The post-2000 estimates would, for example, indicate that the average 9.5 percentage points of excess unemployment between the second quarter of 2020 and the first quarter of 2021 would by itself translate into a roughly $60 billion decline in property tax revenues alone within a few years, once lagged effects kick in.
Growing cyclical sensitivity of property tax revenues: Annual decline in property tax revenues associated with lagged 1 percentage point increase in unemployment, pre and post-2000
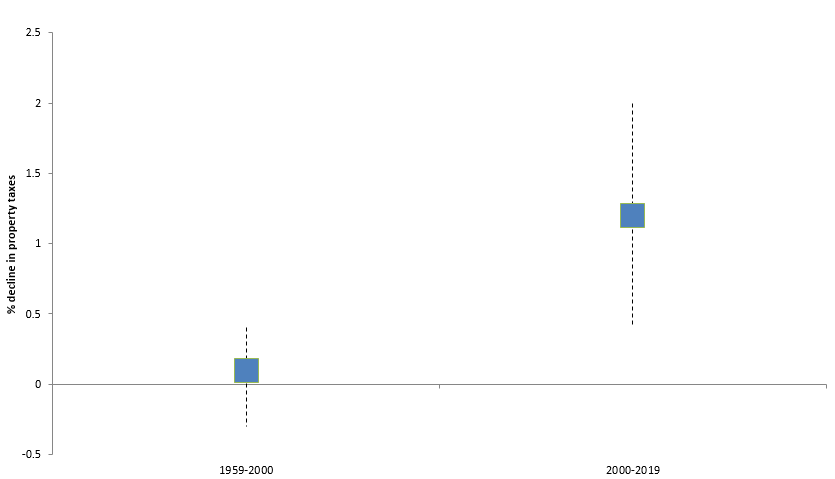
Note: The annual change in state and local taxes property taxes is regressed on the annual change in the unemployment rate lagged two years and a time trend. The earlier time-period includes the years from 1959 to 2000, while the later time period includes all years 2000 and after. The lines above and below the estimate represent 95% confidence intervals.
Source: EPI analysis of Bureau of Economic Analysis National Income and Product Accounts (NIPA) Table 3.3, and BLS Labor Force Statistics from the Current Population Survey.
Given these considerations, the finding that state and local governments may face a revenue shortfall of up to $1 trillion by the end of 2021 seems entirely plausible, and federal aid should be on this scale in order to avoid forced cutbacks in state and local government spending from becoming a large drag on economic recovery. Further, unemployment is forecast to be quite elevated even by the end of 2021, and so federal aid should continue as long as economic conditions warrant, and not be set by arbitrary timelines.
* In an earlier post, we found that rising unemployment and reduced economic activity could depress state and local revenues by $500 billion or more by the end of 2021. We now think the number is even higher than this for a few reasons. First, our first estimate was based on a forecast for unemployment (from Goldman Sachs) that was more optimistic than that projected by the more recent CBO estimate. Just the longer and larger rise in unemployment forecast by CBO would push up our estimates. Second, in the earlier post, we used a slightly smaller number for how responsive local government revenue might be to rising unemployment than that used by Bartik. But our findings on the growing sensitivity of property tax revenue to rising unemployment over time highlighted above makes us think his estimate makes more sense. Finally, we based our estimates on the assumption that only state and local revenue shortfalls associated with unemployment rates above 6% would trigger federal aid. But there’s no reason in the current moment to ration federal assistance. The fiscal stress of state and local governments today and for the next two years is entirely the fault of the coronavirus—as a group, these governments were in strong fiscal shape before this shock. Given the huge capacity of the federal government right now to take on debt (as evidenced by historically low interest rates), there is really no reason to not hold state and local governments fully harmless against the fiscal shock of the coronavirus, and this shock can be measured as simply the entire increase in unemployment since the first quarter of this year.
Enjoyed this post?
Sign up for EPI's newsletter so you never miss our research and insights on ways to make the economy work better for everyone.