Prepared testimony by Dave Cooper, Economic Analyst of EARN, to the Maryland Senate Finance Committee
To: Maryland Senate Finance Committee
From: Dave Cooper, Economic Analyst of EARN
Date: Monday, February 17, 2014
Re: In support of HB 331 – The Maryland Minimum Wage Act of 2014
Thank you for holding this hearing on raising the state minimum wage and allowing me to speak with you today. I want to briefly provide some context for a minimum wage of $10.10, discuss what the economics literature tells us about how this might affect the state economy, and describe the population likely to be affected. I also want to note the importance of indexing the minimum wage for inflation and raising the minimum wage for tipped workers.
Putting an $10.10 minimum wage in context
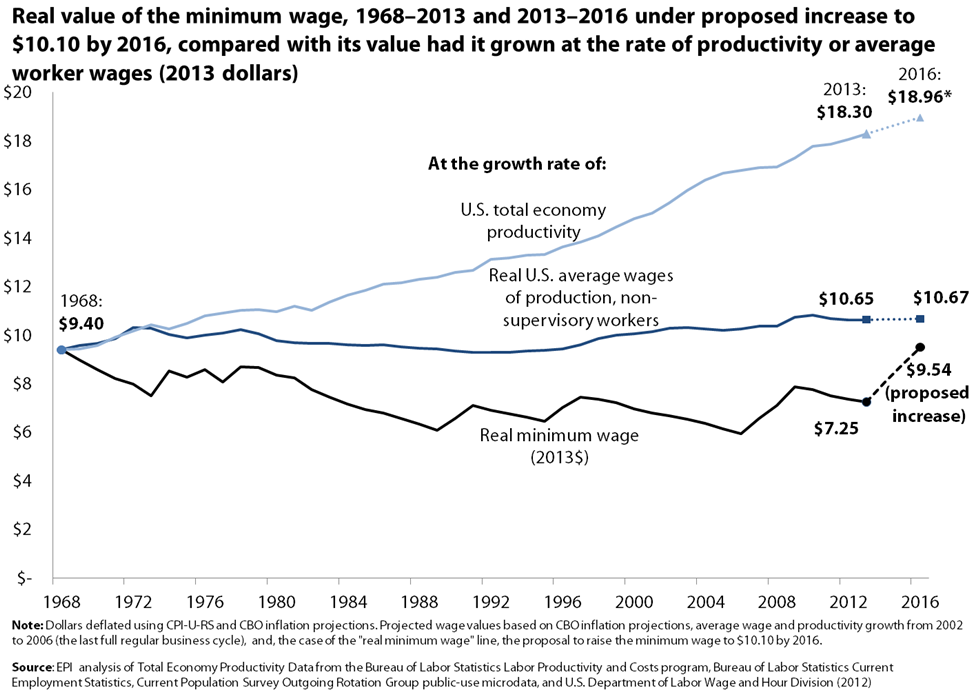
The first thing to remember in considering an $10.10 minimum wage is that over the 3-year phase-in period as the minimum is raised, inflation will be eating away at the new minimum’s real value. Based upon the Congressional Budget Office’s projections for inflation over the next 3 years, a minimum wage of $10.10 in 2016 would equal roughly $9.54 in today’s dollars. This would be slightly higher than the value of the federal minimum wage at its high point in 1968, when it equaled roughly $9.40 in today’s dollars.
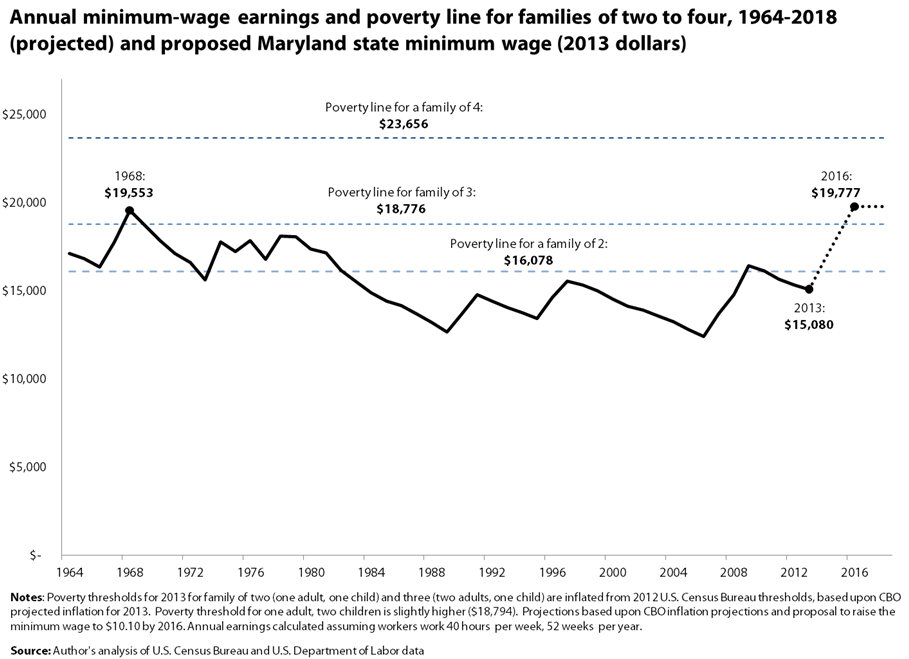
The figure shows the annual income for minimum wage workers at every value of the federal minimum wage since 1964, adjusted for inflation into constant 2013 dollars. It also depicts the projected value of a minimum wage income under the proposal to raise the state minimum wage to $10.10 by 2016. As shown by the dotted line, the proposal would elevate a minimum wage income above the federal poverty line for a family of three. Federal tax credits available to low-income families would bring their total family income above the poverty line for a family of four.[i]
It’s also important to note that over the past 40 years, Maryland’s workers have become far more productive, yet their pay has not kept pace with their ability to generate more from an hour’s worth of work. From 1979 through 2012, output per worker expanded 74 percent for workers in Maryland, yet median real compensation grew only 18 percent. For low-wage workers, it was even worse: from 1979 to 2013 workers in the bottom fifth of the wage distribution in Maryland saw their wages increase by only 2.8 percent.
Figure 2 shows the real (i.e., inflation-adjusted) value of the minimum wage at its high point in 1968, and what the minimum wage would be today if it had grown since then at the same rate as average wages for production, non-supervisory workers or overall U.S. productivity.[ii]
If the minimum wage had grown at the same rate as growth in wages for the average American worker, it would be $10.65 today and about $10.89 by 2016. If the minimum wage had grown with productivity since the late 1960s, it would have been $18.30 in 2013, and just under $19 per hour by 2016 under reasonable expectations for productivity growth. This means that our economy has the capacity for a minimum wage far higher than $10.10; we have simply chosen to let its real value erode and not given the lowest paid workers any of the benefits of improvements in our ability to generate income.
What does the economics literature say about increasing the minimum wage? Does increasing the minimum wage lead to job losses?
There is a vast literature on the effects of the minimum wage that spans decades and has gone through countless methodological improvements. The early studies in the 1960s and 70s seemed to confirm the rudimentary supply-and-demand model of competitive labor markets that we all learned in Econ 101, which predicts that an increase in the minimum wage above a “market-clearing rate” will lead to a loss of employment. Up until the early 1990s, there was a consensus in the economics profession that increases in the minimum wage caused job loss.
But that consensus began to crack with a new round of research in the 1990s, with many new rigorous studies showing no employment losses and in some cases employment gains due to increases in the minimum wage.[iii] At the same time, other studies that still found negative employment effects were finding them to be much smaller than was previously thought. By the mid-2000s, the profession was at a place of no consensus on whether the effect of increases in the minimum wage on employment was positive or negative. However, there was a growing consensus that the effect, whether positive or negative, was small.
In the last few years, another round of research on the minimum wage—representing the best methodological practices we have—has been peer reviewed and published in top academic journals. These studies find that there has been essentially no effect of increases in the minimum wage on employment, neither positive nor negative.
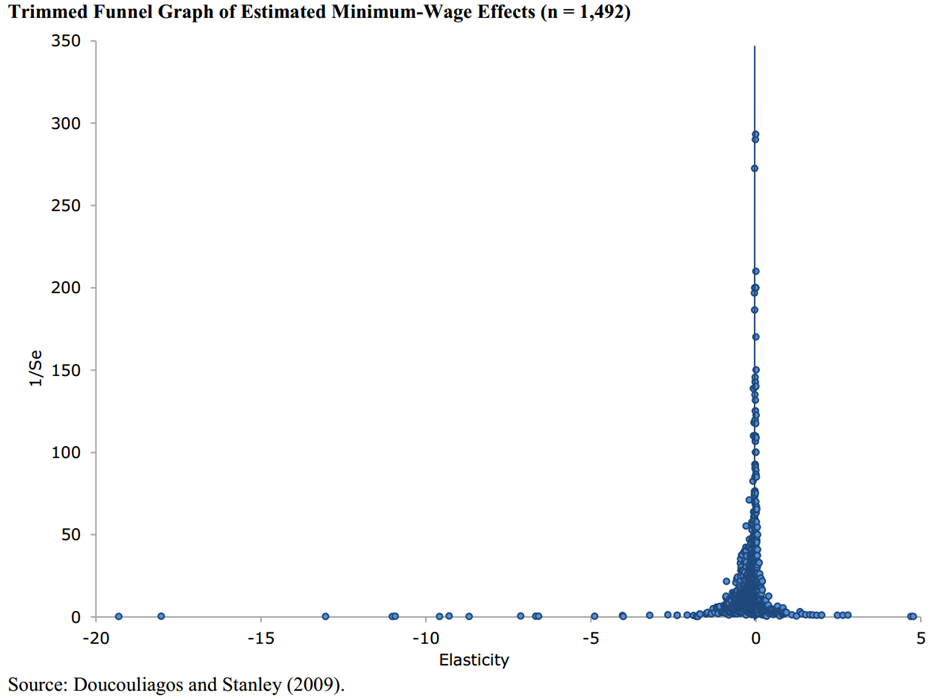
The figure below shows the results of a “meta-study,” a study of studies, of 64 studies on the minimum wage between 1972 and 2007. The X-axis shows the effect on employment resulting from a minimum wage increase; the Y-axis shows the statistical rigor of the study. As you can see, the results of the vast majority of studies cluster around zero, and those studies with the highest statistical power—i.e., the most rigorous studies—all fall on the zero line.[iv]
There have been other highly rigorous studies published since 2007 confirming this finding—including one that examined what happened at the county level after every single minimum wage increase in the United States from 1990 to 2006 concluding that there were “strong earnings effects and no employment effects from a minimum wage increase.”
This was the conclusion of more than 600 Ph.D. economists, including seven Nobel Prize winners, who sent a letter to Congress last month encouraging them to raise the federal minimum wage to $10.10.[v] The letter states “In recent years there have been important developments in the academic literature on the effect of increases in the minimum wage on employment, with the weight of evidence now showing that increases in the minimum wage have had little or no negative effect on the employment of minimum-wage workers, even during times of weakness in the labor market.”
How will raising the minimum wage affect the state economy?
As I mentioned before, increases in the minimum wage have been shown to result in significant increases in earnings for households with low-wage workers. This is a critical point because it describes how raising the minimum wage can have positive effects on the larger economy. The minimum wage goes primarily to workers in low- and moderate-income families who depend on their earnings to get by. These are the families with little choice but to spend every additional dollar they earn. Economists would say that they have a high “propensity to consume out of income”. Thus when you raise the minimum wage, you put more money in the hands of people likely to spend it right away – this provides a boost to the economy.
But what about the flip side, the fact that that money is coming from employers? Wouldn’t the employers have spent it if they hadn’t had to pay increased wages — in other words, wouldn’t it have gone into the economy anyway? The answer is yes, but not nearly as much, and that is the crucial point. Minimum wage workers are more likely to immediately spend that money on goods and services in the economy—particularly in the local economy—than business owners are. Increasing the minimum wage means you’re shifting money from someone who’s much less likely to otherwise spend all of it to one that is – the low-wage worker.
At the same time, it is not entirely clear that businesses would lose all that income. For example, we know that businesses see some offsetting gains when the minimum wage is raised, particularly from reductions in turnover costs, and improvements in organizational efficiency. Some may also choose to enact small price increases.
We estimate that increasing the state minimum wage to $10.10 per hour would shift about $721 million to low-wage workers in Maryland. These higher earnings—after accounting for the change in labor costs for businesses and the possibility of small price increases for consumers—translate into a net increase of $456 million in increased economic activity for the state. This is enough additional output to support 1,600 new jobs.
I should note that this finding is consistent with research done by the Chicago Federal Reserve.[vi] Earlier this year, economists at the Federal Reserve Bank of Chicago concluded that raising the federal minimum wage to $9 would boost US GDP by $48 billion in the near term. The effect of a Maryland minimum wage increase would, of course, be considerably smaller, but the underlying conclusion is still the same. In the near term, raising the minimum wage would boost consumer spending sufficiently to have a net positive effect on overall economic growth.
Who would be affected by raising the state minimum wage to $10.10 per hour?
Raising the Maryland minimum wage to $10.10 per hour in three steps by July 2016 would give a raise to 455,000 workers in the state. This includes roughly 304,000 workers currently earning wages below $10.10, as well as 151,000 workers earning just above $10.10, who are also likely to receive a raise as employers adjust overall wage ladders.
Contrary to common stereotypes of low-wage workers, the vast majority are not teenagers. Of the 455,000 workers that would be affected by this bill, only 13.3 percent are teens – meaning that nearly 87 percent are age 20 or older. The average age of affected workers is 33 years old.
Furthermore, these workers tend to have greater education levels, work longer hours, and carry greater family responsibilities than often thought. Of the workers that would be affected by this bill, roughly half (48.6 percent) have some college experience; more than half (56.0 percent) work full time; and nearly a quarter (23.2 percent) have children. There are roughly 210,000 Maryland children with at least one parent that would be affected by this increase.
These workers tend to come from families with low to moderate total family incomes. About 55 percent of the affected workers have total family incomes less than $60,000, and on average, these workers earn about 40 percent of their family’s total income.
The importance of indexing
As I mentioned at the beginning of my testimony, every year that the minimum wage remains the same in nominal terms, inflation eats away at that wage’s purchasing power. Minimum wage workers have to either cut back on their spending or find ways to supplement their income simply to afford the same level of spending they had the previous year. This threatens the well-being of minimum wage workers, it weakens the consumer demand that drives U.S. GDP, and it strains public budgets as more and more low-wage workers have to turn to public assistance programs in order to supplement their inadequate wages. Indexing prevents this from happening by ensuring that a minimum wage paycheck maintains a constant purchasing power.
Moreover, indexing the minimum wage can actually provide greater stability for low-wage employers who can then anticipate their increased year-over-year wage costs and plan to accommodate a small increase, rather than having to question when a larger minimum wage hike might occur because lawmakers recognize that the minimum has stagnated for too long.
There are currently 11 states that have some form of minimum wage indexing.[vii]
The tipped minimum wage
Finally, I want to note the importance of raising the tipped minimum wage. Tipped workers in Maryland earn a base wage of only $3.63 per hour. While higher than the federal tipped minimum wage of $2.13 per hour, this low base wage creates considerable hardship for tipped workers.
Under the current system, if a tipped worker’s tips for the week plus their base wage of $3.63 per hour do not add up to a weekly hourly average wage of $7.25 per hour, the employer is required to pay the difference. However, this is notoriously difficult to enforce. In the current system, a waitress (and roughly 75 percent of all tipped workers are women) must accurately keep track of her tips and hours every week, calculate her resulting wage, and if it does not equal at least $3.63 per hour, she must go to her employer—the person who decides what shifts she will receive, what sections of the restaurant she will work in, and, most importantly, if she’ll remain employed—and ask for additional pay. Given the inherent imbalance of power between the employer and the employee, this system is ripe for abuse. Indeed, between 2010 and 2012, the Wage and Hour Division of the Department of Labor conducted nearly 9,000 investigations throughout the country in the full service sector of the restaurant industry. Among the restaurants they investigated, there was a violation rate of 83.8 percent. Now, these were not all violations of the tipped provision, nor are these findings necessarily representative of the industry at large, but they do underscore the enforcement problem.
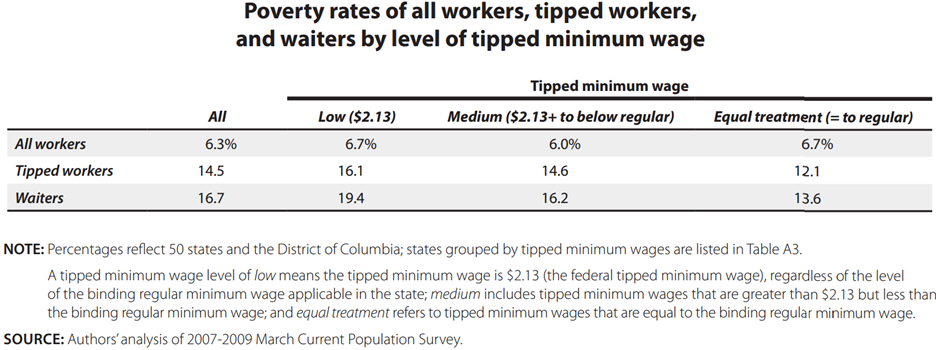
We can also observe the differences in economic outcomes this system creates. A 2011 EPI and UC-Berkeley study showed that poverty rates among tipped workers nationwide are dramatically higher than overall poverty rates of workers – 14.5 percent for tipped workers versus 6.3 percent for workers overall (shown in the figure below).[viii] However, in the seven states with where tipped workers are paid the full minimum wage, the disparity in poverty rates between tipped and non-tipped workers was significantly smaller.[ix] In these states, the poverty rate of tipped workers was 12.1 percent, compared to an overall poverty rate of 6.7 percent. In the 18 states with the lowest tipped minimum wage of $2.13, the overall poverty rate of workers was also 6.7 percent, but for tipped workers, it was 16.1 percent.
This correlation between lower tipped minimum wages and higher poverty rates among tipped workers suggests that having significantly different wage floors for tipped versus non-tipped employees results in considerably different living standards for these two groups. Forcing service workers to rely solely on tips for their wages creates tremendous instability in income flows, making it more difficult to budget or absorb financial shocks.
For these reasons we ask the Committee give a FAVORABLE report to Senate Bill 331.
For additional information please contact David Cooper at 202-533-2566 or dcooper@epi.org.
Endnotes
[i] Furman, Jason. Briefing on the Minimum Wage. [presentation] Presented January 14, 2014 at the Economic Policy Institute. Washington, DC. Video: http://www.epi.org/event/path-raising-federal-minimum-wage-10-10/
[ii] Production, non-supervisory workers comprise about 80 percent of all U.S. workers.
[iii] See Card, David and Alan Krueger. 1994. “Minimum Wages and Employment: A Case Study of the Fast-Food Industry in New Jersey and Pennsylvania.”The American Economic Review. http://davidcard.berkeley.edu/papers/njmin-aer.pdf
[iv] For an excellent summary of the minimum wage literature, see Schmitt, John. 2013. “Why Does the Minimum Wage Have No Discernible Effect on Employment?” Center for Economic and Policy Research. http://www.cepr.net/index.php/publications/reports/why-does-the-minimum-wage-have-no-discernible-effect-on-employment
[v] Letter to President Obama, Speaker Boehner, Majority Leader Reid, Congressman Cantor, Senator McConnell, and Congresswoman Pelosi. January 14, 2014. http://www.epi.org/minimum-wage-statement/
[vi] Aaronson, Daniel and Eric French. 2013. “How does a federal minimum wage hike affect aggregate household spending?” Federal Reserve Bank of Chicago. http://www.chicagofed.org/digital_assets/publications/chicago_fed_letter/2013/cflaugust2013_313.pdf
[vii] The 11 states with indexing are: Arizona, Colorado, Florida, Missouri, Montana, Nevada, New Jersey, Ohio, Oregon, Vermont, and Washington.
[viii] Allegretto, Sylvia and Kai Fillion. “Waiting for Change: The $2.13 Subminimum Wage”. Economic Policy Institute, 2011.
[ix] The seven states with no tipped minimum wage are: Alaska, California, Minnesota, Montana, Nevada, Oregon, and Washington.


