Infographic: How do we know teacher pay is a factor in the teacher shortages?
This report is the third in a series examining the magnitude of the teacher shortage and the working conditions and other factors that contribute to the shortage.
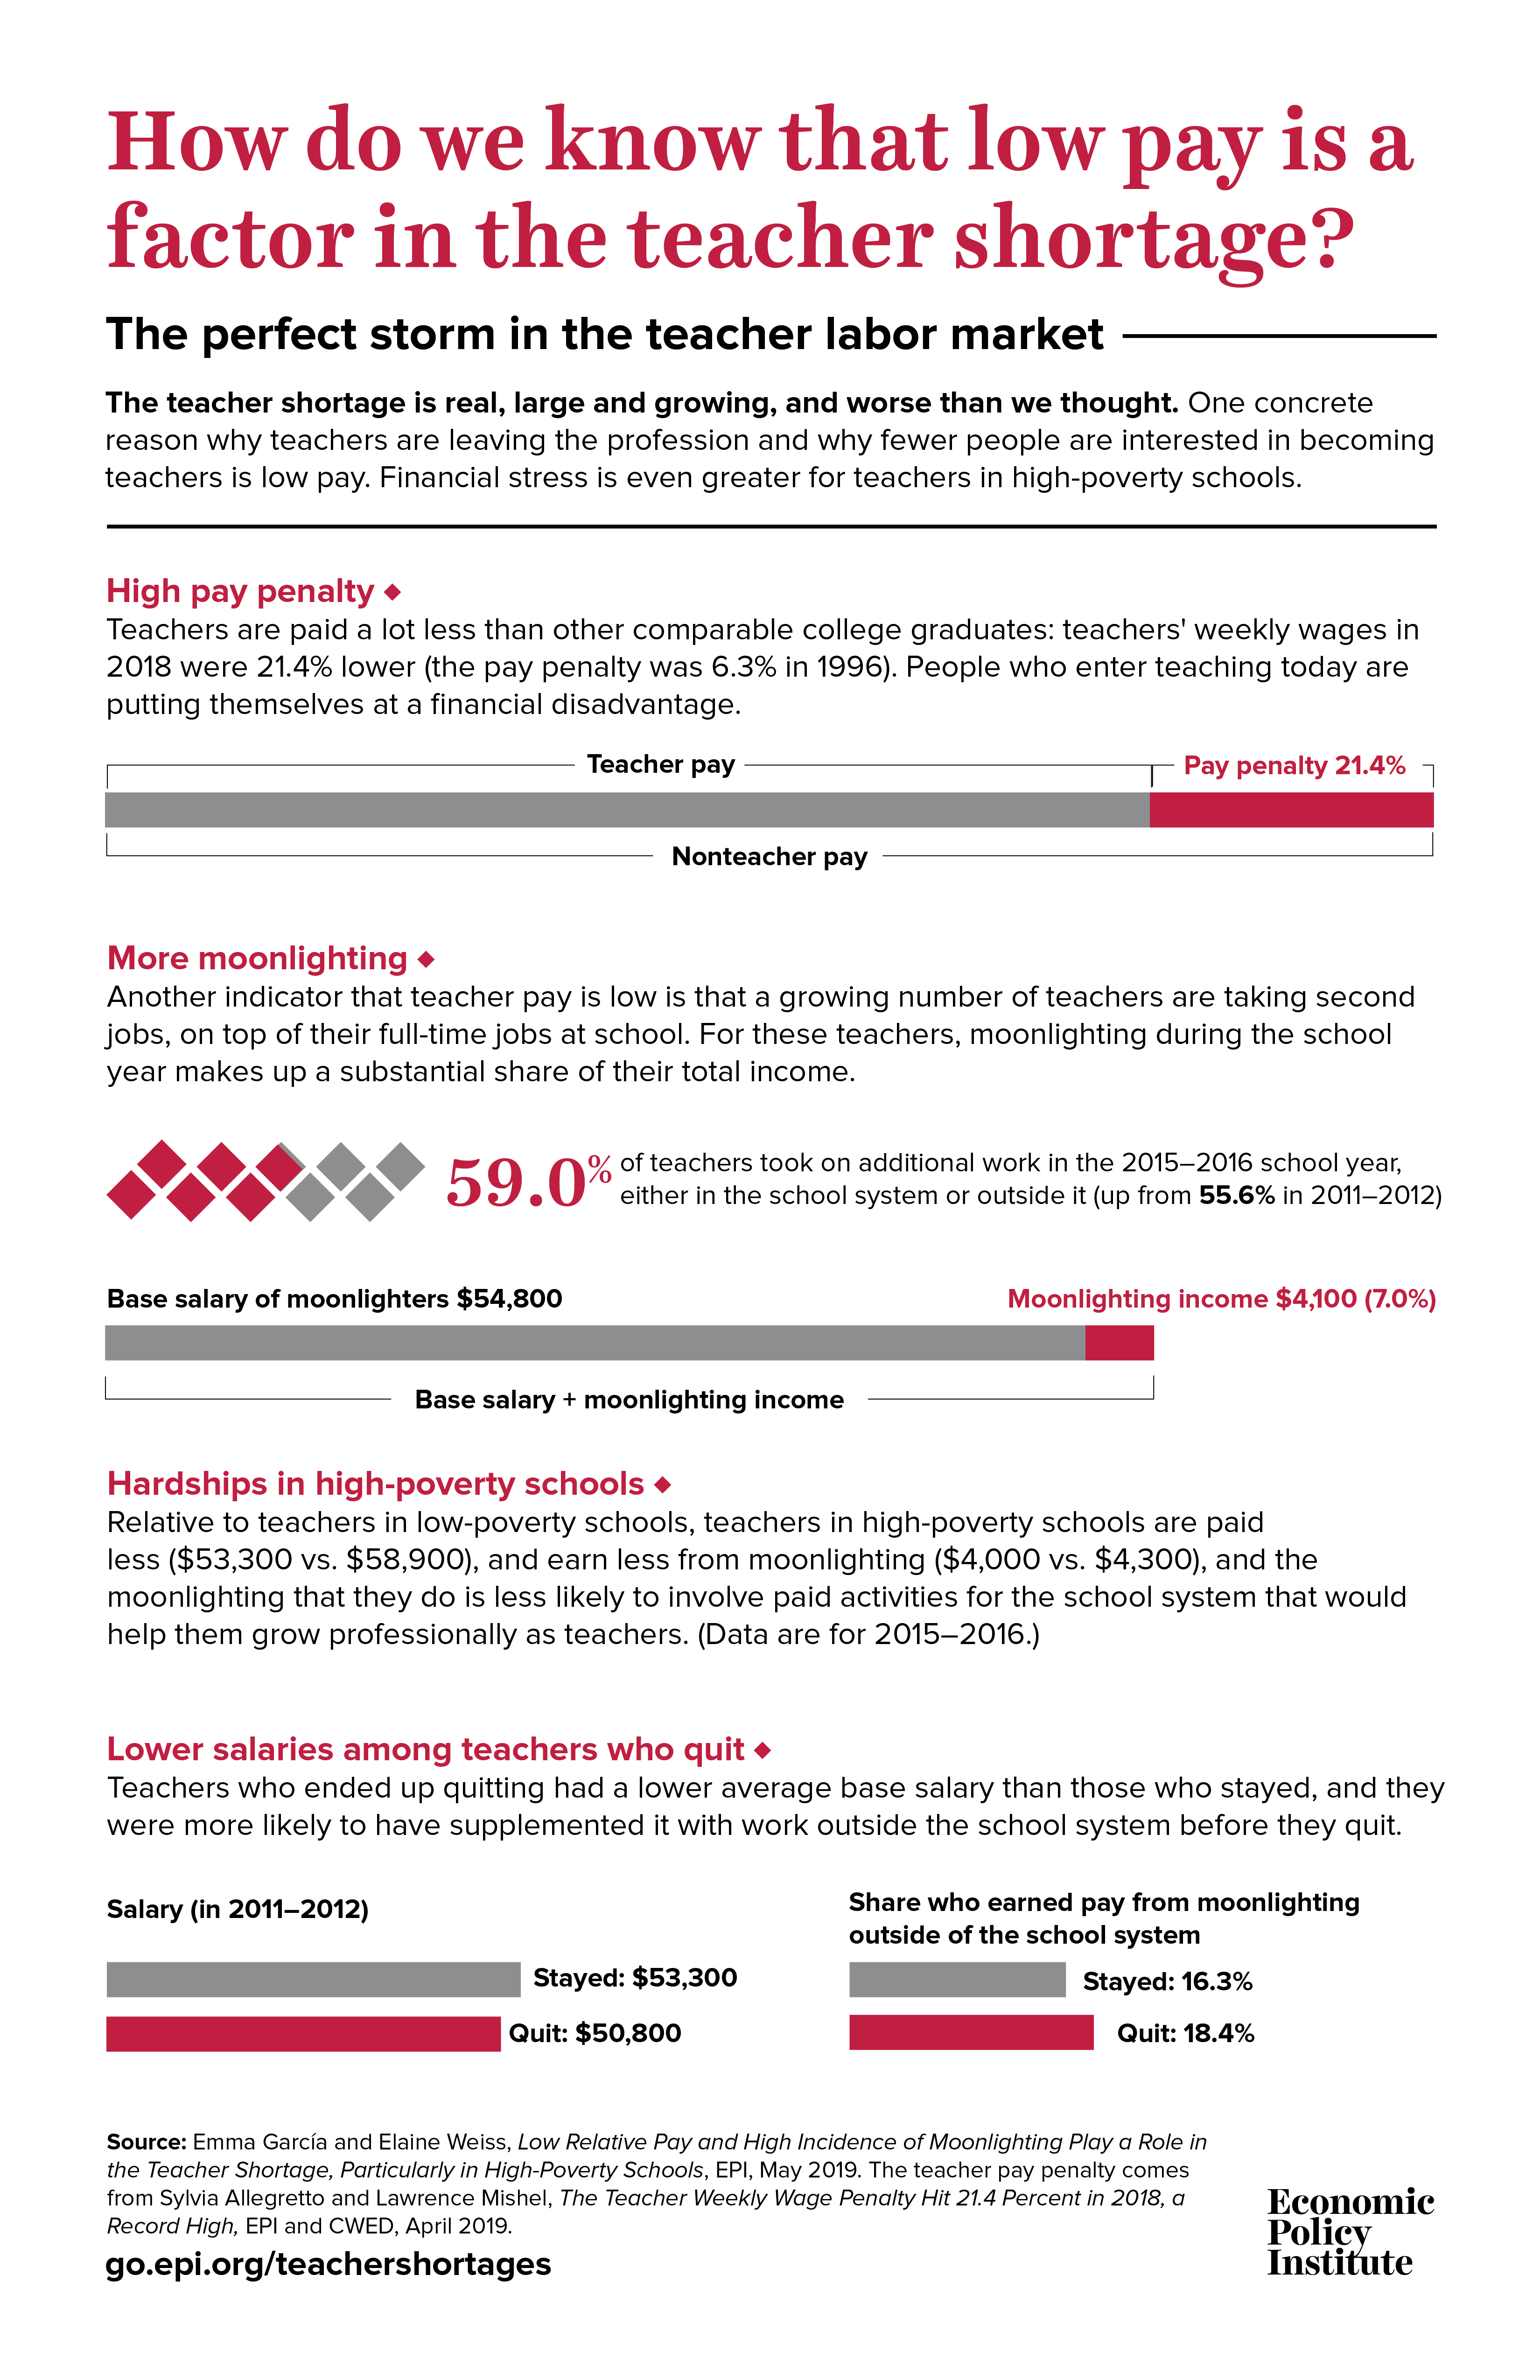
What this series finds: The teacher shortage is real, large and growing, and worse than we thought. When indicators of teacher quality (certification, relevant training, experience, etc.) are taken into account, the shortage is even more acute than currently estimated, with high-poverty schools suffering the most from the shortage of credentialed teachers.
What this report finds: The perceived financial hardships in teaching are real. This report adds to the compelling evidence in Sylvia Allegretto and Larry Mishel’s recent research showing that teachers are paid a lot less than other comparable college graduates. After accounting for education, experience, and other factors known to affect earnings, teachers’ weekly wages in 2018 were 21.4 percent lower than their nonteaching peers. In 1996 that weekly wage penalty was 6.3 percent. Our report identifies other indicators that teacher pay is too low and declining. For example, in the 2015–2016 school year, 59.0 percent of teachers took on additional paid work either in the school system or outside of it—up from 55.6 percent in the 2011–2012 school year. A majority of moonlighters (44.1 percent) were taking on second jobs within the school system, such as coaching, student activity sponsorship, mentoring other teachers, or teaching evening classes; 18.2 percent were working outside of the school system; and 5.7 percent were receiving compensation based on student performance. For these teachers, moonlighting makes up a substantial 7.0 percent share of their combined base salary and extra income. Financial stress is greater for teachers in high-poverty schools. Relative to teachers in low-poverty schools, teachers in high-poverty schools are paid less ($53,300 vs. $58,900), receive a smaller amount from moonlighting ($4,000 vs. $4,300), and the moonlighting that they do is less likely to involve paid extracurricular or additional activities for the school system that generate extra pay but also help them grow professionally as teachers (data are for 2015–2016). Data suggest a relationship between low salaries and quitting. Teachers who ended up quitting before the 2012–2013 school year had lower base salaries ($50,800 vs. $53,300) and were more likely to be supplementing their base pay with work outside the school system in the year before they quit (18.4 percent vs. 16.3 percent).
Why it matters: The data show that fewer people are willing to make the choice to be in a profession that puts them at a financial disadvantage. And not only is pay unattractive, as the next two reports in this series will show, but also teachers aren’t being provided with the working conditions and professional development opportunities that would help them do their jobs and also build their careers. The existing shortage of teachers harms students, teachers, and the public education system as a whole. In addition, the fact that the shortage—and the factors that drive it—is more acute in high-poverty schools challenges the U.S. education system’s goal of providing a sound education equitably to all children.
What we can do about it: Tackle the pay and other factors that are prompting teachers to quit and dissuading people from entering the teaching profession. In addition to policy interventions and institutional decisions to invest more in teacher pay and to widen teachers’ access to paid profession-building activities, we must provide extra supports and funding to high-poverty schools and their teachers, not only to support students directly, but also to reduce teacher shortages.
Update, October 2019: The National Center for Education Statistics (NCES) has announced that weights developed for the teacher data in the 2015–2016 National Teacher and Principal Survey (NTPS) were improperly inflated and that new weights will be released (release date to be determined). According to the NCES, counts produced using the original weights would be overestimates. The application of the final weights, when they are available, is not likely to change the estimates of percentages and averages (such as those we report in our analyses) in a statistically significant way. EPI will update the analyses in the series once the new weights are published but does not expect any data revisions to change the key themes described in the series. Please note that EPI analyses produced with 2011–2012 Schools and Staffing Survey (SASS) data, 2012–2013 Teacher Follow-Up Survey (TFS) data, and 2015–2016 NTPS school-level data are unaffected by NCES’s reexamination.
Introduction
The teacher shortage in the nation’s K–12 schools is an increasingly recognized but still poorly understood crisis: The shortage is discussed by the media and policymakers, and researchers have estimated its size (about 110,000 teachers in the 2017–2018 school year, up from no shortage before 2013, according to Sutcher, Darling-Hammond, and Carver-Thomas 2016), and even quantified part of its cost.1 The shortage constitutes a crisis because of its negative effects on students, teachers, and the education system at large. But it is poorly understood because the reasons for it are complex and interdependent. The first report in this series, The Teacher Shortage Is Real, Large and Growing, and Worse Than We Thought (García and Weiss 2019a), established that current national estimates of the teacher shortage likely understate the magnitude of the problem: When issues such as teacher qualifications and the unequal distribution of highly credentialed teachers across high- and low-poverty schools are taken into consideration, the teacher shortage problem is much more severe than previously identified.
Building on that research, and using the same quality and equity angles, the second report in this series, U.S. Schools Struggle to Hire and Retain Teachers (García and Weiss 2019b), showed that schools are having difficulties in staffing their schools and are leaving vacancies unfilled despite actively trying to hire for them. High-poverty schools are hit hardest: They find it more difficult to fill vacancies than low-poverty schools and schools overall, and they experience higher turnover and attrition than low-poverty schools. One factor behind staffing difficulties is the high share of public school teachers leaving their posts: 13.8 percent are either leaving their school or leaving teaching altogether, according to most recent data. Another factor is the dwindling pool of applicants to fill vacancies. From the 2008–2009 to 2015–2016 school years, there was a 15.4 percent drop in the number of education degrees awarded and a 27.4 percent drop in the number of people who completed a teacher preparation program. Schools are also having a harder time retaining credentialed teachers: this can be seen in the small but growing share of all teachers who are newly hired and in their first year of teaching (4.7 percent) and in the substantial shares of teachers who quit who are certified and experienced. This challenge is also more acute for high-poverty schools.
This third report in the series focuses on a likely factor behind why teachers are leaving the profession and fewer people are becoming teachers: teacher pay. Specifically it looks at how teacher compensation compares with compensation in nonteaching occupations. It also delves into an aspect that has received increasing attention recently, which is whether teachers work multiple jobs, and what share of teachers supplement their earnings by moonlighting. When we look at what quitting teachers were doing the year before they quit, we find that their pay and moonlighting activities are different than for teachers who remain in teaching. Teachers who end up quitting their jobs received, on average, lower salaries, they participated less in the kinds of paid extracurricular activities that complement their professional development (activities like coaching students or mentoring teachers), and they participated more in working options outside the school system than did teachers who stayed at their schools. In high-poverty schools, teachers face compounded challenges. Relative to teachers in low-poverty schools, teachers in high-poverty schools are paid less, receive a smaller amount from moonlighting, and the moonlighting that they do is less likely to involve paid extracurricular or additional activities for the school system that generate extra pay but also help them grow professionally as teachers.
We discuss the likely influence of the large and rapidly growing “teacher pay gap”—how much less teachers earn than their comparably educated peers in other professions—on the weakening attractiveness of public education as a profession, and on the rising rate of teacher attrition. These findings suggest that efforts to address teacher shortages must consider attending to the deterioration in pay and working conditions for teachers, especially in high-poverty schools.
Low wages and other compensation
Teaching has never been a particularly high-paying profession, but in recent decades, teachers have lost ground to their peers in other professions, even other public-sector professionals who are also paid less than private-sector equivalents. Historically, teaching and nursing were the two main professional occupations open to women. Low pay was thus in part a consequence of occupational segregation by gender. This occupational segregation continued even as women began to enter other fields in large numbers: Teaching remained a female-dominated profession and teachers’ pay fell further behind pay in other, more gender-balanced, professions.2 However, low pay can also be a cause of gender segregation, and this explanation for low pay begs the question of why teaching remained a “pink collar” job.
Public school teachers represent about 87 percent of all K–12 teachers in the United States (NCES 2018a). Because public school teachers are paid by governments, their pay is only indirectly affected by market forces. School districts that pay below-market wages may be understaffed and underperform, but they will continue to operate nonetheless. Of course, teacher pay is not set in a societal vacuum, and school districts do take into account teachers’ other public- and private-sector job opportunities.3 As a result, experienced teachers may not immediately leave in response to worsening pay and working conditions, even if they feel undervalued and unmotivated. Declining relative pay and prestige and other factors may thus not have an immediate effect on staffing. However, increased turnover and vacancies (and less visible declines in credentials held by the teaching workforce) will appear with a lag as some teachers become so dissatisfied that they leave, and as more young people are dissuaded from obtaining teaching degrees and entering the profession.4
Whatever the exact causes, the teacher wage penalty—how much less teachers earn in weekly wages than similar college graduates (i.e., after accounting for education, experience, and other factors known to affect earnings)—has grown over time, as shown in Figure A. The figure, reprinted from a major EPI study of this problem (Allegretto and Mishel 2019), shows that the average weekly pay penalty hit a maximum of 21.4 percent in 2018, a sharp increase from just a quarter-century ago (1996), when it was just 6.3 percent. Even when teacher benefits—including pensions, which have been used to compensate, in part, for educators’ relatively low salaries—are taken into account, the total compensation penalty was 13.1 percent in 2018, up from 9.8 percent in 2004 and from 2.9 in 1993.5 Note that the compensation penalty would be even larger than measured by Allegretto and Mishel if it weren’t for health and pension benefits becoming more costly to employers without becoming more generous in practice for teachers, due to the rising relative cost of health insurance.6
Teachers earn a record 21.4 percent less in wages than comparable workers: Teacher wage gap—public school teacher wages relative to comparable workers, 1996–2018
| Year | Wage gap |
|---|---|
| 1996 | -6.3% |
| 1997 | -7.1% |
| 1998 | -9.8% |
| 1999 | -11.6% |
| 2000 | -11.6% |
| 2001 | -13.0% |
| 2002 | -13.0% |
| 2003 | -12.4% |
| 2004 | -12.0% |
| 2005 | -13.7% |
| 2006 | -15.1% |
| 2007 | -13.0% |
| 2008 | -14.6% |
| 2009 | -13.7% |
| 2010 | -13.5% |
| 2011 | -14.3% |
| 2012 | -15.5% |
| 2013 | -16.7% |
| 2014 | -17.1% |
| 2015 | -19.0% |
| 2016 | -20.2% |
| 2017 | -20.7% |
| 2018 | -21.4% |
Note: The figure shows regression-adjusted weekly wage penalties for public school teachers (elementary, middle, and secondary) relative to other college graduates.
The figure shows regression-adjusted weekly wage penalties for public school teachers (elementary, middle, and secondary) relative to other college graduates. The dependent variable is (log) weekly wages with indicator controls on public school teacher, private school teacher, gender, and married, along with indicator sets on education (M.A., professional degree, Ph.D.) and race/ethnicity (black, Hispanic, other); also included are age (as a quartic) and state fixed effects. Estimates are omitted for 1994 and 1995, as imputation flags are incomplete or not available; data points for these years are represented by dotted lines. See Appendix A in Allegretto and Mishel 2019 for more details.
Source: Adapted from Sylvia Allegretto and Lawrence Mishel, The Teacher Weekly Wage Penalty Hit 21.4 Percent in 2018, a Record High, Economic Policy Institute and the Center on Wage and Employment Dynamics at the University of California, Berkeley, April 2019
The teacher pay penalty is even stiffer for teachers in high-poverty schools. A teacher is in a low-poverty school if less than 25 percent of the student body in his/her classroom is eligible for free or reduced-price lunch programs; a teacher is in a high-poverty school if 50 percent or more of the student body is his/her classroom is eligible for those programs. As shown in Figure B, the base salary in high-poverty schools is substantially lower than in low-poverty schools, with the gap of about $5,600 representing 9.5 percent of the 2015–2016 base salary of teachers in low-poverty schools. In other words, on average, teachers in high-poverty schools make about 10 percent less than teachers in low-poverty schools.
Base salaries for teachers in high- and low-poverty schools and gap between these salaries
| School type | Base salary |
|---|---|
| Low-poverty | $58,900 |
| High-poverty | $53,300 |
Note: Data are for teachers in public noncharter schools. Salaries are rounded to the closest hundred dollars. A teacher is in a low-poverty school if less than 25 percent of the student body in his/her classroom is eligible for free or reduced-price lunch programs; a teacher is in a high-poverty school if 50 percent or more of the student body is his/her classroom is eligible for those programs. The data come from teachers answers to the survey question, “During the current school year, what is your base teaching salary for the entire school year?”
Source: 2015–2016 National Teacher and Principal Survey (NTPS) microdata from the U.S. Department of Education's National Center for Education Statistics (NCES)
As Figures A and B show, teachers in high-poverty schools face a double disadvantage in their pay: first, relative to comparable college-educated workers in nonteaching jobs, and second, relative to their peers in low-poverty schools.7 Put plainly, teacher salaries are just too low “to support a middle-class existence” (Podolsky et al. 2016 and 2019), a reality that is especially true in our hardest-to-staff schools.
More evidence that teacher pay is not only low but falling
The above discussion of the growing teacher pay penalty shows that teacher pay is relatively low and suggests that it is not improving in recent years. The evidence that teacher salaries have in fact deteriorated over the years is found in several sources. The survey data used in this report and in the rest of the reports in this series produce a short-term comparison of salaries in the current decade. Specifically, we find that the average base salary for teachers decreased slightly from about $55,400 in 2011–2012 to $55,000 in 2015–2016 (in 2015 constant dollars).8 Allegretto and Mishel (2019, Figure A) found that the average weekly wage of public school teachers was $1,216 in 1996 and $1,195 in 2018 (in 2018 constant dollars, using the Current Population Survey Outgoing Rotation Group data). In 2018, Time reported that “the country’s roughly 3.2 million full-time public-school teachers (kindergarten through high school) are experiencing some of the worst wage stagnation of any profession, earning less on average, in inflation-adjusted dollars, than they did in 1990, according to Department of Education (DOE) data” (Reilly 2018).
Moonlighting is another indicator that teacher pay is low
Another indicator that teacher pay is low and even falling is that a growing number of teachers are taking second jobs, on top of their full-time job at school. While the surveys providing the data we use do not ask teachers why they take on this extra work, we can speculate, based on news reports, that some teachers are not merely looking to supplement their incomes or to engage in activities that help them build their careers but to make ends meet (Reilly 2018; Long 2019; Talley et al. 2018). According to CNN, teachers in Denver are living with roommates and pursuing side jobs such as serving as ride-sharing drivers to be able to afford basic living expenses (Zdanowicz 2019). Further evidence that some teachers need extra outside income to make ends meet comes from Boser and Straus (2014, 2), who described situations of teachers relying on food stamps and other public benefits: “Mid-career teachers who head families of four or more in multiple states … qualify for several benefit programs, including the Children’s Health Insurance Program and the School Breakfast and Lunch Program.”
As shown in Table 1, in the 2015–2016 school year a large share of teachers (59.0 percent) reported receiving additional compensation aside from their base salary (this is up slightly from the 2011–2012 school year, when it was 55.6 percent). A second job within the school system was the single largest source of moonlighting: 44.1 percent of teachers received additional compensation for activities such as coaching, student activity sponsorship, mentoring other teachers, or teaching evening classes. The share of teachers working jobs outside the school system was smaller but still substantial: almost one in five (18.2 percent) worked jobs outside the school system. Smaller shares earned income from other sources within the school system such as “state supplements” (8.5 percent),9 and from merit pay or other sources based on student performance (5.7 percent).
Moonlighting by public school teachers in all schools and in low- and high-poverty schools: Share of teachers receiving additional compensation, all and by source
| Total | Low-poverty | High-poverty | Gap (high- minus low-poverty school) |
|
|---|---|---|---|---|
| Share of teachers who reported that they received additional compensation: | ||||
| For extracurricular or additional activities for the school system | 44.1% | 45.9% | 42.0% | -3.9 ppt. |
| From other sources from the school system (e.g., supplements) | 8.5% | 7.0% | 9.3% | 2.3 ppt. |
| For work outside of the school system | 18.2% | 19.5% | 17.0% | -2.4 ppt. |
| Based on student performance in the school system (merit pay, etc.) | 5.7% | 5.8% | 5.9% | 0.1 ppt. |
| At least one of the above | 59.0% | 60.3% | 57.5% | -2.9 ppt. |
Note: Data are for teachers in public noncharter schools. A teacher is in a low-poverty school if less than 25 percent of the student body in his/her classroom is eligible for free or reduced-price lunch programs; a teacher is in a high-poverty school if 50 percent or more of the student body is his/her classroom is eligible for those programs.
Source: 2015–2016 National Teacher and Principal Survey (NTPS) microdata from the U.S. Department of Education's National Center for Education Statistics (NCES)
Figure C shows the compensation moonlighters receive from moonlighting activities as a share of their combined base salary and moonlighting pay. For moonlighters, the total compensation from moonlighting activities was $4,100, which represents 7.0 percent of teachers’ base salary plus compensation from moonlighting during the 2015–2016 school year.
Moonlighters’ base salaries and moonlighting compensation for all teachers and for teachers in high- and low-poverty schools
| Base salary for moonlighters | Compensation from moonlighting | |
|---|---|---|
| Total | $54,800 | $4,100 |
| Low-poverty schools | $58,800 | $4,300 |
| High-poverty schools | $53,100 | $4,000 |
Note: Data are for teachers in public noncharter schools. Salaries and moonlighting compensation are averaged and rounded to the closest hundred dollars. A teacher is in a low-poverty school if less than 25 percent of the student body in his/her classroom is eligible for free or reduced-price lunch programs; a teacher is in a high-poverty school if 50 percent or more of the student body is his/her classroom is eligible for those programs. The base salary data come from teachers answers to the survey question, “During the current school year, what is your base teaching salary for the entire school year?” The moonlighting compensation shows the total compensation received from any of the activities listed in Table 1. For this figure, only data from teachers who moonlight are used.
Source: 2015–2016 National Teacher and Principal Survey (NTPS) microdata from the U.S. Department of Education's National Center for Education Statistics (NCES)
Data from both Table 1 and Figure C provide details on how moonlighting for teachers in high-poverty schools compares with moonlighting for teachers in low-poverty schools. As shown in Figure C, Teachers in high-poverty schools report lower-than-average base pay ($53,100) than their peers in low-poverty schools ($58,800) and the amount they receive from moonlighting is $300 lower than the pay generated from moonlighting by teachers in low-poverty schools ($4,000 vs. $4,300). As shown in Table 1, a higher share of teachers in high-poverty schools receives income as state supplements (9.3 percent, versus 7.0 percent, a 2.3 percentage-point gap). However, the share of teachers who work a second job within the school system is 3.9 percentage points lower in high-poverty school than in low-poverty schools. And the share of teachers who work a second job outside the school system is 2.4 percentage points lower in high-poverty schools than in low-poverty schools. Despite the fact that moonlighting brings in more extra pay for teachers in low-poverty schools than in high-poverty schools, the lower base salaries of teachers in high-poverty schools overall (as shown in Figure B), and of moonlighting teachers in these high-poverty schools (as shown in Figure C), means that moonlighting income is nevertheless very important for teachers in high-poverty schools. As seen in Figure C, moonlighting compensation represents roughly 7 percent of total base salary plus earnings from moonlighting for teachers in high-poverty schools.
While financial hardship is likely leading to much of the teacher moonlighting we are seeing, there are other reasons why teachers would undertake extra jobs voluntarily. Some of these within-the-school-system second jobs allow teachers to engage more deeply with their schools, enjoy enhanced collegiality with other peers, or further their professional development. Examples of such paid profession-building activities include mentoring other teachers, coaching students, sponsoring student activities, and engaging in other similar activities. But moonlighting can increase stress and drive disengagement, as teachers are forced to juggle multiple schedules and have their family and leisure time reduced. And if moonlighting occurs outside the school system, the challenges of juggling the extra work are likely greater. For these reasons, the causes and conditions under which this moonlighting occurs determine whether it makes teaching more or less attractive (and thus whether it helps or hurts recruitment and retention).
In addition, when teachers in high-poverty schools supplement their base teacher pay with outside sources of income, lower shares are compensated based on what we call “profession-building” extra work, such as coaching student activities or mentoring other teachers. Teachers in high-poverty schools either don’t have as much access to these profession-building activities (or aren’t paid for them). These disparities in opportunities and compensation for second jobs between teachers in high- and low-poverty schools make teaching less attractive for teachers in high-poverty schools and make high-poverty schools less appealing work destinations for potential new teachers, which in turn contribute to shrinking the pool of applicants for high-poverty schools and to expanding the population of teachers leaving high-poverty schools. In this way, moonlighting can exacerbate the inequitable distribution of highly credentialed teachers across schools.
Teacher pay and the struggle to attract and retain teachers
Low salaries and the perceived need to supplement income by moonlighting—at least among some teachers—make teaching particularly unattractive for the strongest teachers. This deterrent to teaching among the most-credentialed teachers explains in part why not all teachers currently teaching are fully credentialed, and also drives some of the gap between qualifications of teachers in low- and high-poverty schools (for more on the shares of teachers who are not fully credentialed and on the gaps in credentials see García and Weiss 2019a).
We next show that there are gaps between the pay and access to profession-building activities of teachers staying in the profession and the pay and access to profession-building activities of teachers leaving the profession. These gaps point to a relationship that suggests that low pay and a lack of access to paid profession-building activities make it more difficult for schools to attract and retain highly credentialed teachers.
Figure D compares salaries and engagement in moonlighting activities of teachers who stay with teachers who quit. Teachers who quit have lower salaries and engage less in paid profession-building activities than teachers who stay. Annual salaries of those who quit were $2,500 lower than salaries of those who stayed ($50,800 vs. $53,300; these salaries come from the 2011–2012 Schools and Staffing Survey data). Larger shares of teachers who quit had reported in the year before they quit that they were supplementing their base pay with work outside the school system (18.4 percent versus 16.3 percent of teachers who stayed). A smaller share of the quitting teachers were supplementing their base teacher pay by doing paid profession-building activities within the school system the year before they quit (33.3 percent vs. 42.7 percent, a gap of close to 10 percentage points).
Pay of quitting and staying teachers and shares of quitting and staying teachers engaged in moonlighting activities
| Stayed | Quit | |
|---|---|---|
| Salary | $53,300 | $50,800 |
| Stayed | Quit | |
|---|---|---|
| Earn extra pay for additional activities for the school system | 42.7% | 33.3% |
| Earn extra pay based on student performance (merit pay, etc.) | 3.9% | 4.1% |
| Earn pay for work outside of the school system | 16.3% | 18.4% |
Note: Data are for teachers in public noncharter schools. Teaching status is determined by the reported status of teachers in the Teacher Follow-up Survey conducted for the 2012–2013 school year, one year after the Schools and Staffing Survey. Teachers who stay at the same school are teachers whose status the year after is “Teaching in this school.” Teachers who left teaching are those who generated a vacancy in the 2012–2013 school year and are not in the profession (they left teaching, were on long-term leave, or were deceased). Not included in the table are teachers who generated a vacancy in the school year but remained in the profession (i.e., left to teach in another school or were on short-term leave and planned to return to the school).
Source: 2011–2012 Schools and Staffing Survey (SASS) and 2012–2013 Teacher Follow-up Survey (TFS) microdata from the U.S. Department of Education's National Center for Education Statistics
Conclusion
The teacher shortage is real, large, and grew rapidly in a very short number of years. We see no signs that it will go away. Unfortunately, this overall teacher shortage is not the only issue of concern: In our two previous reports, we documented that the problem is more acute when teacher qualifications (credentials, relevant training, experience, etc.) are taken into account; and that high-poverty schools suffer the most from the shortage of highly credentialed teachers. This third report in the series helps shed light on the role that pay and other compensation play in the teacher shortage.
Based on the evidence provided in this report, low relative teacher pay and school poverty are clearly implicated as factors behind the teacher shortage. This relationship between teacher pay and the teacher shortage suggests that policy interventions and institutional decisions to invest more in teacher pay and to widen teachers’ access to paid profession-building activities such as coaching and mentoring could help address the teacher shortage. In addition, given the inequities reported in the first two reports of the series, and the new pay and moonlighting inequities between high- and low-poverty schools described here, we must provide extra supports and funding to high-poverty schools and their teachers, not only to support students directly, but also to reduce teacher shortages.
In our forthcoming reports in the series, we will continue to discuss the factors that make teaching an unattractive profession for current and potential new teachers, going beyond pay to discuss working conditions and the deteriorated prestige of teaching. We argue that policymakers need to think holistically about how to address these factors, and to act fast in ways that support teachers economically, at their workplaces, and enhance the prestige and the professionalism of teaching.
About the authors
Emma García is an education economist at the Economic Policy Institute, where she specializes in the economics of education and education policy. Her research focuses on the production of education (cognitive and noncognitive skills), evaluation of educational interventions (early childhood, K–12, and higher education), equity, returns to education, teacher labor markets, and cost analysis in education. She has held research positions at the Center for Benefit-Cost Studies of Education, the Campaign for Educational Equity, the National Center for the Study of Privatization in Education, and the Community College Research Center; consulted for MDRC, the World Bank, the Inter-American Development Bank, and the National Institute for Early Education Research; and served as an adjunct faculty member at the McCourt School of Public Policy, Georgetown University. She received her Ph.D. in economics and education from Columbia University’s Teachers College.
Elaine Weiss is the lead policy analyst for income security at the National Academy of Social Insurance, where she spearheads projects on Social Security, unemployment insurance, and workers’ compensation. Prior to her work at the academy, Weiss was the national coordinator for the Broader Bolder Approach (BBA) to Education, a campaign launched by the Economic Policy Institute, from 2011 to 2017. BBA promoted a comprehensive, evidence-based set of policies to allow all children to thrive in school and life. Weiss has co-authored and authored EPI and BBA reports on early achievement gaps and the flaws in market-oriented education reforms. She is co-authoring Broader, Bolder, Better, a book with former Massachusetts Secretary of Education Paul Reville that will be published by Harvard Education Press in June 2019. Weiss came to BBA from the Pew Charitable Trusts, where she served as project manager for Pew’s Partnership for America’s Economic Success campaign. She has a Ph.D. in public policy from the George Washington University Trachtenberg School and a J.D. from Harvard Law School.
Acknowledgments
The authors are grateful to Lora Engdahl for her edits to this piece and for her extraordinary contributions to structuring the contents of this series of papers. We are especially thankful for Monique Morrissey for her contributions to framing the discussion on teacher pay and pay more broadly, and for her notes on teacher health and pension benefits. We also appreciate John Schmitt’s supervision of this project and Lawrence Mishel’s guidance in earlier stages of this research and his later comments on this piece. We acknowledge Julia Wolfe for her assistance with the tables and figures in this report, Kayla Blado for her work disseminating the report and her assistance with the media, John Carlo Mandapat for the infographic that accompanies this report, and the rest of the communications staff at EPI for their contributions to the different components of this report and the teacher shortage series. We appreciate EPI Communications Director Pedro da Costa’s coordination of all the steps required for the publication of this report and of the series.
Data sources used in this report
The analyses presented in this report mainly rely on the Schools and Staffing Survey (SASS) 2011–2012, the Teacher Follow-up Survey (TFS) 2012–2013, and the National Teacher and Principal Survey (NTPS) 2015–2016. The surveys collect data on and from teachers, principals, and schools in the 50 states and the District of Columbia.10 All three surveys were conducted by the U.S. Census Bureau for the U.S. Department of Education. The survey results are housed in the National Center for Education Statistics (NCES), which is part of the Department of Education’s Institute of Education Sciences (IES).
The NTPS is the redesigned SASS, with a focus on “flexibility, timeliness, and integration with other Department of Education data” (NCES 2019). Both the NTPS and SASS include very detailed questionnaires at the teacher level, school level, and principal level, and the SASS also includes very detailed questionnaires at the school district level (NCES 2017). The TFS survey, which is the source of data on teachers who stay or quit, was conducted a year after the 2011–2012 SASS survey to collect information on the employment and teaching status, plans, and opinions of teachers in the SASS. Following the first administration of the NTPS, no follow-up study was done, preventing us from conducting an updated analysis of teachers by teaching status the year after the NTPS. NCES plans to conduct a TFS again in the 2020–2021 school year, following the 2019–2020 NTPS.
The 2015–2016 NTPS includes public and charter schools only, while the SASS and TFS include all schools (public, private, and charter schools).11 We restrict our analyses to public schools and teachers in public noncharter schools.
Endnotes
1. For a more detailed review of the media coverage of the shortage, see García and Weiss 2019a. Research on costs come from Carver-Thomas and Darling-Hammond 2017 and the Learning Policy Institute 2017, reports which estimated that filling a vacancy costs $21,000 on average; and Carroll 2007, which estimated that the total annual cost of turnover was $7.3 billion per year. According to Strauss 2017, that estimated annual cost of turnover would exceed $8 billion at present.
2. See Figure 10 in NCES 1993 for a historical overview of the share of female and male teachers in primary and secondary schools. The most recent estimate from NCES is that 76.6 percent of teachers are female (NCES 2018b).
3. However, teachers’ investments in formal and on-the-job training, as well as pension benefits designed to reward tenure, makes turnover costly not only for school districts but for teachers themselves. When a workforce is less responsive to changes in wages than that workforce would be in a competitive market it means the workforce is operating in a “monopsonistic” labor market. See the discussion of monopsony as it applies to teachers in CEA 2016. Researchers distinguish between a monopsony model as technically defined (one with only one or, stretching the definition, relatively few employers) and a market that does not meet the assumptions of a “perfectly competitive” labor market. For a recent discussion of monopsony and its effects on wages see Bivens, Mishel, and Schmitt 2018; for a discussion of monopsony power and the effects on wages, see Bivens and Shierholz 2018.
4. Though public-sector labor markets behave differently from textbook competitive labor markets, and these differences may explain some part of how teacher shortages and declining standards can persist without automatically driving up pay and improving working conditions, an adapted monopsony model does not by itself explain why teachers’ relative pay and working conditions declined in the first place. Instead, the teacher pay gap appears to have both policy and political roots. Anxiety over global competition and widening pay gaps between more- and less-educated workers in the United States has increased pressure on public schools to raise the bar academically. These pressures and lack of reforms or solutions have increased teachers’ stress and reduced their autonomy without any associated increases in teachers’ pay, bargaining power, or prestige.
5. Their report provides comprehensive information on the gaps by gender and by state, showing significant differences on both dimensions. A recent report by the National Education Association also shows the salaries for public school teachers and instructional staff by state in the two most recent school years, the change between these years, and the total growth from 2009–2010 to 2018–2019 (NEA 2019).
6. Employer contributions toward employee pension benefits are supposed to cover the normal cost of the plan—the estimated cost of benefits accrued by workers in a given year—plus or minus an amount needed to pay down any unfunded liability or surplus over a given number of years. The normal cost of pension benefits has increased in recent years due to more conservative actuarial assumptions (lower assumed investment returns and rising life expectancy). In addition, the cost of paying down unfunded pension liabilities increased significantly after 2008 due to the temporary effects of the stock market downturn and a change in accounting standards requiring states to treat future retiree health benefits as liabilities in financial statements. Unlike accrued pension benefits, retiree health benefits are generally not legally guaranteed. However, the Government Accounting Standards Board decided that they should be treated as liabilities because states may have a “constructive obligation” to provide these benefits (GASB 2007). The switch from pay-as-you-go to advance-funded retiree health benefits would have temporarily increased outlays for these benefits under any circumstances, but the increase was accelerated by an assumption of rapid health cost inflation over the projected lifetimes of participants, even though rapid cost inflation invariably results in cost shifting from employers to workers and retirees. Many states also shortened amortization periods for paying down unfunded pension liabilities, which reduces long-term interest costs but increases short-term outlays. Whatever one’s opinion of these changes in assumptions and methods, they had the effect of increasing current outlays for retiree health and pension benefits even as the value of these benefits to workers and retirees actually declined due to benefit cuts in the form of lower cost-of-living allowances and other reduced benefits.
7. This disadvantage might more accurately be described as a tripled or quadrupled compounded disadvantage when one considers the challenging workplace conditions and poor supports teachers in high-poverty schools are more likely to face than teachers in low-poverty schools, as shown in the next two reports in this series. In other words, not only are teachers in high-poverty schools not receiving higher base salaries to compensate for all the challenges in these schools, but also teachers in these schools are paid less.
8. These statistics are raw descriptive statistics, and are not adjusted for any other factor or circumstance.
9. The survey asked teachers, “During the current school year, have you earned income from any other sources from this school system, such as a state supplement, etc.?” While it is not entirely clear what these supplements are, and we were not able to find a definition, it seems that many local school districts attempt to boost insufficient teacher pay through locally raised funds that they distribute to teachers, and that not all districts have the resources to achieve this compensation.
10. The 2015–2016 NTPS does not produce state-representative estimates. The forthcoming 2017–2018 NTPS will support state-level estimates.
11. The forthcoming 2017–2018 NTPS additionally includes the private sector.
References
Allegretto, Sylvia, and Lawrence Mishel. 2019. The Teacher Weekly Wage Penalty Hit 21.4 Percent in 2018, a Record High: Trends in the Teacher Wage and Compensation Penalties Through 2018. Economic Policy Institute and the Center on Wage & Employment Dynamics at the University of California, Berkeley, April 2019.
Bivens, Josh, Lawrence Mishel, and John Schmitt. 2018. It’s Not Just Monopoly and Monopsony. How Market Power Has Affected American Wages. Economic Policy Institute, December 2018.
Bivens, Josh, and Heidi Shierholz. 2018. What Labor Market Changes Have Generated Inequality and Wage Suppression? Employer Power Is Significant but Largely Constant, Whereas Workers’ Power Has Been Eroded by Policy Actions. Economic Policy Institute, December 2018.
Boser, Ulrich, and Chelsea Straus. 2014. Mid- and Late-Career Teachers Struggle with Paltry Incomes. Center for American Progress, July 2014.
Carroll, Thomas G. 2007. Policy Brief: The High Cost of Teacher Turnover. National Commission on Teaching and America’s Future.
Carver-Thomas, Desiree, and Linda Darling-Hammond. 2017. Teacher Turnover: Why It Matters and What We Can Do About It. Learning Policy Institute, August 2017.
Council of Economic Advisers (CEA). 2016. Labor Market Monopsony: Trends, Consequences, and Policy Responses. Issue Brief, October 2016.
García, Emma, and Elaine Weiss. 2019a. The Teacher Shortage Is Real, Large and Growing, and Worse Than We Thought: The First Report in the “Perfect Storm in the Teacher Labor Market” Series. Economic Policy Institute, March 2019.
García, Emma, and Elaine Weiss. 2019b. U.S. Schools Struggle to Hire and Retain Teachers: The Second Report in “The Perfect Storm in the Teacher Labor Market” Series. Economic Policy Institute, April 2019.
Governmental Accounting Standards Board (GASB). 2007. Other Postemployment Benefits: A Plain-Language Summary of GASB Statements No. 43 and No. 45.
Learning Policy Institute. 2017. What’s the Cost of Teacher Turnover? (calculator). September 2017.
Long, Cindy. 2019. “Money Still Matters: A Tale of Two Teachers,” National Education Association, accessed April 30, 2019.
National Center for Education Statistics (NCES). 1993. “Figure 10. Percentage of Elementary and Secondary School Teachers, by Sex: 1869–70 to Fall 1990.” In 120 Years of American Education: A Statistical Portrait. U.S. Department of Education, Office of Educational Research and Improvement, January 1993.
National Center for Education Statistics (NCES) (U.S. Department of Education). 2011–2012. Licensed microdata from the 2011–2012 Schools and Staffing Survey (SASS).
National Center for Education Statistics (NCES) (U.S. Department of Education). 2012–2013. Licensed microdata from the 2012–2013 Teacher Follow-up Survey (TFS).
National Center for Education Statistics (NCES) (U.S. Department of Education). 2015–2016. Licensed microdata from the 2015-2016 National Teacher and Principal Survey (NTPS).
National Center for Education Statistics (NCES) (U.S. Department of Education). 2017. Documentation for the 2011–12 Schools and Staffing Survey. March 2017.
National Center for Education Statistics (NCES). 2018a. “Table 208.20. Public and Private Elementary and Secondary Teachers, Enrollment, Pupil/Teacher Ratios, and New Teacher Hires: Selected Years, Fall 1955 Through 2027.” Digest of Education Statistics: 2017, Institute of Education Sciences, U.S. Department of Education, NCES no. 2018-070, January 2018.
National Center for Education Statistics (NCES). 2018b. “Table 209.10. Number and Percentage Distribution of Teachers in Public and Private Elementary and Secondary Schools, by Selected Teacher Characteristics: Selected Years, 1987–88 through 2015–16.” Digest of Education Statistics: 2017, Institute of Education Sciences, U.S. Department of Education, NCES no. 2018-070, January 2018.
National Center for Education Statistics (NCES) (U.S. Department of Education). 2019. “NTPS Overview” (web page), accessed March 2019.
National Education Association (NEA). 2019. Rankings of the States 2018 and Estimates of School Statistics 2019, NEA Research, April 2019.
Podolsky, Anne, Tara Kini, Joseph Bishop, and Linda Darling-Hammond. 2016. Solving the Teacher Shortage: How to Attract and Retain Excellent Educators. Learning Policy Institute, September 2016.
Podolsky, Anne, Tara Kini, Linda Darling-Hammond, and Joseph Bishop. 2019. “Strategies for Attracting and Retaining Educators: What Does the Evidence Say?” Education Policy Analysis Archives 27(38). http://dx.doi.org/10.14507/epaa.27.3722
Reilly, Katie. 2018. “‘I Work 3 Jobs and Donate Blood Plasma to Pay the Bills.’ This Is What It’s Like to Be a Teacher in America,” Time, September 13, 2018.
Strauss, Valerie. 2017. “Why It’s a Big Problem That So Many Teachers Quit—and What to Do About It,” Washington Post, November 27, 2017.
Sutcher, Leib, Linda Darling-Hammond, and Desiree Carver-Thomas. 2016. A Coming Crisis in Teaching? Teacher Supply, Demand, and Shortages in the U.S. Learning Policy Institute, September 2016.
Talley, Tim, Melissa Daniels, Michael Melia, and John Raby. 2018. “‘I Just Have to Do It.’ Teachers Struggle with Second Jobs,” AP News, April 15, 2018.
Zdanowicz, Christina. 2019. “Denver Is So Expensive That Teachers Have to Get Creative to Make Ends Meet.” CNN, February 11, 2019.
