Part of the series Labor Day 2019: How Well Is the American Economy Working for Working People?
Summary: The real value of the federal minimum wage has dropped 17% since 2009 and 31% since 1968. Workers earning the federal minimum wage today have $6,800 less per year to spend on food, rent, and other essentials than did their counterparts 50 years ago. Some states have raised their minimum wages beyond just the rate of inflation, and wage growth for low-wage workers in those states is faster than in states without such increases. It’s not just minimum wage workers who benefit: Low-wage workers in general tend to get a wage bump when the wage floor rises. The Raise the Wage Act of 2019 would raise wages for 33.5 million workers nationwide by increasing the federal minimum wage to $15 by 2025, and would set it to update automatically each year based on median wage growth.
While the unemployment rate remains at historic lows and the labor market continues to tighten, wage growth has remained below target levels and has indeed showed some signs of slowing in the first half of 2019.1 Over time, ever-tighter labor markets have been needed to generate a given pace of wage growth, in part because of the erosion of policy institutions and labor standards that support workers’ bargaining power and leverage when they negotiate over pay with employers.2
Low-wage workers in particular are falling behind because the federal minimum wage has not been raised in 10 years, remaining stuck at $7.25 per hour since 2009. Since the minimum wage was first established in 1938, Congress has never let it go unchanged for so long.3 Each year Congress fails to raise the nominal value4 of the minimum wage, price inflation lowers the minimum wage’s purchasing power for low-wage workers and their families.
The federal minimum wage is worth 17% less than it was 10 years ago
Figure A shows the real (inflation-adjusted) value of the minimum wage since it was established. Workers earning the $7.25 federal minimum wage 10 years ago were being paid the inflation-adjusted equivalent of $8.70 an hour in this year’s dollars. In other words, workers now earning the federal minimum wage are paid 17% less than they would have been paid 10 years ago.
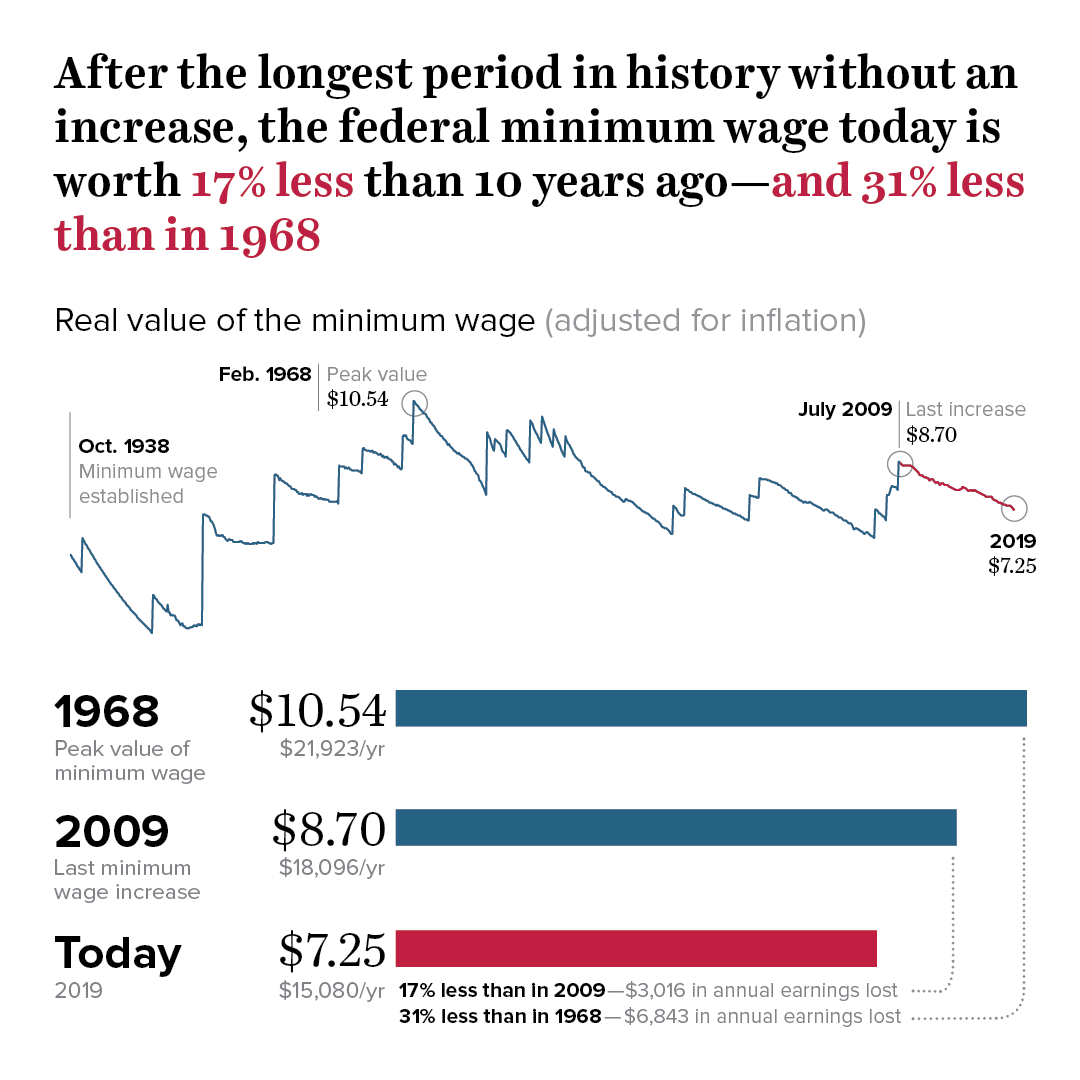
Even worse is that federal-minimum-wage-earning workers today are paid 31% less than the $10.54 an hour they would have been paid in 1968, when the minimum wage reached its highest (inflation-adjusted) value. More concretely, full-time workers at the federal minimum wage earn $6,800 less per year in real wage income compared with their counterparts five decades ago. This has happened even as labor productivity has essentially doubled over the last 50 years: The amount of goods that can be produced (or services that can be provided) in an hour of work has grown to twice what it was, yet workers’ pay has not.5
State-level minimum wage increases have benefited low-wage workers—but workers in many states are missing out
While federal policymakers have neglected to increase the federal minimum wage, many states and cities have raised their own minimum wages above the federal level. As of July 2019, 29 states and the District of Columbia have wage floors higher than the federal minimum. The lowest-paid workers in these states are clearly better off than their counterparts in the 21 states with a minimum wage still stuck at the federal level of $7.25 per hour.
But there are still important differences among the states that have raised their minimums above the federal level. In eight of these states, the increases have been too infrequent and small to stay ahead of the rising cost of living. That leaves just 21 states (and the District of Columbia) where the inflation-adjusted minimum wage actually rose in value between 2010 and 2018 (see Figure B).
For workers in the 21 states (and the District of Columbia) with real minimum wage increases—i.e., increases larger than inflation—there were meaningful economic benefits: The wages of low-wage workers in those states rose much faster than in states without real minimum wage increases. Figure C shows the gains in the 10th percentile hourly wage (i.e., the wage for the worker who earns more than only 10% of all workers) between 2010 and 2018 for each set of states, overall and by gender. Between 2010 and 2018, the 10th percentile hourly wage rose by 9.9% in states with real minimum wage increases, compared with growth of only 5.7% in states without an inflation-adjusted increase in their minimum wage. (The annualized growth rate in the 10th percentile wage was 0.5 percentage points faster in states with real minimum wage increases compared with states without—a sizable benefit considering labor markets were already tightening in all states during this time period.)
Wages for low-wage workers rose faster in states with real minimum wage increases: Change in the 10th percentile real wage in each state group between 2010 and 2018, overall and by gender
| States without real increase | States with real increase | |
|---|---|---|
| Overall | 5.7% | 9.9% |
| Men | 6.0% | 8.6% |
| Women | 2.8% | 10.7% |
Note: The real minimum wage increased between 2010 and 2018 in Alaska, Arizona, Arkansas, California, Colorado, Connecticut, District of Columbia, Hawaii, Maine, Maryland, Massachusetts, Michigan, Minnesota, Nebraska, New Jersey, New York, Oregon, Rhode Island, South Dakota, Vermont, Washington, and West Virginia.
Source: Authors’ analysis of Current Population Survey basic monthly microdata from the U.S. Census Bureau
These increases are not insignificant, as they are akin to the kind of wage boost that comes from substantially reducing unemployment. Historically, a one percentage point reduction in the overall unemployment rate has led to a 0.5 percentage point increase in the annual growth rate of the 10th percentile hourly wage.6 As noted above, the annualized wage boost for low-wage workers in states with real minimum wage increases was about 0.5 percentage points; this means that those states provided low-wage workers the wage growth benefits associated with an additional percentage point reduction in their unemployment rates, above and beyond their already tightening labor markets.
These real minimum wage increases since 2010 have not only raised low-wage workers’ wages generally, but have also played an important role in reducing the gender pay gap at the bottom of the wage distribution. In states with real minimum wage increases, the 10th percentile wage grew faster for women than for men (10.7% vs. 8.6%) In contrast, in states without real minimum wage increases, women’s 10th percentile wage rose at only about half the pace of men’s 10th percentile wage.
With the goal of further boosting earnings and reducing wage inequality, seven states and 31 cities and counties have enacted legislation that will raise their minimum wages to at least $15 per hour over the next few years. Yet in the absence of federal action or additional state action, 23.2 million workers will still be paid less than $15 per hour in 2025.7 Among these would be a disproportionate share of black workers, since black workers are not only overrepresented among low-wage workers, but they are also less likely to live in states that have passed a minimum wage that is higher than the current federal minimum.8
Conclusion: We need to raise the federal minimum wage to lift up low-wage workers
The minimum wage is a key policy needed to reverse decades of downward pressure on the wages of low-wage workers. A $15 minimum wage by 2025, as outlined in the Raise the Wage Act of 2019 recently passed by the U.S. House of Representatives, would raise wages for a total of 33.5 million workers.9 The Act would also set the minimum wage to update automatically each year to reflect wage growth for middle-wage workers, thus preventing erosion in the value of the minimum wage and stopping the growth in inequality between workers in the middle and those at the bottom of the wage scale.10
Endnotes
1. Economic Policy Institute, Nominal Wage Tracker (web page), last updated August 2, 2019; Josh Bivens, “Not Just ‘No Heat’ but Signs of Cooling: The Case for FOMC Rate Cuts Has Real Merit,” Working Economics Blog (Economic Policy Institute), July 30, 2019.
2. Josh Bivens and Ben Zipperer, The Importance of Locking in Full Employment for the Long Haul, Economic Policy Institute, August 21, 2018.
3. David Cooper, Congress Has Never Let the Federal Minimum Wage Erode for This Long (economic snapshot), Economic Policy Institute, June 2019.
4. The nominal value is the actual dollar amount.
5. Economic Policy Institute, The Productivity–Pay Gap (web page), last updated July 2019.
6. Josh Bivens and Ben Zipperer, The Importance of Locking in Full Employment for the Long Haul, Economic Policy Institute, August 21, 2018.
7. David Cooper, Raising the Federal Minimum Wage to $15 by 2025 Would Lift Wages for over 33 Million Workers (fact sheet), Economic Policy Institute, July 2019.
8. Valerie Wilson, The Raise the Wage Act of 2019 Would Give Black Workers a Much-Needed Boost in Pay (economic snapshot), Economic Policy Institute, February 2019.
9. David Cooper, Raising the Federal Minimum Wage to $15 by 2025 Would Lift Wages for over 33 Million Workers (fact sheet), Economic Policy Institute, July 2019.
10. Automatic adjustments to the federal minimum wage are described in our February 2019 analysis of an earlier iteration of the Raise the Wage Act. See David Cooper, Raising the Federal Minimum Wage to $15 by 2024 Would Lift Pay for Nearly 40 Million Workers, Economic Policy Institute, February 2019.
