The June 2010 employment report released this morning by the Bureau of Labor Statistics provides a sobering snapshot of where we are now, two-and-a-half years since the start of the recession in December 2007. Unemployment remains at a very high 9.5%. Nearly half (45.5%) of all unemployed workers have been unemployed for over six months, and there are 25.8 million workers who are either unemployed or underemployed. The labor force is actually smaller than when the recession started, another indication of lost opportunities.
The unemployment rate declined 0.2 percentage points in June, but that was primarily due to a decline in the labor force of 652,000 workers. If these workers had remained in the labor force and were unemployed, the unemployment rate in June would have been 9.9%. The number of payroll jobs declined by 125,000 in June, though the shedding of 225,000 temporary Census jobs more than accounted for that loss. In order to get a handle on the fundamentals of the labor market this summer, it is and will continue to be important to look at the payroll numbers excluding changes in temporary Census employment. (The Census still has 339,000 temporary employees on its payroll, which will also disappear by the end of the summer.)
Excluding changes in temporary Census hiring, the number of payroll jobs increased by 100,000 in June. The private sector added 83,000 jobs, while state and local governments, their budgets crunched, shed 10,000 jobs. The federal government (excluding changes in temporary Census jobs) added 27,000 jobs.
Hours
The length of the average workweek decreased slightly in June, from 34.2 to 34.1 hours, another sign of the weakness of the recovery. Average hours are, however, up from their low of 33.7 last fall. At the start of the recession in December 2007, the length of the average workweek in the private sector was 34.7 hours, so there is still a lot to make up. Simply restoring average hours worked by all 107.7 million private sector workers from 34.1 back to 34.7 would be the equivalent to adding 1.9 million new jobs at current average hours. The restoration of average hours will therefore be an ongoing drag on new hiring.
Wages
Another bad sign in today’s report is the fact that average hourly wages declined, from $22.55 to $22.53 in June. Nominal hourly wage growth has been generally slowing since the summer of 2008 and remains low—wages grew at a 0.9% annualized rate over the last three months. They grew at 1.7% over the last year, slower than inflation (which was 2.0% from May 2009 to May 2010, the most recent data available), meaning real hourly wages have declined over the last year. After falling faster than average hourly wage growth for the first year and a half of the recession, average weekly earnings growth had seen some improvements since last summer, as average hours had been improving. June’s decline in average hours meant weekly paychecks took a hit—after growing at a 4.9% annualized rate over the prior three months, average weekly paychecks declined at a 4.5% annualized rate in June.
Labor Force Participation
In June, the unemployment rate was 9.5%, equal to the unemployment rate a year ago in June 2009. However, labor force participation is an entire percentage point lower now than it was a year ago. This points to another ongoing issue in the labor market: the backlog of “missing workers,” that is, workers who dropped out of (or never entered) the labor force during the downturn. The labor force decreased in June by 652,000 workers, adding to the backlog. In the last two months, the labor force has declined by 974,000 workers, reversing much of the 1.7 million increase in the labor force in the first four months of the year. To get an idea of the size of the current backlog of missing workers, consider the following: The labor force should have increased by around 3.5 million workers from December 2007 (the start of the recession) to June 2010, given working-age population growth over this period, but instead it decreased by 128,000. This means that the pool of “missing workers” now numbers around 3.6 million, none of whom are reflected in the official unemployment count. As these workers enter or re-enter the labor force in search of work, this will contribute to keeping the unemployment rate high.
Long-term unemployment
The share of unemployed workers who have been unemployed for over six months dropped slightly from 46.0% to 45.5%, though it remains the third-highest share on record, and there are still 6.8 million workers who have been unemployed for longer than six months. These figures are unsurprising given that there remain five unemployed workers per job opening. The median, or typical, unemployment spell rose from 23.2 to 25.5 weeks, and the average unemployment spell rose from 34.4 to 35.2 weeks. Both the median and average unemployment durations are record highs.
Underemployment
The “underemployment rate,” (or the U-6 measure of labor underutilization) is a more comprehensive measure of labor market slack than the unemployment rate because underemployment includes not just the officially unemployed, but also jobless workers who have given up looking for work and people who want full-time jobs but have had to settle for part-time work (note, however, it does not include people who are underemployed in the sense that they have had to take a job that is below their skills, training, or experience level). This measure declined by 0.1 percentage point in June, despite an increase of 321,000 in the number of “marginally attached” workers (jobless workers who have given up looking for work), and remains at an extremely high 16.5%. In June, there were a total of 25.8 million workers who were either unemployed or underemployed.
Demographics
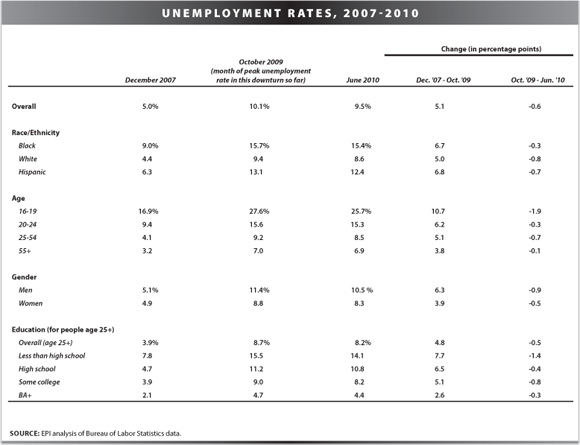
Demographic breakdowns show that while all major groups have experienced increased unemployment in this downturn, some groups got hit particularly hard: racial and ethnic minorities, young workers, men, and workers with lower levels of schooling. The table (below) shows unemployment rates for various demographic groups at the start of the recession (December 2007), at the month of the peak unemployment rate in the current downturn so far (October 2009), and for the current month (June 2010). Black workers currently have an unemployment rate of 15.4% and have seen the least improvement since last fall. Older workers (age 55+) have seen the lowest unemployment rates throughout the downturn, but almost all improvements since last fall have gone to younger workers. Men saw much more dramatic increases in unemployment than women over the downturn, and have also seen the lion’s share of the gains since last fall. Among education groups, workers with a college degree or more have seen by far the lowest unemployment rates throughout the downturn, but most improvements since last fall have gone to workers without a college degree.
Industry and Sector
The shedding of public sector jobs at the state and local level remains an ongoing drag on employment growth. In June, state and local governments shed 10,000 jobs (2,000 state and 8,000 local). Since their peak level in August 2008, state and local governments have shed 242,000 jobs (44,000 state and 198,000 local).
Temporary help services added 21,000 jobs in June. In other words, roughly a
quarter of the 83,000 private sector jobs added in June were temporary help jobs. Construction saw a loss of 22,000 jobs, mostly in nonresidential. Manufacturing added 9,000 jobs, its sixth straight month of gains, though lower than the average gain of the prior three months, which was 30,000. Retail trade lost 6,600 in June, its second month of decline. Financial activities lost 15,000, with 6,500 of those lost in real estate. Leisure and hospitality added 37,000 jobs in June, after adding an average of 17,000 for the prior three months. These gains were mostly in entertainment and recreation, rather than accommodation and food services. Health care added 9,000 jobs in June, after adding an average of 20,000 for the prior three months.
Population Growth and the Labor Market
The labor market remains 7.5 million payroll jobs below where it was at the start of the recession in December 2007. This number, as bad as it is, understates the size of the gap in the labor market by failing to take into account the fact that simply to keep up with the growth in the working-age population, the labor market should have added around 3.1 million jobs since December 2007. This means the labor market is now roughly 10.6 million jobs below the level needed to restore the pre-recession unemployment rate (5.0% in December 2007). To get down to the pre-recession unemployment rate within four years, the labor market would have to add roughly 325,000 jobs every month for that entire period. In June, excluding changes in temporary Census hiring, the labor market added 100,000.
Conclusion
With a deficit of 10.6 million jobs, a 9.5% unemployment rate, and the private sector not yet able to provide a robust recovery, Congressional inaction in passing policies that support job creation and economic growth, including renewing extended unemployment insurance and providing fiscal relief to the states, is inexcusable.
— Research assistance from Kathryn Edwards and Andrew Green
