Briefing Paper #100
The economic expansion in the United States turned 115 months old in October 2000, exceeding even the 106-month expansion of the 1960s associated with the war in Vietnam. The current expansion is, in fact, the longest in the economic history of the U.S. Today, total U.S. civilian employment is about 134 million people.
Average annual growth rates for gross domestic product (GDP) and productivity during the first half of the 1990s were not very impressive: they were similar to those that prevailed after 1973 and substantially below those in the earlier post-World War II expansions. GDP growth after 1973, while slower than in earlier periods, was bolstered by increases in female labor force participation rates and in the volume of hours worked. Productivity growth between 1973 and 1995, however, averaged 1.4% a year, only half the 2.9% rate at which it grew between 1961 and 1973.
Since the second half of the 1990s, however, both productivity and GDP have grown at rates that rival the high growth years of the 1960s and early 1970s. In the last year, moreover, real GDP growth has accelerated. At an annual rate, GDP (output) grew at 7% in the second half of 1999, at 4.8% in the first quarter of 2000, and at 5.2% in the second quarter of 2000. Over the last 12 months, it grew a rapid 6%. Productivity growth averaged 1.4% a year between 1989 and 1995, but jumped to a 2.5% annual rate between 1995 and 1999. It has been even more robust recently: in the second quarter of 2000, productivity grew at an annual rate of 5.3%, and over the last 12 months it rose by 5.1% – its fastest pace since 1983. In 1983, however, the U.S. economy was still recovering from a deep recession. What is unusual is that the current rapid pace of productivity growth is occurring after years of economic expansion.
The long expansion has resulted in sustained low unemployment and tight labor markets, with the economy operating close to its full capacity. The unemployment rate has remained below 5.5% since February 1996. In 1999, it was 4.2%, and it hovered around 4.1% through October 2000. At no other time since 1970 has the unemployment rate remained below 5.5% for more than two consecutive years. This prolonged period of unemployment has led to sharp declines in joblessness for blacks and Hispanics as well. In 1999, the unemployment rate was 8.0% for blacks and 6.4% for Hispanics.
While low-wage jobs have continued to expand in the 1990s, they are growing more slowly than in the 1980s. The low-paying retail trade industry – which includes fast food restaurants – accounted for 25% of job growth in the 1980s but only 16% in the 1990s. Part-time, temporary, and other forms of contingent employment have also contributed less to job growth. Part-time employment has fallen from 17.5% of all jobs to 16.5% since 1995. Excluding self-employed shop keepers, who are about 5% of the U.S. workforce, the share of all nonstandard work arrangements – regular part-time, temporary help, independent contractor, contract firm – has fallen from 26.4% of the workforce in 1995 to 24.8% in 1999. This means that 75% of workers are in regular full-time jobs.
Two points should be noted. First, the level of contingent employment in the U.S., including the share of part-time jobs, is lower than in many other countries of the OECD (the Organization for Economic Cooperation and Development). Second, contingent employment, including part-time as well as self-employment, has declined as labor markets have tightened. This trend suggests that many workers engage in part-time or self-employment activities to escape unemployment, and not because this is their preferred work arrangement.
As identified by Lawrence Mishel, Jared Bernstein, and John Schmitt, the authors of the Economic Policy Institute’s flagship publication, The State of Working America 2000-2001, this sustained low unemployment has led to three new developments in the U.S. economy. They are
- Rapid wage growth: After more than 15 years of stagnation and decline, real wages (wages adjusted for inflation) began to rise in 1995. What’s more, these very recent increases have been largest for workers at the bottom. After adjusting for inflation, the median wage for all workers grew 7.3% during 1995-99. For workers at the bottom, wages grew even more rapidly: as a result of sustained low unemployment and of two increases in the minimum wage in the 1990s, the real wage of workers in the bottom 10% of the wage range rose a strong 9.3%. The highest-paid workers – those in the top 5% – had wage gains of 8.5%. Workers in the middle experienced the smallest gains during 1995-99, with wages rising, as noted above, by 7.3%.
- Acceleration in the growth of labor productivity: Since 1995, labor productivity has grown about 2.5% per year, well above the 1.4% rate that prevailed from the mid-1970s through the mid-1990s. In the last 12 months, productivity has risen even more rapidly, increasing 5.1%.
- Change in the shape of wage inequality: In the 1980s, inequality “fanned out” – the top pulled away from the middle, and the middle pulled away from the bottom. Over the full decade of the 1990s (not just the last few years), however, wages at the bottom and the middle grew closer, while the top pulled further away from the middle.
Tight labor markets that have persisted for more than four-and-a-half years have contributed to all three of these new developments. U.S. workers have translated the increased bargaining power that comes with sustained low unemployment into higher wages. The tight labor market also provides incentives for firms to operate more efficiently, and this has contributed to the acceleration in the growth of labor productivity. The acceleration in the growth of labor productivity has made it possible for firms to pay higher wages without increases in unit labor costs or inflationary pressures on prices. Finally, a tight labor market has the largest positive effect on the least-skilled workers, who typically have the lowest wages. As a result, the tight labor market that has characterized the U.S. economy since 1996 has boosted the wages of workers at the bottom even more than it did those of workers in the middle.
The development and deployment of information technology (IT) in the U.S. economy has played an important role in the acceleration of productivity growth in the latter part of the 1990s. The division of the economy into an “old economy” and a “new economy” presents a false dichotomy and is very misleading. IT has had dramatic impacts on manufacturing and on wholesale and retail trade, as well as on such IT-intensive activities as communications and financial services. Many U.S. companies have introduced more participatory workplace practices that involve front-line workers in decisions and that take full advantage of the potential of IT. As a result, investments across the economy in IT hardware and software are paying off in terms of more rapid innovation, greater competitiveness, and higher productivity growth of U.S. companies. Manufacturing industries, especially those producing IT equipment but also older industries such as steel, have experienced the highest rates of productivity growth.
Rapid productivity growth is a two-edged sword. It increases the potential for prosperity and economic growth, but its net effect on employment depends on demand. Increases in demand will have to outpace productivity growth if employment is to continue to grow in the future. A robust demand response to accelerated productivity growth is certainly possible, as we have seen in the U.S., but it hinges on three conditions – innovation and the development of new products as well as new processes, a fall in relative prices in industries where productivity growth is most rapid, and an across-the-board increase in workers’ earnings in line with productivity growth. These conditions are
currently being met in the U.S.
Yet, while the situation for American workers has clearly improved during the last four or five years, it is still far from “good.” The contrast is between “trends” and “levels.” Trends in U.S. wages since 1995 have been positive. However, the U.S. economy has a long way to go to reverse the broad-based wage erosion and rising wage inequality of the 1979-95 period. Workers are still struggling to get back to the wage levels they achieved, in real terms, in 1979.
- Wages: Between 1989 and 1999, labor productivity increased 20.5%. However, this rise did not translate into a comparable growth in wages for the typical worker. Despite recent gains, the median hourly wage of men was slightly less in 1999 than in 1989, while for women it was up just 4%.
- Profits: Rather than in wages, improvements in productivity were captured by the owners of capital as the rate of profit soared in the 1990s to historically high levels. The after-tax rate of profit was 8.1% in 1999 compared with 5.7% in 1989 and 4.9% in 1979. The result is a rise in the share of national income paid to the owners of capital, with a corresponding lower share paid out as wages and benefits to workers.
- Benefits: A lower share of the workforce has employer-provided health insurance coverage today (62.9% of workers in 1998) than 20 years ago (70.2% of workers in 1979). Nearly half the workforce is without pension coverage.
- Family income and hours of work: Middle-class, married couples with children have had an increase in family income between 1989 and 1998 (most recent year for which data are available) of 9.2%. This was largely due, however, to an increase in family work hours – up 246 hours since 1989. This increase in family work hours follows an even larger increase during the 1980s. Average annual hours of work have increased from 3,272 in 1979 – equivalent to a little more than one full-time and one half-time job – to 3,885 hours in 1998 – two full-time jobs.
- Income inequality: Despite strong growth in inflation-adjusted family incomes in the last half of the 1990s, real income growth over the entire decade was slow and unequally distributed. The inequality of market-based incomes rose rapidly in both the 1980s and 1990s. Progressive taxes enacted in the 1990s have reduced this growth of inequality somewhat. Using a comprehensive measure of income that includes capital gains, health insurance, and government cash transfers and non-cash programs, and that subtracts taxes, the ratio of family income in the top fifth to family income in the bottom fifth rose from 7.7 in 1979 to 8.7 in 1989 and 9.7 in 1998. Households in the top quintile have disposable incomes almost 10 times as large as households in the bottom quintile. Households in the top fifth have incomes almost three times as large as do households in the middle fifth.
- Debt: For the typical household, rising debt, not a rising stock market, was the big story of the 1990s. Household debt grew much faster than household income in the 1990s. By 1999, total household debt exceeded total household disposable income for the first time in history. In 1998 the average outstanding debt for households in the middle fifth of the income distribution was $45,800, up $11,800 since 1989.
- Stocks and net worth: Most Americans have no economically meaningful stake in stocks. The top 1% of stock owners hold almost half of all stocks, by value. In contrast, the bottom 80% own just 4.1% of total stock holdings. The booming stock market may have been the top financial story of the 1990s, but it has had little relevance for most Americans. Less than half (48.2%) of all households own any stock at all, either directly or through a pension fund, and only a third own $5,000 or more. The net worth of middle-income households – taking into account all assets (family house, checking and savings accounts, stock holdings, retirement funds) and all debts (mortgage, credit card debt, student loans, other debts) – increased by just $2,000 in real terms between 1989 and 1998, from $59,000 to $61,000.
- Poverty: Despite improvements in the second half of the 1990s, the national poverty rate in 1998 was 12.7%, about the same as it was in 1989 and one percentage point higher than in 1979. (The U.S. uses an absolute, not a relative, standard of poverty that is adjusted for family size.) Child poverty remains stubbornly high. In 1998 almost one child in five (18.9%) lived in poverty. Among African American and Hispanic children, more than one in three were growing up in poverty. The poverty line was $16,530 in 1998 for a family of three. Despite setting the poverty line so low, more than one in 10 whites and more than one in four African Americans and Hispanics lives in a household whose income is below the poverty line.
It is instructive to compare the performance of the U.S. economy with that of other OECD countries. The data show that the U.S. suffers from greater earnings and income inequality and higher poverty rates than almost every other OECD economy. Due to the highly unequal distribution of income in the U.S., low-wage workers and low-income households here are almost universally worse off in absolute terms than their low-wage, low-income counterparts in other, less-affluent countries.
Supporters of the U.S. model generally acknowledge the extremes of inequality in the United States, but they argue that the model provides greater mobility, greater employment growth, and greater dynamism than do other economies. The evidence, however, does not support this view.
- Mobility: Economic mobility for low-wage workers and poor families appears to be lower in the U.S. than in most European economies. Only 11.3% of the lowest-paid workers (workers in the lowest fifth of the earnings distribution) in the U.S. in 1986 had moved to the upper three-fifths of the earnings distribution by 1991. In contrast, the proportion that achieved such wage mobility in 16.6% in West Germany, 22.8% in France and Italy, 23.6% in the United Kingdom, 20.7% in Denmark, 24.8% in Finland, and 18.4% in Sweden.
- Job growth: U.S. job growth rates in the 1990s were lackluster compared with past rates of job growth in this economy and no better than several other OECD countries with very different kinds of labor market institutions. Jobs grew in the U.S. at an annual rate of 1.3% between 1989 and 1998. Job growth in Australia, Ireland, Netherlands, New Zealand and Portugal exceeded that of the U.S. in 1989-98, while that of Canada and Spain came close to the U.S.
- Unemployment: While the U.S. is the only economy to escape rising unemployment rates over the last two decades, several OECD countries still have unemployment rates near or below that of the United States. The 1999 unemployment rate for the U.S. was 4.2%. OECD countries with unemployment rates below 4% in 1999 are Austria, Netherlands, Norway and Switzerland. Japan and Portugal have unemployment rates between 4% and 5%. Denmark and Finland have unemployment rates between 5% and 6%.
- Nonstandard work arrangements: European observers often attribute U.S. job creation to the growth of part-time work and self-employment. This is a dangerous misconception. Part-time employment has been roughly constant in the U.S. since 1979, varying between 17.1 and 18.1% of the workforce. Self-employment has also been roughly constant during good economic times, varying between 6.7 and 7.5% of the U.S. workforce. It reached 8.1% of the workforce in 1992, at the height of the last recession. Self-employment is lower in the U.S. than in all other OECD countries (Blanchflower 2000).
- Low-skill workers: Most importantly, the pattern of unemployment rates in OECD countries is completely inconsistent with the view that labor market institutions in countries other than t
he U.S. have priced less-educated workers out of jobs. In fact, the “flexible” U.S. labor market has the highest relative unemployment rate for less-educated workers among all the OECD countries. U.S. workers with less than a high school degree are 4.5 times as likely to be unemployed than are college-educated workers. On average, for the rest of the OECD countries, those with less than a high school degree are only 2.3 times as likely to be unemployed. U.S. workers with a high school degree are 2.1 times as likely to be unemployed than are college-educated workers. On average, for the rest of the OECD, workers with a high school degree are only 1.5 times as likely to be unemployed than are college-educated workers. - Labor productivity: Finally, while relative productivity levels in the U.S. exceeded those in the rest of the OECD in 1960, 1973, and 1987, that was no longer the case in 1997. Despite a recent pick-up in labor productivity growth rates, the rate of productivity growth in the U.S. lagged that of all other OECD countries except Switzerland in the 1980s and 1990s. As a result, virtually all countries have narrowed the productivity gap with the U.S., and several countries now have productivity levels that are as high or higher than in the U.S. These countries are Western Germany, France, Belgium, Netherlands, and Norway. These data suggest that for much of the 1980s and 1990s the U.S. economy has been among the least dynamic of the OECD economies, although this may now be changing.
The success of the U.S. economy in maintaining low unemployment, low inflation, sustained growth, and, most recently, rapid productivity growth is not due to its high income inequality and extremes of poverty and wealth. Indeed, productivity growth has accelerated and employment has continued to grow in the last half of the 1990s even as wages at the bottom grew rapidly and the growth of low-wage employment moderated significantly.
The labor market situation
Sustained low unemployment has had a positive effect on employment opportunities for American workers. The last few years have brought expanded employment opportunities to even disadvantaged groups – including women, blacks, and Hispanics. The long-term rise in job instability and job insecurity, which continued well into the current expansion, has finally abated. And the share of workers in nonstandard – often substandard – work arrangements, such as temporary work and part-time work, has declined as opportunities for regular full-time employment have increased.
Employment growth
Since the end of World War II, strong employment growth has been a hallmark of the U.S. economy (see Table 1). In large part, this has been the result of growth in the working age population. In contrast to many other industrialized economies, the working age population of the U.S. grew about 2% a year between 1967 and 1979 and about 1.2% a year since then. Employment has also grown as a result of a dramatic increase in the employment-to-population ratio of women, as greater numbers of adult women sought employment. While the employment-to-population ratio for men aged 16 to 64 declined slightly from 82.8% of men to 80.5% between 1973 and 1998, the employment rate for women increased from 48.0% in 1973 to 67.4% in 1998 (Freeman 2000). However, most of the increase in female labor force participation took place between 1973 and 1989. As a result the overall employment rate for all adults 20 years of age and older, which grew at a rate of 0.48% per year in the 1970s and 0.28% a year in the 1980s, was virtually flat in the 1990s, growing only 0.06% a year (see Table 2).


Rapid increases in both the working age population and in the female labor force participation rate between 1973-79 led to robust employment growth over that business cycle. The rate of job growth slowed along with the growth of the working age population between 1979 and 1989 despite continued increases in the female labor force participation rate. The leveling off of the labor force participation rate and slower growth in the working age population has meant slower employment growth over the current business cycle. Indeed, the annual growth in employment over the current business cycle is the slowest in the post-war period.
Table 1 presents four measures of employment growth. The first two examine job creation – non-farm payroll employment (from a national survey of business establishments) and civilian employment (from a national survey of households). The second two indicators track the total “volume” of work – measured as the total number of hours worked in the economy in a year and the total number of full-time equivalent jobs (which combines part-time and full-time work according to practices in each industry). Job creation rates for 1989-99, whether measured using non-farm payrolls or counts of civilian employment based on household surveys, were slow compared to earlier periods. Civilian employment grew at about two-thirds of its rate for 1979-89 and just over half its rate for 1973-79.
In absolute terms, however, job growth continued to be high. Data from the national survey of business establishments shows that employment increased from 89.8 million in 1979 to 107.9 million in 1989 and 128.8 million in 1999. According to the household survey, civilian employment in 1999 was 133.5 million and the civilian labor force was 139.4 million.
Low-wage employment
Examining the national survey of business establishments shows that there was a major shift toward employment in low-paying industries during the 1980s. The shift continued in the 1990s, but at a much slower rate.
The 18.1 million increase in the number of payroll jobs between 1979 and 1989 involved a loss of 1.9 million jobs in manufacturing and mining, an increase of 0.7 million jobs in construction, and an increase of 19.3 million jobs in services. By far, the largest amount of job growth (14.2 million jobs) was in the two lowest-paying service industries – retail trade and services.
Between 1989 and 1999, the U.S. economy created an additional 20.9 million jobs. Job loss continued in manufacturing and mining, but at half its earlier rate as employment in these industries decreased by 1 million jobs. High-paying jobs in construction and in transportation and communication each increased by 1.2 million jobs (2.4 million jobs in all). Retail trade, which is the lowest-paying industry, accounted for 25% of job growth between 1979 and 1989 but only 16% between 1989 and 1999 (4.5 million jobs in the earlier and 3.3 million jobs in the later period). Using the Employment Cost Index to measure total hourly compensation shows that compensation in retail trade averaged $9.92 in 1997. By comparison, overall average hourly compensation for all industries was $17.97, while hourly compensation in manufacturing was $21.84.
As labor markets have tightened, low-wage employment has contributed less to job growth.
Unemployment
The unemployment rate for the U.S. fell to 4.2% for all of 1999, and was 4.0% in July 2000. This is lower than at any point in the last three decades, and is almost as low as the 3.8% achieved in 1967 and the 3.9% experienced in 1947.
Overall unemployment declined from 7.4% in 1992, during the last recession, to the 4.2% of 1999. The unemployment rate for men was 4.1% in 1999 compared with 7.0% in 1992; for women it was 4.3% in 1999 compared with 6.3% in 1992; for blacks it was 8.0% in 1999 compared with 14.1% in 1992, and for Hispanics it was 6.4% in 1999 compared with 11.4% in 1992 (see Table 3).

Underemployment
Underemployment is a broader measure than unemployment of lack of success in the labor market. Underemployment includes unemployed workers as well as (1) those working part time but who want to work full time (“involuntary” part-timers); (2) those who want to work but have been discouraged from searching by their lack of success (“discouraged” workers); and (3) others who are neither working nor seeking work at the moment but who indicate that they want and are available to work and have looked for a job in the last 12 months (“marginally attached” workers). In 1999, 5.9 million people were unemployed, 3.4 million people worked part-time involuntarily, and 1.3 million were discouraged or marginally attached. In all, more than 10.5 million people were underemployed. The underemployment rate was 7.5% in 1999 compared with the unemployment rate of 4.2% (see Table 4).

Nonstandard work arrangements
Three special analyses of nonstandard work arrangements were included in the government’s monthly household survey in 1995, 1997, and 1999. No similar comprehensive data exist for earlier years, although longer time trends exist for some categories of nonstandard work – part-time and temp agency workers.
In 1999, about 75% of all workers held regular full-time jobs, leaving almost 25% of workers in different nonstandard work arrangements, including regular part-time workers, temporary help agency jobs, on-call jobs, independent contractors, and contract firm employees. (These data exclude some categories of self-employed workers, mainly small business owners, who make up about 5.5% of all employment in the U.S.) The share of workers in nonstandard jobs fell as the labor market tightened between 1995 and 1999, from 26.4% of the workforce to 24.8%. Regular part-time employment fell from 16.5% of the workforce in 1995 to 15.5% in 1999, independent contractors fell from 6.7% to 6.3%, and temp agency employment was almost flat over this period despite rapid growth in the 1980s (see Table 5).

Total part-time work includes, in addition to those who are regular part-time workers, those temps, contractors, and the self-employed who work part-time schedules. The proportion of the workforce employed part time (in any kind of work arrangement) rose steadily during the 1960s and 1970s, reaching 17.6% in 1979. Since then, it has remained fairly constant, rising to 18.1% in 1989 and falling to 17.1% in 1999. Involuntary part-time employment has fallen sharply since 1989.
We can also track the growth of employment through temporary help agencies over time. Employment in the personnel services industry, which includes temporary help agencies, increased from 0.3% of the total workforce in 1973 to 2.6% in 1999. In absolute terms, employment in this industry increased from 247,000 to 3.4 million workers. In 1999, 3.0 million of these workers were employed by temporary help agencies.
Self-employment during business cycle peaks has varied between 6.7% and 7.5% of the labor force since 1967. It rose to 8.1% of the workforce in 1992 during the last recession. The rise in self-employment during periods of higher unemployment suggests that self-employment is a refuge from unemployment for workers who are not able to find regular employment.
Many nonstandard jobs provide substandard wages, and most lack health and pension benefits. For example, nearly 60% of temporary workers lack any kind of health insurance compared with less than 18% of regular employees in standard jobs. Less than 12% of temps are eligible for any type of employer-provided pension, compared with 54% of workers in standard arrangements (see Table 6).

Nonstandard workers generally earn less than do workers with similar skills in regular full-time jobs. Controlling for education, years of work experience, and other personal characteristics, most workers in nonstandard jobs earn considerably less than their counterparts in standard work arrangements – women in part-time jobs, temporary agency jobs, or who are self-employed earn between 17% and 25% less than other similar women in regular jobs. These jobs tend to be concentrated in low-paying jobs and industries. The pay penalty appears to be much lower when we control for both workers’ personal characteristics and the characteristics of the jobs they perform (see Table 7).

Wages
Wage growth and benefits
After 15 years of stagnant or declining wages at the middle and bottom of the wage distribution, real wages at all levels grew rapidly between 1995 and 1999. After adjusting for inflation, the median wage for all workers grew 7.3% during 1995-99. For workers at the bottom, wages grew even more rapidly. The real wage of workers in the bottom 10% of the wage range rose a strong 9.3%. The highest-paid workers – those in the top 5% – had wage gains of 8.5%. Workers in the middle experienced the smallest gains during 1995-99 (7.3%); for the entire decade of the 1990s men in the middle actually experienced a fall in real wages of 1.2% despite the rise in their wages during the latter period (see Table 8). Hourly and weekly earnings for production and nonsupervisory workers have now turned up, but are still below their levels in 1979 (see Table 9 and Figure A).


This pattern of wage growth represents a change from past trends in inequality. In the 1990s, the bottom and the middle of the wage distribution grew closer together, while the top continued to pull away from the middle.
The strong wage gains at the bottom result from two forces. The first is the series of legislated changes in the legal minimum wage in 1990, 1991, 1996, and 1997. The second force is the effect of sustained low unemployment, which had a beneficial impact on wages of workers at the bottom, where unemployment fell the most.
Women’s wage rose more rapidly than men’s wages during the 1990s. As a result, the wage gap between men and women narrowed. In 1999, the median woman worker earned 76.9% of what the median man earned, up from 73.1% in 1989 (see Table 10 and Figure B).


Benefits – health insurance and employer-provided pensions – are highly unequal across wage levels. Overall, 63% of workers had employer-provided health insurance in 1998. However, 82% of workers
in the top fifth had such coverage compared with only 30% of workers in the bottom fifth. Fewer than half (49%) of private sector workers had employer-provided pensions in 1999. However, almost three-quarters of workers in the top fifth had pensions compared to less than one in five in the bottom fifth (see Figure C).

Total compensation for union workers substantially exceeds that of non-union workers. Even after controlling for differences in education, work experience, and other personal characteristics of union and non-union workers, union workers’ total compensation is about 28% higher.
The working poor
The minimum wage today is $5.15 an hour, higher than it was in the 1980s. However, this is still less than the wage of $8.19 an hour necessary to allow a worker with two children who is employed full time for the whole year to be above the poverty line. Even after four increases in the federal minimum wage, its inflation-adjusted value was more than 20% lower in 2000 than in 1979. This has contributed to the persistence of large numbers of workers whose wages are not sufficient to pull them out of poverty.
Wage growth since 1995 has reduced the share of workers earning poverty-level wages. Nevertheless, in 1999, more than one in four (26.8%) U.S. workers earned poverty-level wages – less than $8.19 an hour. Women are much more likely to work in poverty-level jobs than men. One in three women earn poverty-level wages, compared with one in five men. Poverty-level work was especially common among racial and ethnic minorities. In 1999, 30% of black men, 41% of black women, 40% of Hispanic men, and 52% of Hispanic women were in jobs that paid poverty wages (see Figure D).

Education and wages
In 1999, 27.2% of workers had a four-year college degree or more. About 10% of the workforce had less than a high school diploma. About one-third had a high school diploma or equivalent, but no further education. Another third had some college, including those who graduated from technical schools or two-year community college programs but had not earned a four-year degree.
Young workers 19 to 25 years of age, especially young high school graduates, were hurt the most by erosion of wages between 1979 and 1995. Among high school graduates, wages of young men fell from $12.19 in 1979 to $8.72 in 1995, while for young women they fell from $9.01 to $7.43. However, entry-level wages increased substantially in the second half of the 1990s. Between 1995 and 1999, real wages of young high school graduates increased by a little more than 6% for both men and women. The recovery in wage growth meant that in 1999, among young high school graduates, men earned $9.72 an hour and women earned $7.89. There is still a long way to go to get back to the wage rates of 1979 (see Figure E).

Entry-level wages among male college graduates were stagnant over the 1973-89 period and fell 9.9% from 1989 to 1995. After growing by 11% between 1973 and 1989, wages of young female college graduates then fell by 5% from 1989 to 1995. However, between 1995 and 1999 among young college graduates, real wages rose 14.9% for men and 9.4% for women. These men now earn $16.74 an hour compared with $16.07 an hour in 1979, while women now earn $14.65 compared with $12.71 in 1979 (Figure E).
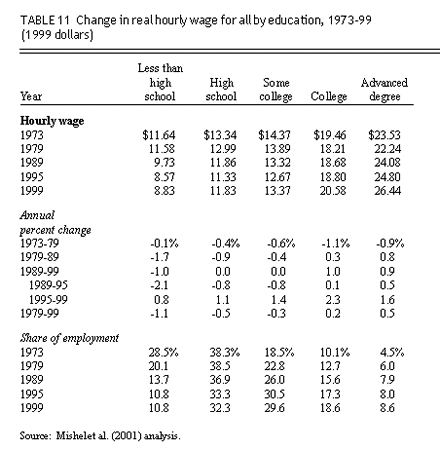
The pattern of wage growth in which there is a rising differential in wages between college-educated workers and less-educated workers has persisted in the 1990s. This is often referred to as a “skill premium” for more skilled workers, but the terminology is somewhat misleading. Wage trends for workers with post-secondary education, but less than a four-year college degree, have followed those of workers with a high school degree. Thus, “less educated” does not refer to the 10% of workers who never earned a high school degree or equivalent but to the nearly three-quarters of the workforce that did not graduate from a four-year college. Through 1995, the growth in the college-non-college premium was due to a sharp drop in the wages of workers with less than a college degree, and not to a rapid increase in the wages of the college educated. Between 1995 and 1999, wages for both groups of workers rose, but those of college educated workers rose more rapidly (see Table 11).
Social insurance and workers
Unemployment insurance (UI)
Unemployment insurance in the U.S. is a federal-state system established in 1935. Its aim was to partially replace lost income for workers who become unemployed, to reduce the dispersal of skilled workers during temporary layoffs, to help maintain aggregate purchasing power during recessions, and to prevent the breakdown of labor standards during such periods. Its focus is on prime-age, full-time workers in periods of economic downturns. It is not well suited to the needs of part-time, part-year, contingent, or self-employed workers.
UI is financed through employer taxes on wages. The UI tax rate on firms varies with a firm’s layoffs. To be eligible, a worker must have worked in UI-covered employment and have earnings that exceed a state-specified minimum that varies across the 50 states. UI provisions vary widely across the states, but all must comply with basic federal regulations. UI, which covered about 80% of full-time permanent wage and salary workers in 1973, covers virtually all such workers today. Some part-time and temporary workers, who meet the specified requirements in the state in which they are employed, are also covered. States usually require at least $1,000 in earnings, with a higher level required for higher benefits. UI will replace up to one-half of lost earnings for up to 26 weeks. In periods of high unemployment, the federal government may institute a temporary program that extends benefits beyond the 26-week period. In 1999, the weekly benefit amount averaged $200. UI generally replaces, on average, one-third of lost wages. During the 1980s and 1990s only about 35% of all unemployed wage and salary workers received UI payments.
The average UI payroll tax was 0.62% in 1998, down from 1.41% in 1978 and 0.90% in 1993. A few states that believe they have sufficient reserves in their UI trust funds have moved to zero tax rates for employers. Accumulated holdings in UI trust funds equaled 1.51% of total payrolls in UI-covered employment in 1998, compared with 1.71% in 1988 and 2.13% in 1973. Trust funds were depleted in the recessions of 1982 and 1991. Total UI benefit payments, which can exceed 0.5% of GDP during periods of recession, were 0.23% of GDP in 1998.
A key federal requirement that states must comply with is that recipients of UI benefits must be “actively seeking work.” Recently, however, the U.S. Department of Labor drafted regulations to allow states to use UI reserves for paying benefits to households in which parents have chosen to take parental or family leave. The Family and Medical Leave Act entitles workers to 12 weeks of leave at the birth or adoption of a child or to take care of a sick family member. However, the leave is unpaid, and many workers cannot afford to take it. These new regulations address that situation and allow states to use their UI funds to provide benefits during such periods of leave. This essentially expands UI to cove
r people who are not actively seeking work. The effect of this change on the UI system’s ability to finance its core activities has not yet been examined (O’Leary 2000).
Earned Income Tax Credit (EITC)
The Earned Income Tax Credit is a credit against federal personal income tax liability. Unlike most other tax credits in the U.S., the EITC is refundable. That is, if the credit exceeds tax liability, the taxpayer receives the difference in cash from the Internal Revenue Service. The credit is available only to the employed, with benefits varying depending on whether the family has zero, one, or two children. The effect is the same as a wage subsidy – for every dollar earned, the credit adds 8, 34, or 40 cents depending on the number of children.
The EITC program presently costs over $30 billion annually, making it the largest entitlement program in the federal budget, aside from health programs and Social Security. For a family with two children, the EITC provides a tax credit of $40 for each $100 in wages earned, up to a maximum of $9,500 in wages. At that point, the family receives the maximum credit of $3,816. For earnings between $9,500 and $12,500, the family continues to receive a tax credit of $3,816. As the family’s earned income rises above $12,500, the tax credit is reduced and is phased out very rapidly. A family with an income greater than $30,850 is no longer eligible to receive the tax credit, no matter how large the number of children.
The maximum benefit for a family with no children under the EITC is $347. It phases out to zero at an income of $10,200. For a family with one child, the maximum benefit is $2,312, which phases out completely at an income of $26,900. For a family with two or more children, the maximum benefit is $3,816, which phases out at an income of $30,850.
Research suggests that the EITC is more effective in moving families over the poverty line than any other government program. Use of the EITC is high, especially compared to other income support programs – 85% of those eligible for the credit apply for it. (This compares with just two-thirds of those eligible for unemployment insurance who apply for it.)
A major reason for the popularity of tax credits such as the EITC over traditional public assistance (“welfare benefits”) is their inherent work incentive. From 1984 to 1996 (before welfare reform became effective), employment rates for single mothers with children increased significantly. Several researchers have demonstrated that the EITC program increases labor force participation, and one study attributes the bulk of the increase in employment rates to repeated expansions of the EITC.
Major reasons for the turnaround
Policy makers and the business press, as well as many economists, point to the “flexibility” of U.S. labor markets as an explanation of the long period of low unemployment enjoyed by the U.S. The argument is that the “deregulated” U.S. labor market has enabled the U.S. economy to adapt to technology shocks more easily than other industrialized economies. The success of the U.S. economy, and the failure of some prominent European countries to match that success, is attributed to the weak bargaining position of American workers – the result of the “employment-at-will” doctrine that allows employers to fire most workers without cause and with little warning, the low rate of union representation, the low levels and short duration of unemployment benefits, the downward flexibility of wages, and the large sector of low-wage and contingent workers.
But, as Dean Baker and John Schmitt (1999) have shown, such microeconomic explanations of differences in unemployment experiences are questionable. While European labor markets clearly have more rigidities than U.S. labor markets, it is not at all evident that they have more rigidities than they did 20 or 30 years ago, or that they have become more rigid relative to the U.S. Indeed, if anything, the U.S. labor market is less flexible today than in the 1970s and 1980s.
As the data on the U.S. labor market presented earlier shows, U.S. employment growth in the current expansion is not based on an increase in the share of part-time and contingent jobs, since these have actually contracted. The U.S. is creating a larger share of regular full-time jobs than it did in 1995. In general, the growth of the low-wage sector of the U.S. economy has moderated substantially in the 1990s compared to the 1980s. Wages at the bottom are rising, and the wage gap between men and women has narrowed.
Moreover, unemployment has been low in the U.S. despite an increase in social regulation of the employment relationship. Prominent examples include passage of the Americans With Disabilities Act (1990), which requires employers to make all reasonable accommodations to employ handicapped or ill workers, and the Family and Medical Leave Act (1993), which entitles workers to 12 weeks of leave at the birth or adoption of a child and to care for sick family members. Legislation constraining employers’ behavior and preventing discrimination has been passed since the 1960s. This includes the Equal Pay Act (1963), the Civil Rights Act (1964 and amended 1972), and the Age Discrimination Act (1967). In addition, legislation was passed to protect workers’ health and safety (the Occupational Safety and Health Act in 1970) and to notify workers of plant closings (Worker Adjustment and Retraining Notification Act of 1988). Finally, the National Labor Relations Board, under the leadership of William Gould for most of the 1990s, has been more favorable to labor’s interests than any board in recent memory.
While rigidities may not have increased in European labor markets relative to the U.S., it is sometimes argued that the underlying economy has changed. As a result, the more rigid labor markets in some European countries make it difficult for these economies to adjust to the spread of information technology and the increase in global competition. The basic argument is that either technology or trade has led to a significant increase in the relative demand for more highly skilled workers and a significant decrease in the relative demand for less-skilled workers. In either case, the decline in the relative demand for less-skilled workers should have led to a fall in the relative wages for the less skilled. As documented above, the U.S. has experienced a large decline in the relative wages of the three-quarters of the workforce without a college degree. In Europe, no similar decline in the wages of less-skilled workers occurred. In the standard view, the failure of relative wages to fall in Europe is the cause of high European unemployment.
However, this sort of relative demand shift explanation is inconsistent with the basic features of European unemployment. If the problem is that wage rigidities are preventing a fall in the relative wages of less-skilled workers, then the rise in unemployment should be concentrated among the less skilled. As discussed earlier in this paper, the ratio of the unemployment rate of less-educated workers to that of college-educated workers in higher in the U.S. than in all OECD countries. Less-educated workers in Europe are actually less likely to be unemployed, relative to better-educated European workers, than are their less-educated U.S. counterparts.
The problem is not that labor market rigidities have raised the relative unemployment rates of less-educated workers in Europe. Rather, it is that some other force appears to have raised the unemployment rate of all workers in some countries relative to rates in the U.S.
The reasons for differences in job creation and employment-to-population ratios between the U.S. and Europe must be sought in macroeconomic policy, in rapid increases in women’s labor force participation, and in organizational developments and participatory decision making that have improved the competitiveness of U.S. companies. The differences cannot be explained by microeconomic argumen
ts about labor market rigidities or relative demand shocks.
Differences in monetary and interest rate policies between the U.S. and Europe are an important part of the story. The moderation of European interest rates during the last two years appears to have ended with the increase in short-term rates by the European Central Bank in September 2000 and hints that further increases may be looming. For much of the last decade, the various European central banks were holding real short-term interest rates in the range of 3.0%-4.0%. That persistently high real interest rates led to slow economic growth and high unemployment should come as no surprise to macroeconomists. In striking contrast, the U.S. Federal Reserve Board, under the leadership of Alan Greenspan, allowed the real interest rate to fall to zero in 1992 and to remain at zero for nearly two full years in response to problems of unemployment and excess capacity. More recently, the U.S. has benefited enormously from the Federal Reserve Board’s willingness to ignore the consensus on the NAIRU (the non-accelerating-inflation rate of unemployment) in the conduct of monetary policy.
In 1994, economists in the U.S. – from moderate liberals like Paul Krugman and Alan Blinder to conservatives like Martin Feldstein and Alan Greenspan – were virtually unanimous in believing that the NAIRU was 6% – that is, that the unemployment rate could not fall much below 6.0% without triggering an inflationary spiral. Fortunately, Alan Greenspan was willing to keep interest rates low, and did not abort the economic expansion with high interest rates as most economists advised. The unemployment rate has now been below 5.5% for more than four years, and below 5% for more than two. Instead of rising, inflation, by every measure, is lower today than it was in 1994. In short, the history of the last few years has completely disproved the accepted view within the economics profession.
At the level of the firm, many U.S. companies – not just high-tech firms in the “new economy” – have adapted to the demands and potential of information technology and globalization by implementing more participatory forms of work organization and decision making. In contrast to the trend toward a disposable workforce, these firms have given workers a stake in the company’s performance by offering employment security and a share of the profits (Appelbaum et al. 2000).
What has been different about the U.S. expansion is its acceleration after the first five years. The initial recovery was not particularly remarkable. After falling in 1991, GDP rose at an average rate of just over 3% through 1996. Unlike most recent recoveries, however, it then picked up steam, averaging over 4% growth through 1999 and growing even more quickly in the last 12 months.
There are five main causes of the “second wind”: (1) the absence of inflationary shocks from outside the economy; (2) the willingness of the Federal Reserve Board to continue to accommodate growth with relatively low interest rates; (3) the stock market bubble and the boom in consumer spending; (4) the feedback effect of growth itself on innovation and on investments in new technology; and (5) adoption of more participatory workplace practices that harness the potential of new technology to improve firm competitiveness.
For much of this long expansion, growth has been driven by a boom in consumer spending. Consumer spending has outstripped the growth in personal disposable income since 1993. Personal savings are at 0.2% of disposable personal income, close to their all-time low, while household debt (even excluding “margin debt” used to finance speculation on the stock exchange) is now nearly 100% of disposable income — an all-time high. Most households are simply running up credit card debt. Richer households are borrowing against the capital gains on their stock market holdings. Relatively low nominal interest rates have accommodated this run-up in personal debt. Despite the increase in household borrowing, debt service — what it costs households each month to make the payments on this debt — has not increased much. Debt payments totaled 13.4% of disposable income, the same as in 1989 and only slightly higher than the 12.8% figure in 1980.
Corporations have been shoring up stock market gains by buying back their own stock. They have been net purchasers of stock, so despite the stock market bubble and the run-up in share prices, stock market gains have not been available to finance investment. Corporations have bought equities and financed investment in new equipment and technology by running up debt as well. Corporate debt has been rising rapidly relative to corporate GDP for the last two-and-a-half years, and reached 74% of corporate GDP by the end of 1999, another record (Godley 2000).
While the growth of consumer spending has moderated recently, investment spending has picked up. Investment now fuels the expansion. Non-residential fixed investment has been growing at a 20% rate in the first half of 2000, led by a surge in investment in equipment and software.
Overall, taking consumption and investment together, private expenditure has risen much more quickly over the 1990s than total output. This has led to an unprecedented event — a large private sector financial deficit. In real terms, this has been possible because of the large deterioration in the U.S. balance of payments. The already large U.S. trade deficit has ballooned over this decade.
Is it sustainable?
The high productivity growth rates achieved in the U.S. during the last two years auger well for the future. Unit labor costs are falling even as wages rise because of the strong growth in labor productivity. However, sustainability of the long U.S. expansion in the face of an acceleration in productivity growth rests on continued strong growth in demand.
The strong private-sector-driven economic expansion during the 1990s has reinforced the sense that government has little to do with economic success. This is wrong on all counts. Product innovation is an important trigger for demand in an economy where most households already own cars, refrigerators, telephones, TVs, VCRs and so on. Government’s role in innovation has often been sold short by entrepreneurs wanting to take full credit for the profits they are reaping. However, as a recent book from the National Academy of Sciences (National Research Council 1999) makes clear, it is government funding of risky investments in research and development that financed the information technology revolution that is behind much recent product and process innovation.
Not only Schumpeterian but Keynesian policies will be necessary to sustain the expansion.
The Federal Reserve Board has raised key interest rates by 1.75 percentage points since June 1999. This has already moderated the rate of residential construction (new housing), and may be having an effect on consumer spending. Further increases in the interest rate pose an immediate threat to the long expansion.
Private sector borrowing probably cannot continue at its current over-heated pace. At some point, the ability of companies and households to repay debt out of current income will place a limit on their capacity to borrow. Should private net saving (of households and businesses) recover to its usual levels over the next few years, growth would be threatened and a recession would be a distinct possibility. The projected budget surplus would disappear. To sustain growth and head off a recession, the government would have to undertake expansionary fiscal policy even as the budget was already moving back into deficit. Preparing now for this likely decrease in private demand in the medium term by increasing long-neglected and much needed capital formation in the public sector is prudent public policy.
Finally, although the U.S. appears to have suspended the law of gravity with respect to its rapidly ballooning trade deficit, this is an issue that will sooner
or later need to be addressed. Slower growth in the U.S. economy could, for example, trigger a major decline in the U.S. stock market and subsequent withdrawal of “hot money.” That, in turn, could trigger a disorderly decline in the exchange value of the dollar. Whatever the scenario, it would be far better for policy makers to address the trade deficit before markets force the correction in the dollar.
The fault lines are clear, and have been so for some time. Whether they will bring an end to the expansion is difficult to predict. What is evident, however, is that monetary, fiscal, and exchange rate policies, as well as policies that promote product innovation and investments in technology and participatory workplace practices, can do much to guarantee that the expansion is sustained.
November 2000
This Briefing Paper is derived from remarks prepared for the German Institute for Labour Market and Occupational Research (IAB), International Labour Market Conference, EXPO 2000, Hannover, Germany, September 5, 2000.
The overview and the first three sections of this paper are taken from the Economic Policy Institute’s forthcoming book, The State of Working America 2000-2001 (Mishel et al. 2001). Further detail and all documentation can be found there. The section on nonstandard work also draws on Nonstandard Work, Substandard Jobs (Rasell et al. 1997); the section on social insurance draws on a proposal by EPI economist Max Sawicky (2000) to reform the EITC; and the section on reasons for the turnaround draws on a paper by EPI economist Christian Weller (2000), a paper by EPI President Jeff Faux (“What Kind of an America Do We Want?” July 2000), and Baker and Schmitt (1999).
References
Appelbaum, Eileen, Thomas Bailey, Peter Berg, and Arne L. Kalleberg. 2000. Manufacturing Advantage: Why High Performance Work Systems Pay Off. Ithaca, N.Y.: Cornell University Press.
Baker, Dean, and John Schmitt. 1999. “The Macroeconomic Roots of High European Unemployment.” Technical Paper. Washington, D.C.: Economic Policy Institute.
Blanchflower, David G. 2000. “Self-Employment in OECD Countries.” Working Paper No. 7486. Cambridge, Mass.: National Bureau of Economic Research.
Freeman, Richard B. 2000. “The U.S. Economic Model at Y2K: Lodestar for Advanced Capitalism?” Working Paper No. 7757. Cambridge, Mass.: National Bureau of Economic Research.
Godley, Wynne. 2000. “Drowning in Debt.” Levy Institute Policy Note. Jerome Levy Institute.
Mishel, Lawrence, Jared Bernstein, and John Schmitt. 2001. The State of Working America 2000-2001. An Economic Policy Institute book. Ithaca, N.Y.: Cornell University Press.
National Research Council. 1999. Funding a Revolution: Government Support for Computing Research. Washington, D.C.: National Academy Press.
O’Leary, Christopher J. 2000. “U.S. Unemployment Insurance: Progress and Prospects.” Employment Research. Kalamazoo, Mich.: Upjohn Institute for Employment Research.
Rasell, Edith, et al. 1997. Nonstandard Work, Substandard Jobs: Flexible Work Arrangements in the U.S. Washington, D.C.: Economic Policy Institute.
Sawicky, Max. 2000. “Giving Tax Credit Where Credit Is Due: A Universal Unified Child Credit That Expands the EITC and Cuts Taxes for Working Families.” Briefing Paper. Washington, D.C.: Economic Policy Institute.
Weller, Christian. 2000. “Business Investment During the Current Business Cycle.” Technical Paper. Washington, D.C.: Economic Policy Institute.
