Briefing Paper #219
Supplemental table: State job losses by Industry [PDF]
The growth of U.S. trade with China since China entered the World Trade Organization in 2001 has had a devastating effect on U.S. workers and the domestic economy. Between 2001 and 2007 2.3 million jobs were lost or displaced, including 366,000 in 2007 alone. New demographic research shows that, even when re-employed in non-traded industries, the 2.3 million workers displaced by the increase in China trade deficits in this period have lost an average $8,146 per worker/year. In 2007, these losses totalled $19.4 billion.1
The impacts of the China trade deficit are not limited to its direct effects on the jobs and wages of those displaced. It is also critical to recognize that the indirect impact of trade on other workers is significant as well. Trade with less-developed countries has reduced the bargaining power of all workers in the U.S. economy who resemble the import-displaced in terms of education, credentials, and skills. Annual earnings for all workers without a four-year college degree are roughly $1,400 lower today because of this competition, and this group constitutes a large majority of the entire U.S. workforce (roughly 100 million workers or about 70% of all workers, Bivens (2008a)). China, with nearly 40% of our non-oil imports from less-developed countries, is a chief contributor to this wage pressure.
In addition to its finding of 2.3 million U.S. jobs lost and workers displaced between 2001 and 2007, this study finds:
- Because U.S. exports to China are much more commodity intensive (i.e., comprising products such as grains, steel scrap, and paper scrap) than Chinese imports (99% of which are manufactured products), average wages earned in jobs producing U.S. exports to China paid 4.4% less than the jobs displaced by imports from China. More than one-fourth of U.S. exports to China on a value basis were commodities.
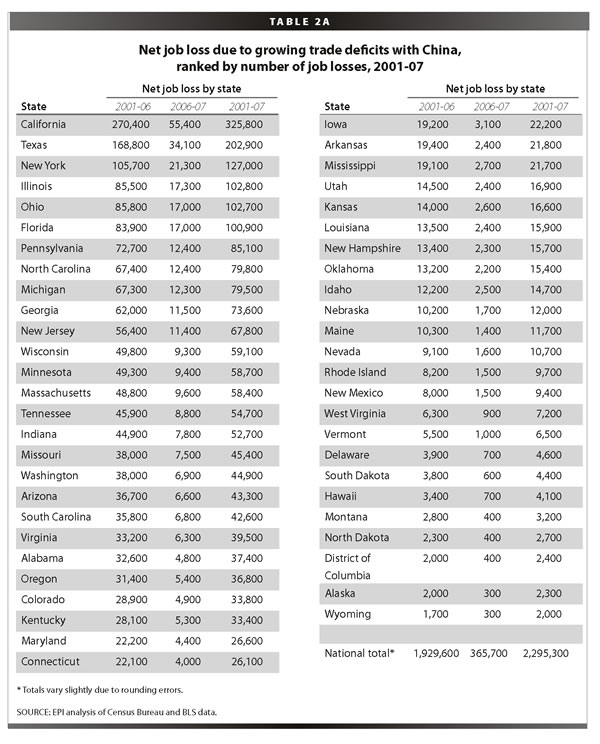
- The 2.3 million jobs lost/workers displaced nationwide since 2001 are distributed among all 50 states and the District of Columbia, with the biggest losers, in numeric terms: California (325,800 jobs lost), Texas (202,900), New York (127,000), Illinois (102,800), Ohio (102,700), Florida (100,900), Pennsylvania (85,100), North Carolina (79,800), Michigan (79,500), and Georgia (73,600).
- In the past year alone, each of these states has also lost more than 10,000 jobs due to growing China trade deficits, including California (55,400 jobs), Texas (34,100), New York (21,300), Illinois (17,300), Ohio (17,000), Florida (17,000), Pennsylvania (12,400), North Carolina (12,400), Michigan (12,300), and Georgia (11,500). Many of these are among the hardest-hit states in the current labor market downturn.
- The hardest-hit states, as a share of total state employment, are Idaho (14,700, 2.59%), New Hampshire (15,700, 2.5o%), South Carolina (42,600, 2.34%), Oregon (36,800, 2.29%), California (325,800, 2.23%), Minnesota (58,700, 2.18%), Vermont (6,500, 2.15%), Texas (202,900, 2.13%), and Wisconsin (59,100, 2.10%).
- Rapidly growing imports of computers and electronic parts accounted for almost half of the $178 billion increase in the U.S. trade deficit with China between 2001 and 2007. The $68 billion deficit in advanced technology products with China in 2007 was responsible for more than 25% of the total U.S.-China trade deficit. The growth of this deficit eliminated 561,000 U.S. jobs in computer and electronic products in this period. Other hard-hit industrial sectors include apparel and accessories (153,000 jobs), miscellaneous manufactured goods (134,000), and fabricated metal products (102,000); several service sectors were also hard hit by indirect job losses, including administrative support services (139,000) and professional, scientific, and technical services (128,000).
- More than two-thirds of the jobs displaced by China trade deficits were in manufacturing, which tends to employ a higher-than-average share of workers with a high school degree or less (43.7% of workers displaced) and to provide those workers with good wages and benefits. More than half (55.6%) of the jobs displaced came from the top half of the U.S. wage distribution, and among this group a disproportionate share came from the top 10th of all U.S. wage earners. African Americans (230,000 jobs lost), Hispanics (339,000), and other ethnic groups (219,000) all suffered from the loss of jobs such as these that pay substantially more and offer better benefits than jobs in other industries.
A major cause of the rapidly growing U.S. trade deficit with China is currency manipulation. China has tightly pegged its currency to the dollar at a rate that encourages a large bilateral surplus with the United States. Maintaining this peg required the purchase of about $460 billion in U.S. treasury bills and other securities in 2007 alone.2 This intervention makes the yuan artificially cheap and provides an effective subsidy on Chinese exports. The best estimates place this effective subsidy at roughly 30%, even after recent appreciation in the yuan(Cline and Williamson 2008).3
China also engages in extensive suppression of labor rights. An AFL-CIO study estimated that repression of labor rights by the Chinese government has lowered manufacturing wages by 47% to 86% (AFL-CIO 2006, 138). China has also been accused of massive direct subsidization of export production in many key industries (see, e.g., Haley 2007). Finally, it maintains strict, non-tariff barriers to imports. As a result, China’s exports to the United States of $323 billion in 2007 were more than five times greater than U.S. exports to China, which totaled only $61 billion (Table 1). China’s trade surplus was responsible for 52.3% of the U.S. total non-oil trade deficit in 2007, making the China trade relationship this country’s most imbalanced by far. Unless China raises the real value of the yuan by an additional 30% and eliminates these other trade distortions, the U.S. trade deficit and job losses will continue to grow rapidly in the future.
While the overall U.S. trade deficit improved significantly in 2007, largely as a result of the 30% decline of the dollar against major currencies since 2002 (including a 44% fall against the euro), the U.S. deficit with China increased $26.6 billion, in large part because China allowed the dollar to fall only 12% against the yuan between 2002 and 2007. The annual increase in the U.S.-China trade deficit slowed from $31.6 billion in 2006 to $26.7 billion in 2007, reflecting both a decline in U.S. GDP growth (reducing import demand) and the initial effects of the stronger yuan. However, yuan appreciation was largely delayed until late 2007 and 2008—too little and too late to be of any help in slowing the current U.S.-China trade gap to date.4 Furthermore, the appreciation of the yuan has had little effect on the prices of U.S. imports from China, which rose only 2.5% between July 2005 (when the yuan was first adjusted) and May 2008, much less than the 19% appreciation of the yuan in that period (Congressional Budget Office 2008, 2).
C
hina’s entry into the WTO was supposed to bring it into compliance with an enforceable, rules-based regime which would require that it open its markets to imports from the United States and other nations. The United States also negotiated a series of special safeguard measures designed to limit the disruptive effects of surging Chinese imports on domestic producers. However, the core of the agreement failed to include any protections to maintain or improve labor or environmental standards and, prior to 2007, the administration rejected all requests for special safeguards protection. As a result, China’s entry into the WTO has further tilted the international economic playing field against domestic workers and firms and in favor of multinational companies from the United States and other countries as well as state- and privately owned exporters in China. This shift has increased the global “race to the bottom” in wages and environmental quality and closed thousands of U.S. factories, decimating employment in a wide range of communities, states, and entire regions of the United States. U.S. national interests have suffered while U.S. multinationals have enjoyed record profits on their foreign direct investments (Scott 2008).
False promises
Proponents of China’s entry into the WTO frequently claimed that it would create jobs in the United States, increase U.S. exports, and improve the trade deficit with China. President Clinton claimed that the agreement allowing China into the WTO, which was negotiated during his administration, “creates a win-win result for both countries” (Clinton 2000, 9). He argued that exports to China “now support hundreds of thousands of American jobs” and that “these figures can grow substantially with the new access to the Chinese market the WTO agreement creates” (Clinton 2000, 10). Others in the White House, such as Kenneth Liberthal, the special advisor to the president and senior director for Asia affairs at the National Security Council, echoed Clinton’s assessment:
Let’s be clear as to why a trade deficit might decrease in the short term. China exports far more to the U.S. than it imports [from] the U.S….It will not grow as much as it would have grown without this agreement and over time clearly it will shrink with this agreement.5
Promises about jobs and exports misrepresented the real effects of trade on the U.S. economy: trade both creates and destroys jobs. Increases in U.S. exports tend to create jobs in the United States, but increases in imports will lead to job loss—by destroying existing jobs and preventing new job creation—as imports displace goods that otherwise would have been made in the United States by domestic workers.
The impact of changes in trade on employment is estimated here by calculating the labor content of changes in the trade balance—the difference between exports and imports. Each $1 billion in computer exports to China from the United States supports American jobs. However, each $1 billion in computer imports from China displaces the American workers who would have been employed making them in the United States. On balance, the net employment effect of trade flows depends on the growth in the trade deficit, not just exports.
Another critically important promise made by the promoters of liberalized U.S.-China trade was that the United States would benefit because of increased exports to a large and growing consumer market in China. However, despite widespread reports of the rapid growth of the Chinese middle class, this growth has not resulted in a significant increase in U.S. consumer exports to China. The most rapidly growing exports to China are bulk commodities such as grains, scrap, and chemicals; intermediate products such as semiconductors; and producer durables such as aircraft (see Table 3 below). Furthermore, the increase in U.S. exports to China since 2001 has been overwhelmed by the growth of U.S. imports, as shown below.
Growing trade deficits and job losses
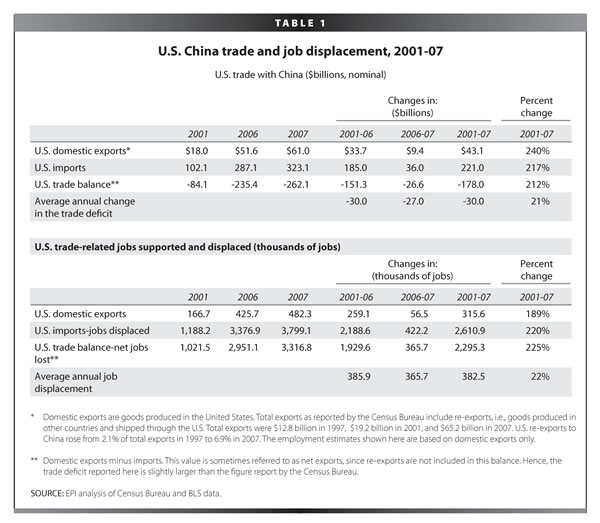
The U.S. trade deficit with China has risen from $84 billion in 2001 to $262 billion in 2007, an increase of $178 billion, as shown in Table 1. Since China entered the WTO in 2001, this deficit has increased by $30 billion per year on average, or 21% per year.
While it is true that exports support jobs in the United States, it is equally true that imports displace them. The net effect of trade flows on employment is determined by changes in the trade balance.6 The employment impacts of growing trade deficits are estimated in this paper using an input-output model that estimates the direct and indirect labor requirements of producing output in a given domestic industry. The model includes 201 U.S. industries, 84 of which are in the manufacturing sector.7
The model estimates the amount of labor (number of jobs) required to produce a given volume of exports and the labor displaced when a given volume of imports is substituted for domestic output.8 The net of these two numbers is essentially the jobs lost due to growing trade deficits, holding all else equal.
Jobs displaced by the growing China trade deficit are a net drain on employment in trade-related industries, especially those in the manufacturing sector. Even if increases in demand in other sectors absorb all the workers displaced by trade (an unlikely event), it is likely that job-quality will suffer, as many non-traded industries such as retail trade and home health care pay lower wages and have less comprehensive benefits than traded goods industries.
U.S. exports to China in 2001 supported 166,700 jobs, but U.S. imports displaced production that would have supported 1,188,200 jobs, as shown in the bottom half of Table 1. Therefore, the $84 billion trade deficit in 2001 displaced 1,021,500 jobs in that year. Job displacement rose to 2,951,100 jobs in 2006 and 3,316,800 in 2007.
Since China’s entry into the WTO in 2001 through 2007, the increase in U.S.-China trade deficits eliminated or displaced 2,295,300 U.S. jobs, as shown in the bottom half of Table 1. In the past year alone 365,700 jobs were lost, either through the destruction of existing jobs or by the prevention of new job creation. On average, 382,500 jobs per year have been lost/displaced since China’s entry into the WTO.
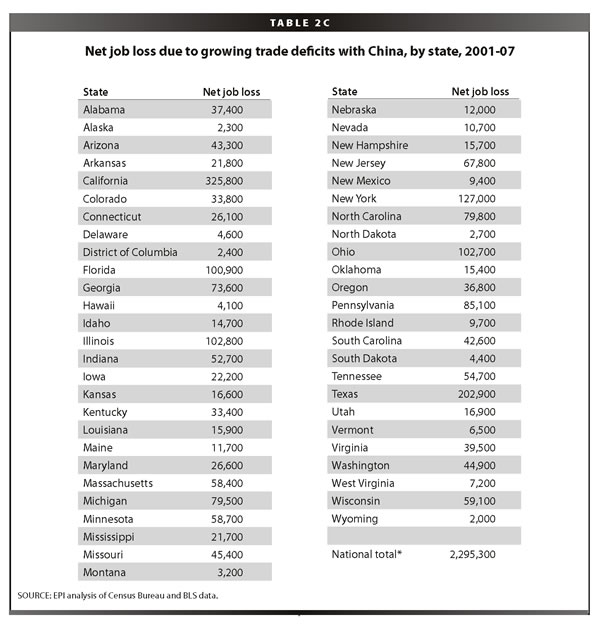
Growth in trade deficits with China has reduced demand for goods produced in every region of the United States and has led to job displacement in all 50 states and the District of Columbia, as shown in Table 2A. More than 200,000 jobs were lost in each of California and Texas and more than 100,000 each in New York, Illinois, Ohio, and Florida. Jobs displaced due to growing deficits with China exceeded 2.0% of total employment in 12 states including Idaho, New Hampshire, South Carolina, Oregon, California, Minnesota, Vermont, Texas, and Wisconsin, as shown in Table 2B and Figure A. An alphabetical list of job losses by state is shown in Table 2C.


The state job loss map shows that the effects of growing trade deficits with China have been felt widely across the United States and that no area has been exempt from impact. While traditional manufacturing states such as Wisconsin, Tennessee, and the Carolinas were certainly hard hit, so too were states in the tech sector such California, Texas, Oregon, and Minnesota. Idaho, which lost an estimated 9,000 jobs in computer and electronic products alone, was the hardest-hit s
tate in the country in terms of share of total state employment, as shown in Table 2B.
Growing trade deficits with China have clearly reduced domestic employment in traded goods industries, especially in the manufacturing sector, which has been hard hit by plant closings and job losses. Workers displaced by trade from the manufacturing sector have had particular difficulty in securing comparable employment elsewhere in the economy. More than one-third of workers displaced from manufacturing dropped out of the labor force (Kletzer 2001, 101, Table D2), and average wages of those who secured re-employment fell 11% to 13%.
Some economists have argued that job loss numbers extrapolated from trade flows are uninformative because aggregate employment levels in the United States are set by a broad range of macroeconomic influences, not just by trade flows. However, while the trade balance is but one of many variables affecting aggregate job creation, the employment impacts of trade identified in this paper can be interpreted as the “all else equal” effect of trade on domestic employment. The Federal Reserve, for example, may decide to cut interest rates to make up for job loss stemming from deteriorating trade balances (or any other economic influence), leaving net employment unchanged. This, however, does not change the fact that trade deficits by themselves are a net drain on employment.
Further, even in the best-case scenario in which other jobs rise up one-for-one to replace those displaced by trade flows, the job numbers in this paper are a (conservative) measure of the involuntary job displacement caused by growing trade deficits and a potent indicator of imbalance in the U.S. labor market and wider economy. Economists may label it a wash when the loss of a hundred manufacturing jobs in Ohio or Pennsylvania is offset by the hiring of a hundred construction workers in Phoenix, but in the real world these displacements often result in large income losses and even permanent damage to workers’ earning power (Bivens 2008b).
Trade and jobs, industry details
The composition of imports from China is changing in fundamental ways, with serious implications for certain kinds of high-skill, high-wage jobs once thought to be the hallmark of the U.S. economy. China is moving rapidly “upscale,” from low-tech, low-skilled labor-intensive industries such as apparel, footwear, and basic electronics to more capital- and skills- intensive sectors such as computers, electrical machinery, and motor vehicles; it has also developed a rapidly growing trade surplus in high technology products.
U.S. trade with China in 2001 and 2007 is summarized in Table 3. Trade flows increased dramatically in this period, especially imports, which rose from $102 billion in 2001 to $323 billion in 2007.9 Manufactured goods were 99% of total imports and included a wide array of commodities. Computer and electronic products were responsible for more than one-third of total imports in 2007, including computer equipment ($45 billion, or 13.8%), communications equipment ($25 billion, 7.9%) and audio-video gear ($19 billion, 5.9%). Other major importing sectors included apparel ($26 billion, 8.2%), and miscellaneous manufactured products ($42 billion, 13.0%).
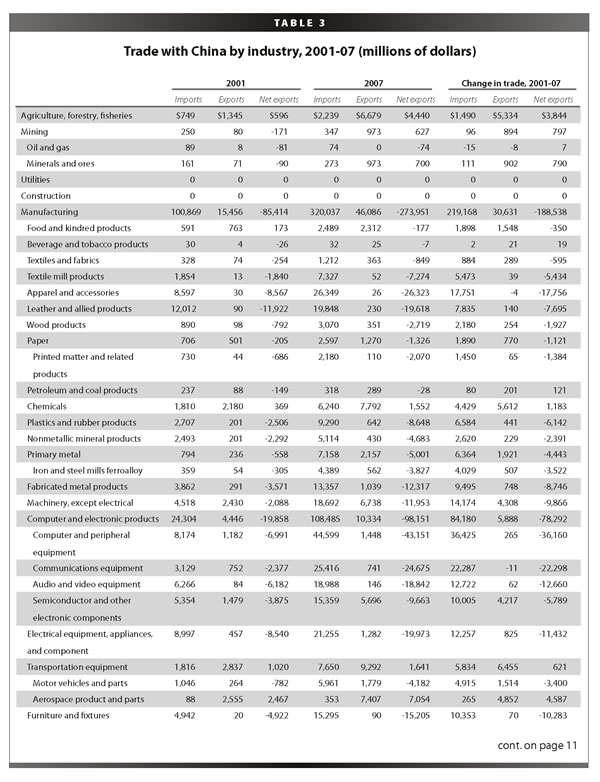
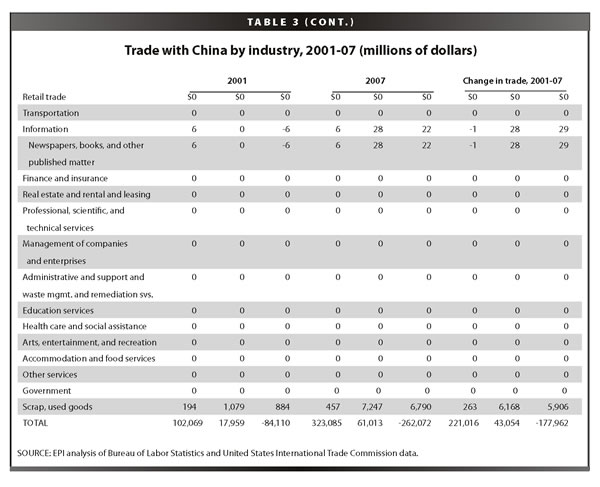
U.S. exports rose rapidly in this period, but from a much smaller base, from $18 billion in 2001 to $61 billion in 2007. Manufacturing was the top industry exporting to China—76% of exports to China in 2007 were manufactured goods. Scrap and second-hand goods industries (that support no jobs in the BLS models) made up 11.9% of the total. Within manufacturing, key export sectors included chemicals ($7.8 billion, or 12.8% of total exports), aerospace products and parts ($7.4 billion, 12.1%), machinery ($6.7 billion, 11.0%), and semiconductors and components ($5.7 billion, 9.3%). However, the scale of U.S. exports is dwarfed by imports, which exceeded the value of exports by more than 5-to-1.
The data in Table 3 show that China is rapidly diversifying its export base and expanding into higher value-added commodities such as computer and electronic products, aircraft, and auto parts and machinery. This point is highlighted in Table 4, which reports U.S. trade in advanced technology products (ATP) in 2002 (the earliest date for which country-by-ATP data are available) and 2007. The United S has had a trade deficit with China in ATP products throughout this period, but it increased nearly six-fold, from $11.8 billion to $67.7 billion, by 2007.
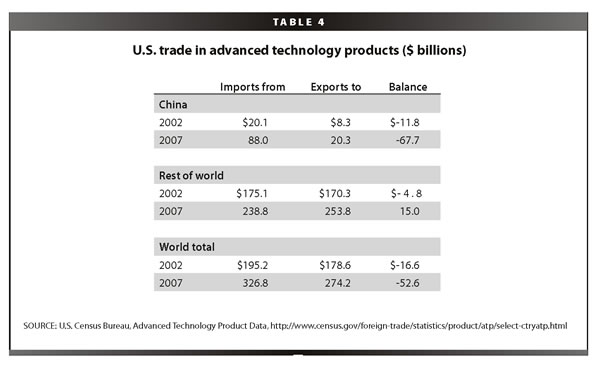
The United States had a deficit in its ATP trade with the rest of the world in 2002. However, rapid growth of U.S. ATP exports to the rest of the world, which increased 8.3% per year over the past five years, generated a $15 billion surplus in 2007. This sector is enjoying some trade success at the moment. However, this small surplus was completely overwhelmed by the U.S. ATP deficit with China in 2007. As a result, the United States ran an overall deficit in ATP products in 2007, as is has in every year since 2002.
Trade deficits are highly correlated with job losses by industry, as shown in Table 5. Growing trade deficits with China eliminated 1,550,000 manufacturing jobs between 2001 and 2007, more than two-thirds (67.5%) of the total. By far the largest job losses occurred in the computer and electronic products sectors, which lost more than 560,000 jobs (24.4% of the 2.3 million jobs lost overall). This sector included computer and peripheral equipment (274,800 jobs, 12.0%) and semiconductors and components (130,900 jobs, 5.7%). Other hard-hit sectors included apparel and accessories (153,000 jobs, 6.7%), fabricated metal products (102,400 jobs, 4.5%) and miscellaneous manufacturing (133,600 jobs, 5.8%). Several service industries, which provide key inputs to traded goods production, experienced large job losses, including administrative and support services (138,700 jobs, 6.0%) and professional, scientific, and technical services (127,700 jobs, 5.6%). (Additional detail on trade-related displacement by state and major industry is available online at www.epi.org/content.cfm/bp219supp.)
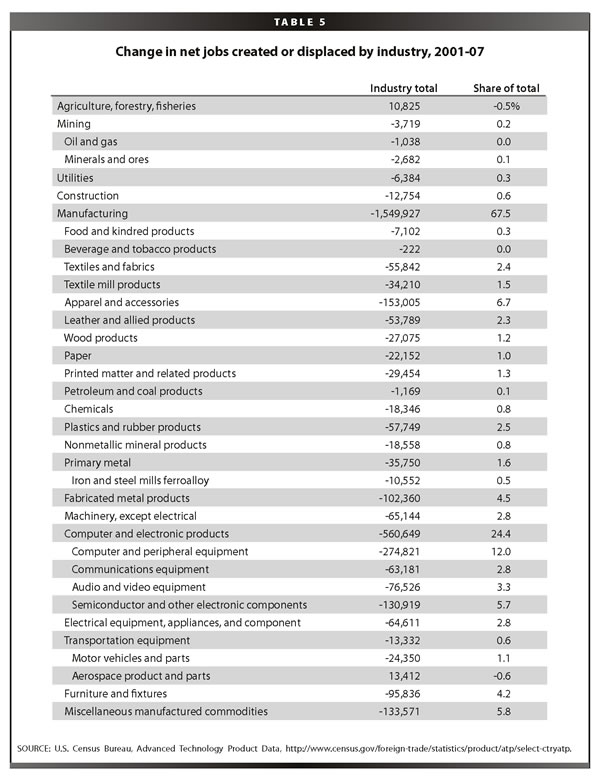
California lost 135,929 jobs in computer and electronic parts alone due to growing trade deficits with China between 2001 and 2007. Other examples of large impacts include apparel in California (44,072 jobs), New York (22,785), and North Carolina (11,372); textiles and textile mill products in Georgia (19,671) and South Carolina (10,055); and computer and electronic products in Idaho (8,969), Minnesota (22,882), New Jersey (15,034), New York (23,018), Ohio (13,988), Oregon (15,427), and Texas (90,414).
Trade, wages, and labor force demographics
The growth of trade deficits with China shifts jobs from better-paid traded goods industries into jobs in non-traded sectors where wages are significantly lower on average. Moreover, average wages in import-competing industries were higher than those in export industries. Thus, the growth in the overall volume of trade (imports plus exports) with China substituted lower-paying export jobs for higher-paying jobs in import-competing industries. This somewhat surprising finding stands economic logic on its head. Economic theory would suggest that the United States should specialize in producing goods that intensively use high-skilled, highly educated (and highly paid) workers and import labor-intensive goods that use more low-skilled labor. In fact, low-wage commodity sectors were some of the largest exporters of goods fr
om the United States to China.
This section analyzes the effects of changing trade flows with China on wages and the worker characteristics of those affected by growing trade deficits. This analysis is based on a pooled sample of data from the BLS Current Population Statistics Outgoing Rotation Group (CPS ORG), a subset of the March CPS monthly survey (U.S. Census Bureau 2008). The data were pooled for the three-year 2005-07 period to achieve adequate sample size for this analysis. The data covered approximately 126 million full-time, public and private sector workers age 16 and above in a set of CPS industries that were matched to the BLS industries used in the trade and job displacement analysis described above.10 Average wages by sector were used to estimate average import and export wages, and trade-related jobs lost by industry were used as weights.
The results of the wage analysis are summarized in Table 6A. The first column shows average wages for import and export industries in 2007,11 and the second column compares the percent difference between import and export wages for U.S. trade with China. One of the most important findings in this study is that, for trade with China, average wages in exporting industries, at $839.32 per week, were lower than in import-competing industries, where they were $877.76 per week—a 4.4% premium.12
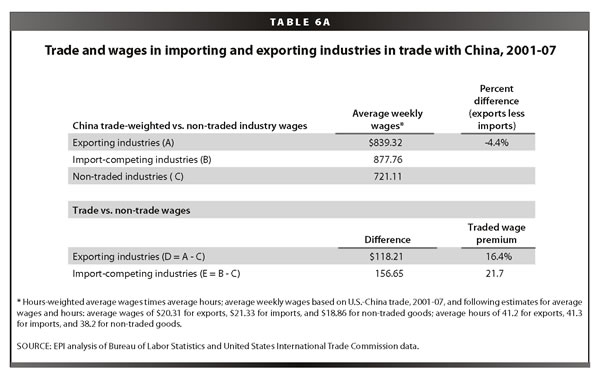
Wages in industries producing goods traded with China are also significantly higher than those in the rest of the economy. Wages in export and import-competing industries were 16.4% to 21.7% higher than average wages in other non-traded industries, as shown in the last 2 rows of Table 6A. Average wages in all non-traded goods industries were $721.11 in the pooled 2005-07 period.
The growth of trade deficits with China implies that, even with near-full employment in 2007, more workers were employed in other, non-traded sectors of the economy than would have been if U.S. trade with China were balanced, and that total payments to affected workers were lower than they would otherwise have been for two reasons. First, as trade expanded, jobs displaced by imports paid more than export jobs paid, so U.S. workers lost wages on every job gained through increased exports. Second, the growth in the trade deficit reduced the demand for labor in trade-goods industries, and, at full employment, those workers were employed in other sectors where, on average, they earned much lower wages.
Total wage gains and losses for all trade-affected jobs are estimated in Table 6B. The jobs gained due to growing exports, jobs lost due to growing imports, and net job loss between 2001 and 2007 are shown in the top section of the table. The growth of exports to China generated total wage premiums of $1.9 billion in this period (i.e., $118.21 per job per week times 315,600 export jobs gained times 52 weeks), while the growth of imports eliminated wage premiums of $21.3 billion in this period. Thus, there was a nationwide loss of $19.4 billion in wage premiums that would have been earned had trade been balanced. Each full-time worker of the 2.3 million displaced by the increase in “net” imports from China, even when re-employed in non-traded industries, lost an average $8,146 per worker/year ($156.65 per week times 52 weeks).
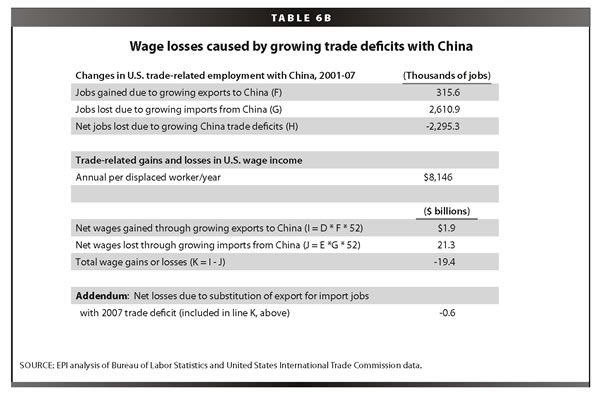
Net losses associated with the pure substitution of export jobs for import job opportunities for trade with China equaled $0.6 billion, as shown in the last line of Table 6B. These losses offset some of the gains from trade with China (from specialization in products for which the United States has a comparative advantage) that are found in most economic models of the benefits of trade.
But lost jobs and lower wages for displaced workers are just the tip of the iceberg. Competition with low-wage workers from less-developed countries has also driven down wages for workers in manufacturing and reduced the wages and bargaining power of similar workers throughout the economy—essentially all production workers with less than a four-year college degree, or 70% of the private sector workforce (roughly 100 million workers). For a typical full-time median-wage earner in 2006 these indirect losses totaled approximately $1,400 (Bivens 2008a). China is the most important source of downward pressure from trade with less-developed countries, because its workers receive very low wages, and because it was responsible for nearly 40% of U.S. non-oil imports from less-developed countries in 2007.
Demographic impact of growing trade deficits
The models used in this study also allow an examination of the effects of growing China trade deficits on different demographic groups in terms of education, wage distribution, and race.13
Education
Workers with a high school degree or less have been particularly hard hit by rising China trade deficits. The manufacturing sector, which produces most traded goods, employs a much higher-than-average share of such workers, as shown in Table 7, which details educational status and wage levels for all industries (i.e., all 125 million workers in the sample), manufacturing, and computers/electronic equipment. Workers with a high school degree or less made up 41.1% of the population overall, but they made up 50.8% of the manufacturing labor force.
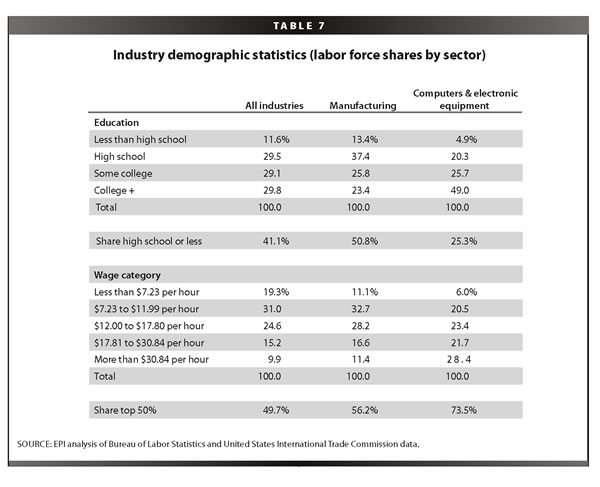
Manufacturing and trade-related jobs also pay well. Table 7 breaks down wages into five broad categories: the first group represents roughly the bottom two deciles (20%) of the labor force, and the second includes the next three deciles (totaling about 30%). The next three groups represent the top half of all jobs, or the best-paying jobs in the U.S. labor market, including the 50-75th percentile ($12.00 to $17.80), the 75-90th ($17.81 to $30.84 per hour) and the top decile, where wages exceed $30.84 per hour. Note that substantially more than half of the jobs in manufacturing (56.2%) were in this top half of the wage distribution, and the manufacturing share in each of the top three categories exceeded the national average.
Thus, manufacturing provided more good jobs for more workers with a high school degree or less than did the other sectors of the economy as a whole. The computer and electronics sectors stand out for other reasons, and we return to these below.
The number and shares of workers at different levels of education who were displaced by growing trade deficits with China between 2001 and 2007 are shown in columns 2 and 3 of Table 8; column 4 compares these shares to the breakdown of the labor force overall (column 1). For example, growing trade deficits displaced 1.3% more workers with less than a high school degree and 1.3% more workers with a high school degree (but no more) compared with their share of the labor force. Workers with some college or more took a proportionately smaller hit, as those workers tend to be less intensively employed in traded goods than employed in the rest of the economy.
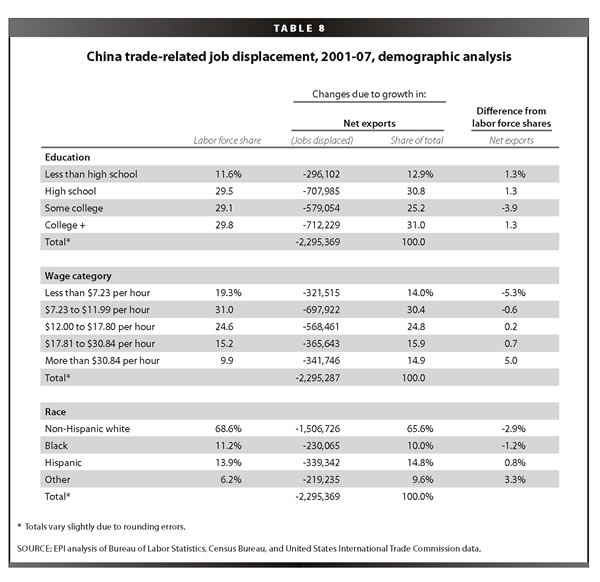
Workers with a college degree were also hard hit: they absorbed 31.0% of the jobs lost due to growing trade deficits with China while making up only 29.8% of the labor force. This result may seem surprising at first glance, since college-educated workers make up a much smaller share of the labor force in manufacturing (23.4%) than in the economy as a whole (29.8%), as shown in Table 7. However, the numbers in Table 8 also reflect the extremely uneven patterns of trade and job displacement by industry, discussed above. The computer and electronic products sector lost 561,000 jobs, 24.4% of all jobs displaced due to growing trade deficits (Table 5), and this high-tech
sector employs a much larger share (49.0%) of college graduates than does manufacturing (23.4%) or the economy as a whole (29.8%), as shown in Table 7. As a result, this sector has many more workers in the top wage half (73.5%) and top wage decile (28.4%) compared to the economy overall.
It is important to note that the results in Table 8 are purely the result of between-industry shifts in trade-related employment. Trade is also changing the composition of employment within industries. Though such within-industry shifts cannot be assessed in this report, they may mitigate some of the job losses among highly educated workers in computer and electronic products that are implied in these estimates. Bivens (2008a) presents evidence and analysis and reviews literature showing that trade has increased the demand for college-educated labor within certain industries. This analysis suggests that trade within sectors such as computer and electronic products likely involves substantial “vertical specialization” in production, with labor-intensive activities such as computer assembly being shifted abroad while more skill and capital-intensive activities such as semiconductor design and production of advanced integrated circuits are taking place in the United States. Such within-industry shifts can increase the demand for college-educated labor at home, relative to demand for workers with less education.
Workers who perform labor-intensive activities in industries like computer equipment used to benefit from their association with a high-wage industry. While non-college-educated workers in labor-intensive industries like apparel were heavily exposed to foreign competition, non-college workers in computer assembly held on for a while and were sheltered from the most intense forms of international competition. Now that globalization has allowed for vertical integration and slicing up even intra-firm value chains, this benefit no longer holds, and the non-college part of the value chain in every industry has been sent abroad (including China). This has given the global economy (and China) a much longer lever with which to impact the U.S. labor market. (If China’s influence had, say, been capped by the share of apparel expenditures in the U.S. economy, it would have had a much smaller impact on U.S. jobs and wages.)
Data on occupational employment trends shed further light on within- and between-industry employment shifts. For U.S. manufacturing as a whole, total employment of scientists and engineers (S&E) fell sharply between 2001 and 2007, though not quite as fast as total manufacturing employment. Total S&E employment in manufacturing fell from 1.9 million to 1.7 million workers in this period, a decline of 10.7%.14 Employment of all manufacturing workers fell from 17.3 to 15.0 million workers, a decline of 13.2%. Thus, the S&E employment share within manufacturing rose from 10.9% to 11.2%. These data suggest that rapidly growing trade deficits with China and other countries caused a fall in demand for S&E workers that overwhelmed any gains from within-industry shifts or gains from vertical specialization.15 However, the fact that workers with less education suffered greater employment losses means that growing trade deficits did put relatively greater downward pressure on their wages.
The education results in Table 8 are markedly different from those for trade with Mexico and Canada after NAFTA took effect. Scott (2006, Table 1-5, 16) performed a similar demographic analysis of the effects of NAFTA trade between 1993 and 2004. Workers with a high school degree were especially hard hit by growing trade deficits after NAFTA, and this grouped absorbed 51.5% of job losses while making up only 42.9% of the labor force. Workers with a college degree absorbed only 22.0% of the job losses due to growing NAFTA deficits, 5.5% less than their share in the total labor force.16 Thus, China trade displaced significantly more workers with a college degree than NAFTA trade. This is particularly remarkable since more than half of NAFTA trade was with Canada, which has an advanced industrial economy (Scott 2006, Table 1-1a, 5).
Overall, wages in traded-goods industries were significantly higher than in non-traded industries, as shown in Table 6A. Workers with a high school degree and below are particularly hard hit by growing trade deficits with China, because larger-than-average shares of these workers are pushed out of high-wage jobs in traded-goods industries.
Within manufacturing in particular, 50.8 % of workers have a high school degree or less, while such workers made up only 41.1 % of the labor force as a whole (Table 7). Hence, the manufacturing sector employs about a quarter more of these workers than other sectors of the economy. As noted above, more than two-thirds of the jobs displaced by growing trade deficits with China were in manufacturing, which is one of the best sources of good jobs with good benefits for workers with a high school degree or less.
Wages
Table 8 compares the impact of China trade by wage category in the same way as it did for education level, that is, by contrasting the share of displaced jobs at each wage level to share of all workers earning this particular wage. Growing China trade deficits displaced fewer jobs on a proportional basis in the two lowest-paying wage groups (those earning $11.99 per hour or less) and more jobs at higher wage levels. The largest losses, on a proportional basis, were absorbed by workers in the top wage group, who earned more than $30.84 per hour; their share of net job displacement was 14.9%, 5.0 percentage points more than their share of the labor force (9.9%). These results re-enforce the findings in Table 6, which showed that jobs displaced by growing trade deficits pay more than other jobs.
Manufacturing has higher productivity than other sectors of the economy (U.S. Department of Labor 2008) and higher unionization rates (U.S. Department of Labor 2006b), allowing workers to earn a higher share of the higher marginal product of their labor in this sector. More than two-thirds of the jobs displaced by China-trade were in manufacturing (Table 5, above), many of them high-wage, unionized jobs that are in increasingly scarce supply. Many of those workers were displaced into lower-paying jobs outside of manufacturing.
One reason that productivity growth is so high in manufacturing is that it is a relatively large employer of scientists and engineers. Even though fewer college graduates are employed in manufacturing overall, it employs a much higher share of scientists and engineers than other sectors. In 2007, 1.7 million scientists and engineers were employed in manufacturing, or 11.2% of total manufacturing employment.17 This share is one-and-a-quarter times the 5.0% share of such workers in non-manufacturing industries. It is likely that many of these workers are employed in computer and electronic products, and that many more science and engineering jobs would be created if U.S. trade with China in these products were more balanced.
Race
The share of black workers displaced by China trade (10.0%, Table 8, column 3) was slightly less than their average share in the labor force (11.2%), and for Hispanic workers the share was only slightly more. At first glance, then, the racial impact may appear relatively benign, but this observation changes when one compares it to the lesser displacement among (non-Hispanic) whites. Moreover, the real losses for black workers and Hispanics can be assessed only through an examination of the absolute number of jobs lost and a closer look at what they mean for these workers.
Growing trade deficits displaced 230,065 black workers and 339,342 Hispanics. These jobs are even more important to African Americans and Hispanics than to other workers, for reasons illustrated in Table 9, which reports additional population statistics on education and wages by race for all workers. These data reflect the fai
lure of the U.S. educational system to serve black and Hispanic minorities. Among black workers, 46.0% have a high school degree or less, 10 percentage points or 27.5% more than for white workers. For Hispanics, the situation is even worse, 65% having no more than a high school education, 29 percentage points or nearly double the rate of white workers.
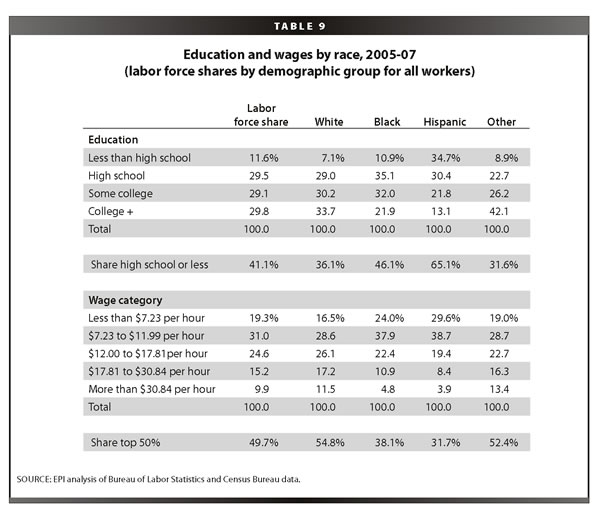
The consequences of discrimination and lack of educational attainment for workers’ wages are illustrated in the bottom half of Table 9. Only 38.1% of black workers earn wages in the top 50%, as compared to 54.8% of white workers, and only 31.7% of Hispanics are in the top half of wage earners. The contrast is even starker in the top decile. Only 4.8% of all blacks earned more than $30.84 per hour in 2005-07, and only 3.9% of Hispanics. However, 11.5% of white workers were in this top-decile group, shares 140% larger than blacks and 192% larger than Hispanics.
The full implications of job losses for blacks and Hispanics can only be appreciated by comparing Tables 7 and 9. Table 7 showed that manufacturing (which absorbed more than two-thirds of job losses caused by growing trade deficits with China) provided nearly 25% more jobs for high-school-educated workers than did other sectors of the economy, and 13% more of those jobs were in the top half of the wage distribution. Thus, the manufacturing sector provides some of the best jobs available for black and Hispanic workers, who suffer from much lower levels of education and have much lower wages than white workers. Growing China trade deficits are a special tragedy for these workers, who lost more than half a million trade-related jobs between 2001 and 2007 alone.
What is not well understood is that even a job lost in apparel production can be a huge loss for a minority or immigrant worker. Such jobs are more likely to be unionized and to have benefits than alternative jobs outside of manufacturing. A job paying $9 or $10 per hour with benefits, and providing industrial experience, can be a lifeline and provide a ladder out of poverty for such workers. When this worker loses his or her job and the alternative is a near-minimum wage, non-union job, an important pathway out of poverty is washed away.18
The “other” workers shown in Tables 8 and 9 are largely Asians. They outperformed all other groups of workers in terms of education and wages, as shown in Table 9. However, they also lost a relatively large number of jobs (219,235 or 9.6% of all jobs lost), a share 53% greater than their share in the total labor force. These findings likely reflect the confluence of two factors: the very high share of Asian and other minorities with more than a college degree (42.1% of “other” workers, much higher than any other demographic group, as shown in Table 9) and the very large number of jobs lost in the high-tech computer and electronic products sector. Asian Americans and other minorities have been especially hard hit by growing China trade deficits.
Conclusion
The growing U.S. trade deficit with China has displaced huge numbers of jobs in the United States and has been a prime contributor to the crisis in manufacturing employment over the past six years. Moreover, the United States is piling up foreign debt, losing export capacity, and facing a more fragile macroeconomic environment.
Is America’s loss China’s gain? The answer is most certainly no. China has become dependent on the U.S. consumer market for employment generation, has suppressed the purchasing power of its own middle class with a weak currency, and, most importantly, has held hundreds of billions of hard currency reserves in low-yielding, risky assets instead of investing them in public goods that could benefit Chinese households. Its vast purchases of foreign exchange reserves have stimulated the overheating of its domestic economy, and inflation in China has accelerated rapidly in the past year. Its repression of labor rights has suppressed wages, thereby artificially subsidizing exports.
The U.S-China trade relationship needs a fundamental change. Addressing the exchange rate policies and labor standards issues in the Chinese economy are important first steps.
The author thanks Lauren Marra and Emily Garr for research assistance and Josh Bivens for comments.
This research was made possible by support from the Alliance for American Manufacturing.
References
AFL-CIO, U.S. Representative Benjamin L. Cardin, and U.S. Representative Christopher H. Smith (AFL-CIO et al). 2006. “Section 301 Petition [on China’s repression of workers’ rights].” June 8.
Bivens, L. Josh. 2008a. Everybody Wins, Except for Most of Us: What Economics Teaches (But Economists Generally Don’t) About Globalization. Washington, D.C.: Economic Policy Institute. Forthcoming.
Bivens, L. Josh. 2008b. Trade, Jobs, and Wages: Are the Public’s Worries about Globalization Justified?Issue Brief No. 244. Washington, D.C.: Economic Policy Institute. http://www.epinet.org.
Bureau of Labor Statistics, Office of Employment Projections. 2008a. Special Purpose Files— Industry Output and Employment. Washington, D.C.: U.S. Department of Labor. http://www.bls.gov/emp/empind2.htm.
Bureau of Labor Statistics, Office of Employment Projections. 2008b. Special Purpose Files— Employment Requirements. Washington, D.C.: U.S. Department of Labor. http://stats.bls.gov/emp/empind4.htm.
Bureau of Labor Statistics. 2005. Access to historical data for the “B” tables of the Employment Situation News Release. http://stats.bls.gov/ces/cesbtabs.htm.
Cline, William R., and John Williamson. 2008. New Estimates of Fundemntal Equilibrium Exchange Rates. Policy Brief #PB08-7. Washington, D.C.: Peterson Institute for International Economics.
Clinton, Bill. 2000. Expanding trade, protecting values: why I’ll fight to make China’s trade status permanent. New Democrat, Vol. 12, No. 1, pp. 9-11.
Congressional Budget Office. 2008. “How changes in the value of the Chinese currency affect U.S. imports.” Washington, D.C.: Congress of the United States, Congressional Budget Office.
Haley, Usha C. V. 2008. Shedding light on energy subsidies in China: An analysis of China’s steel industry from 2000-2007. Washington, D.C.: Alliance for American Manufacturing.
Faux, Jeff. 2007. Globalization that Works for Working Americans. Issue Brief. Washington, D.C.: Economic Policy Institute.
Faux, Jeff, Bruce Campbell, Carlos Salas, and Robert Scott. 2006. Revisiting NAFTA: Still not Working for North America’s Workers. Briefing Paper. Washington, D.C.: Economic Policy Institute.
Kletzer, Lori G. 2001. Job Loss From Imports: Measuring the Costs. Washington, D.C.: Institute for International Economics.
Ratner, David. 2006. “Appendix: methodology and data sources.” In Faux et al. 2006.
Rothstein, Jesse, and Robert E. Scott. 1997a. NAFTA’s Casualties: Employment Effects on Men, Women, and Minorities. Issue Brief. Washington, D.C.: Economic Policy Institute. http://www.epinet.org.
Rothstein, Jesse, and Robert E. Scott. 1997b. NAFTA and the States: job Destruction is Widespread. Issue Brief. Washington, D.C.: Economic Policy Institute. http://www.epinet.org.
Scott, Robert E. 2005. U.S.-China Trade, 1989-2003: Impact on Jobs and Industries, Nationally and State-by-State. Working Paper No. 270. Washington, D.C.: Economic Policy Institute.
Scott, Robert E. 2006. “NAFTA’s Legacy: Rising Trade Deficits Lead to Significant Job Displacement and Declining Job Quality for the United States.” In Faux et al. 2006.
Scott, Robert E. 2008. Increase in Oil Prices, Fall in Investment Income Exacerbates Cu
rrent Account Deficit Woes. Washington, D.C.: Economic Policy Institute. http://www.epinet.org.
U.S. Bureau of Labor Statistics. 2008. Union Members in 2005. Washington, D.C.: U.S. Department of Labor. News Release USDL 06-99. January 20.
U.S. Bureau of Labor Statistics. 2008b. “Productivity Growth by Major Sector, 1947-2007.” Bar Chart. Washington, D.C.: USDL.
U.S. Census Bureau. 2008. “Basic Monthly Survey of the Current Population Survey (data for 2005-07).” Washington, D.C: U.S. Department of Commerce.
U.S. International Trade Commission. 2008. USITC Interactive Tariff and Trade DataWeb. http://dataweb.usitc.gov/scripts/user_set.asp
Endnotes
1. The $19.4 billion includes losses experienced by workers displaced by growing imports and net losses experienced by the movement of jobs from import-competing sectors to industries producing exports to China (see Table 6B).
2. These purchases financed more than one-half of the U.S. $731 billion current account deficit (the broadest measure of all U.S. trade and income flows) in 2007. But for these purchases, the reduced demand would have put significant downward pressure on the U.S. dollar. A substantial depreciation in the dollar would begin to improve the U.S. trade deficit within a few years.
3. The official name of the Chinese currency is the renminbi (RMB). The RMB is convertible for current account transactions but not for capital account flows. “Unlike the United States and many other countries, China uses a different word—yuan—for the unit in which product prices, exchange rates, and other such values are denominated from the word used for its currency” (Congressional Budget Office 2008, note 3). Hereinafter the word yuan will be used when referring to the Chinese exchange rate.
4. The trade balance usually responds to a fall in the dollar with a substantial lag of at least one to two years, due to “J-curve” effects. The major initial impact of a depreciation is usually to raise the price and total value of imports, and hence the trade deficit. In the medium- and long-term, the trade flows usually respond to the increase in the relative competitiveness of domestic products as the rate of growth of imports slows or imports decrease, and the rate of growth of exports accelerates, ultimately leading to an improvement in the trade balance for large currency adjustments. Most of the dollar adjustment against major currencies occurred between February 2002 and December 2004. For example, the dollar fell 36.4% against the euro in this period, and then fell only 4.0% between December 2004 and December 2007.
5. NewsHour With Jim Lehrer transcript. 1999. “Online NewsHour: Opening Trade – November 15, 1999.”
http://www.pbs.org/newshour/bb/asia/july-dec99/wto_11-15.html
6. Output (gross domestic product or GDP) is the sum of consumption, investment, government spending, and the trade balance. The trade balance is the sum of exports less imports. A declining trade balance lowers GDP. The growth of the U.S. trade deficit with China has therefore reduced U.S. GDP and the demand for labor. Holding all other sources of demand constant, growing trade deficits therefore reduce the demand for labor in the U.S.
7. See Scott (2006) for further details on the model and Ratner (2006) for a technical presentation and details on data sources used. This model has been completely updated for this study using new employment requirements tables for 2001 and related economic data from the Bureau of Labor Statistics (2008). Trade data collected by the U.S. Census Bureau was downloaded from the U.S. International Trade Commission (2008).
8. For the purposes of this report it is necessary to distinguish between exports produced domestically and re-exports—which are goods produced in other countries, imported into the United States, and then re-exported to other countries, in this case to China. Since re-exports are not produced domestically, their production does not support domestic employment and they are excluded from the model used here. See Table 1 for information about the levels of U.S. re-exports to China in this period.
9. Table 3 reports U.S. imports for consumption and domestic exports to China. These flows were chosen to emphasize goods produced and consumed in the United States. News reports from the Census Bureau and Commerce Department usually emphasize general imports and total exports. Total exports as reported by the Census Bureau include re-exports, i.e., goods produced in other countries and shipped through the United States. For 2007, the Census Bureau reported general imports from China of $321.4 billion, total exports of $65.2 billion, and a trade balance of -$256.2 billion.
10. Further details on the matching system used are available on request. Identical matches were not available for some BLS industries, in part because the CPS survey aggregates a number of closely related four-digit NAICS sectors that are included separately in the BLS model. For example, motor vehicle assembly (NAICS 3361and BLS sector 88), motor vehicle body and trailer manufacturing (NAICS 3362 and BLS 89), and motor vehicle parts (NAICS 3363 and BLS 90) were all combined in the CPS survey. These pooled demographic data were used to approximate demographic characteristics for each of these NAICS/BLS industries.
11. Estimates reflect weighting by the total number of jobs displaced in each sector.
12. Note that for manufacturing only, average export wages marginally exceed import wages. The overall result is largely a consequence of the very low level of average wages in the agricultural sector and the large share of agricultural products in U.S. exports to China.
13. The demographic data used for this analysis are derived from the CPS ORG files (U.S. Census Bureau 2008) and are a sample representing 126 million full-time workers age 16 and above. The demographic characteristics of this group are shown in Tables 7 and 9. Total U.S. employment includes workers such as those under age 16 and the self-employed. Total U.S. employment in 2006 was 148.8 million. The demographic characteristics in the CPS ORG data do not accurately reflect the demographic characteristics of this larger group. Thus, for example, applying the education shares for each of the 201 industries in the model used here to total BLS employment for each of the 201 industries in the model yields smaller college-educated shares and larger shares for groups with less education than those shown for the total population in Table 7 (column 1). Reconciliation of these conflicting datasets is an important topic for future research.
14. The source for these data is the CPS ORG (U.S. Census Bureau 2008). Sample includes all computer and mathematical, architecture and engineering, and life, physical, and social science occupations (occupational classifications 15, 17 and 21).
15. The overall U.S. goods trade deficit increased from $429.5 billion in 2001 to $819.4 billion in 2007 (U.S. International Trade Commission 2008).
16. The NAFTA study was based on demographic data for the year 2000. Table 8 in this paper is based on data for workers in a pooled sample for 2005-07, and that group includes a slightly higher overall share of college-educated workers (29.8% vs. 27.5% in the NAFTA study).
17. These totals include all employees in computer and mathematical; architecture and engineering; and life, physical, and social science occupations.
18. Workers in nondurable manufacturing industries were more than twice as likely as workers in retail trade to be represented by a union in 2004 (13.2% vs. 6.1%). Only 1.6% of workers in food services and drinking places were represented by unions (U.S. Department of Labor 2006, Table 3).
