The August 2010 employment report released this morning by the Bureau of Labor Statistics showed a labor market continuing to flounder with subpar employment growth. The unemployment rate increased by 0.1 percentage point to 9.6% in August, while the private sector added just 67,000 jobs. This was the eighth straight month of gains in the private sector, but it was lower than the average growth of the first seven months (99,000), and it is not robust enough to bring the unemployment rate down.
Payroll jobs and the Census
The total number of payroll jobs declined by 54,000 in August, driven mostly by the shedding of 114,000 temporary Census jobs. The “Census effect” that has buffeted around the payroll numbers for the last six months has now nearly run its course—in March, the federal government actually had added 87,000 temporary Census workers to its payrolls; that grew to 564,000 in May, and then dropped back down to 82,000 in August. Most of those final 82,000 temporary Census jobs will disappear in the next month or two. Excluding changes in temporary Census workers, the number of payroll jobs increased by 60,000 in August. The private sector added 67,000 jobs, while the public sector, excluding changes in temporary Census workers, shed 7,000.
Wages and average workweek
Average hourly wages increased in August, from $22.60 to $22.66. However, nominal hourly wage growth has been generally slowing since the summer of 2008—wages grew at a 2.0% annualized rate over the last three months, compared to a growth rate of 2.6% over the same three months in 2009 and a growth rate of 4.2% over the same three months in 2008. The recent EPI report Recession Hits Workers’ Paychecks documents the collapse of wage growth over the last two years.
The length of the average workweek held steady in August, at 34.2 hours. There has been no improvement in average hours since May, though average hours (for all private employees) are up 1.5% from their low of 33.7 last fall. However, at the start of the recession in December 2007, the length of the average workweek in the private sector was 34.7 hours, so there remains a great deal to make up. Simply restoring average hours worked by all 107.9 million private sector workers from 34.2 back to 34.7 would be equivalent in total hours worked to adding 1.6 million new jobs (at current average hours) to the labor market. The restoration of average hours will therefore be an ongoing drag on new hiring.
Weekly wages, which combines the impact of hourly wages and average hours, increased slightly in August, from $772.92 to $774.97. After falling faster than hourly wage growth for the first year and a half of the recession as hours were cut back, weekly earnings growth saw improvements from the spring of 2009 to the spring of 2010, driven in part by the increase in average hours between the fall of 2009 and the spring of 2010. However, as growth in average hours have stalled out since May, so has growth in weekly wages, increasing at an annualized rate of 2.0% over the last three months after growing at an annualized rate of 3.2% in the six prior months.
Unemployment and employment rates
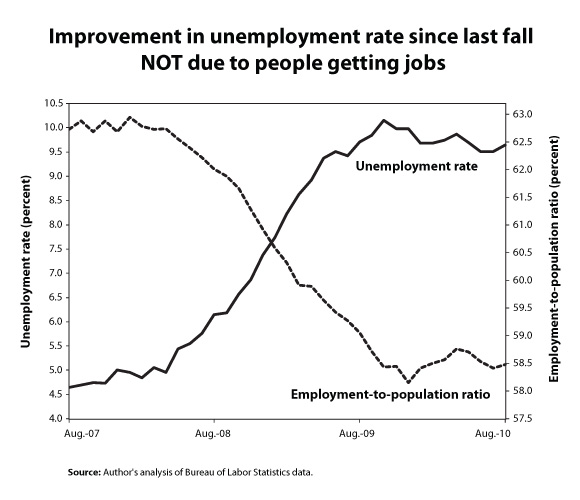
The chart below shows that while the unemployment rate rose slightly in August, it is down 0.5 percentage points from its peak of 10.1% last October, which should be relatively good news. However, for a falling unemployment rate to be good news, the labor market also needs to see an increase in the share of people who are actually employed. The employment-to-population ratio is also presented in the figure, and it shows that during the period of general improvement in the unemployment rate (the period since October 2009) we did not see a substantial increase in the share of the population with jobs. Instead, the employment-to-population ratio essentially held steady—it was 58.4% in October 2009 and 58.5% in August 2010. In other words, the improvement in the unemployment rate since last October has been almost entirely due to people dropping out of (or not entering) the labor force because of the lack of jobs.
Labor force
This points to another ongoing issue in the labor market, the backlog of “missing workers” (i.e. workers who dropped out of or didn’t enter the labor force during the downturn). The labor force increased by over half-a-million workers (550,000) in August, but the backlog of missing workers remains large. The labor force should have increased by around 3.7 million workers from December 2007 (the start of the recession) to August 2010, given working-age population growth over this period, but instead it grew by 241,000. This means that the pool of “missing workers” now numbers around 3.5 million, none of whom are reflected in the official unemployment count. As these workers enter or re-enter the labor force in search of work, this will contribute to keeping the unemployment rate high.
It should also be noted that the total labor force was 316,000 less in August 2010 than a year earlier, even though we would expect the labor force to have grown over that time period. The decline in labor force participation is occurring across the education spectrum—for workers with less than a high school degree, the labor force participation rate declined by 1.0 percentage points over the last year; for workers with exactly a high school degree, the labor force participation rate held steady; for workers with more than a high school degree but not a college degree, the labor force participation rate declined by 0.8 percentage points; and for workers with a college degree or more, it declined the most, by 1.2 percentage points.
Long-term unemployment
The share of unemployed workers who have been unemployed for over six months dropped from 44.9% to 42% in August. This improvement likely reflects workers dropping out of the labor force after exhausting unemployment insurance benefits. Despite this, the long-term unemployed share remains the sixth-highest on record, and there are still 6.2 million workers who have been unemployed for longer than six months. These dramatic figures are unsurprising given that there remain roughly five unemployed workers per job opening (note, that doesn’t mean there are five applicants for every job—there could be a huge number of applicants for each job posting as job seekers apply for multiple jobs—but rather that for every five unemployed workers there is literally only one job available). The median, or typical, unemployment spell dropped from 22.2 to 19.9 weeks.
Underemployment
The “underemployment rate” (the U-6 measure of labor underutilization) is a more comprehensive measure of labor market slack than the unemployment rate because it includes not just the officially unemployed, but also jobless workers who have given up looking for work and people who want full time jobs but have had to settle for part-time work (note, however, it does not include people who are underemployed in the sense that they have had to take a job that is below their skills, training, or experience level). This measure increased by 0.2 percentage point to 16.7% in August, meaning that one in six U.S. workers was either unemployed or underemployed. The number of involuntary part-time workers increased by 331,000, while the number of “marginally attached” workers (jobless workers who have given up looking for work), decreased by 225,000. In August, there were a total of 26.
1 million workers who were either unemployed or underemployed.
Demographics
Demographic breakdowns in unemployment show that while all major groups have experienced substantial increases over this downturn, men, racial and ethnic minorities, young workers, and workers with lower levels of schooling are getting hit particularly hard.
- In August, unemployment was 18.1% among workers age 16 to 24, 8.5% among workers age 25 to 54, and 7.3% among workers age 55 and over (increases of 6.3, 4.4, and 4.1 percentage points, respectively, since the start of the recession in December 2007).
- Unemployment was 16.3% among black workers, 12.0% among Hispanic workers, and 8.7% among white workers (increases of 7.3, 5.7, and 4.3 percentage points, respectively, since the start of the recession).
- Unemployment was 10.6% for men, compared to 8.6% for women (increases of 5.5 and 3.7 percentage points since the start of the recession).
- For workers age 25 or older, unemployment reached 10.3% for high school educated workers and 4.6% for those with a college degree (increases of 5.6 and 2.5 percentage points, respectively, since the start of the recession).
Sectors
All 67,000 jobs gained in the private sector were in service-providing industries. Health care—the one bright spot— added 28,200 jobs. Accommodation and food services added 17,300, after adding an average of 7,500 for the prior three months. Temporary help services added 16,800, after remaining essentially flat in July. Retail trade lost 4,900 in August, roughly consistent with its performance the last three months.
Goods-producing industries held steady in August. Construction saw a gain of 19,000 jobs, though 10,000 of the construction gains were due to workers returning after a July strike. In August, the construction sector had the same number of jobs it did in the first quarter of this year. Manufacturing lost 27,000 jobs in August, though that was essentially just an offset to the July increase that occurred because many auto plants did not shut down for retooling in July as expected. Manufacturing is essentially unchanged from June.
In the public sector, aside from changes in temporary Census jobs, the shedding of jobs at the state and local level remains an ongoing drag on employment growth. In August, state and local governments shed a net 10,000 jobs (-14,000 state, +4,000 local). Since their peak in August 2008, state and local governments have shed 282,000 jobs (-43,000 state, -239,000 local).
Conclusion
The labor market remains 7.64 million payroll jobs below where it was at the start of the recession in December 2007. And this number understates the size of the gap in the labor market by failing to take into account the fact that simply to keep up with the growth in the working-age population, the labor market should have added around 3.33 million jobs since December 2007. This means the labor market is now roughly 11 million jobs below the level needed to restore the pre-recession unemployment rate (5.0% in December 2007). To get down to the pre-recession unemployment rate within five years (August of 2015), the labor market would have to add roughly 290,000 jobs every month for that entire period. In August, excluding changes in temporary Census hiring, the labor market added 60,000.
It is past time for the government to do substantially more to create jobs. With a deficit of 11 million jobs, a 9.6% unemployment rate, collapsing wage growth, a private sector that is failing to provide robust jobs growth, and a recovery act that is now starting to fade out, it is time for bold action to create jobs and put America back to work.
— Research assistance by Kathryn Edwards and Andrew Green.
