The July 2010 employment report released this morning by the Bureau of Labor Statistics captured a labor market bogged down in a very painful situation. The unemployment rate held steady at 9.5% in July, while the private sector added just 71,000 jobs–larger than the last two months (which averaged 41,000 after downward revisions), but smaller than in March and April (which averaged 200,000).
The primary reason the unemployment rate did not rise in July is that the labor force officially shrank by 181,000 workers. Those that dropped out of labor force were prime-age workers, while the number of young workers and older workers increased. The teen (age 16-19) labor force increased by 70,000, the young adult (age 20-24) labor force increased by 17,000, the prime-age (age 25-54) labor force decreased by 325,000, and older workers (age 55+) increased by 46,000. If the 181,000 workers that made up the decline had instead remained in the labor force and were counted among the unemployed, the unemployment rate in July would have been 9.6%. This points to another ongoing issue in the labor market, the backlog of “missing workers,” that is, workers who dropped out of (or never entered) the labor force during the downturn. In the last three months, the labor force has declined by 1.2 million workers, reversing much of the 1.7 million increase in the labor force in the first four months of the year. This clearly shows how the forward momentum from earlier this year has largely evaporated.
Another useful measure is to simply look at the share of the population that is employed, the employment-to-population ratio. Over the last three months, that ratio has declined significantly, from 58.8% to 58.4% (but due to the decline in labor force participation, the unemployment rate actually somewhat misleadingly showed improvement over this period, moving from 9.9% to 9.5%).
To get an idea of the size of the current backlog of missing workers, consider the following: The labor force should have increased by around 3.6 million workers from December 2007 (the start of the recession) to July 2010, given that the working-age population grew over this period. Instead the size of the labor force actually decreased by 309,000. This means that the pool of “missing workers” now numbers around 3.9 million, none of whom are reflected in the official unemployment count. As these workers enter (or re-enter) the labor force in search of work, this will contribute to keeping the unemployment rate high.
Payroll jobs
The total number of payroll jobs declined by 131,000 in July, though the shedding of 143,000 temporary Census jobs more than accounted for that loss. In order to get a handle on the fundamentals of the labor market this summer, it is and will continue to be important to look at the payroll numbers excluding changes in temporary Census employment. (The Census still has 196,000 temporary employees on its payroll. These jobs will also disappear in the next couple months.)
Excluding changes in temporary Census hiring, the number of payroll jobs increased by 12,000 in July. The private sector added 71,000 jobs, while state and local governments–their budgets crunched–shed 48,000 jobs (-10,000 state, -38,000 local). The federal government (excluding changes in temporary Census jobs) shed 11,000 jobs.
Hours
The length of the average workweek increased slightly in July, from 34.1 to 34.2 hours, restoring hours to their May level. All the growth was in the goods-producing sector, while the service-producing sector held steady.From their low of 33.7 last fall, average hours (for all private employees) are up by 1.5%. However, at the start of the recession in December 2007, the length of the average workweek in the private sector was 34.7 hours, so there remains a great deal of ground to make up. Simply restoring average hours worked by all 107.7 million private sector workers from 34.2 back to 34.7 would be equivalent in total hours worked to adding 1.6 million new jobs at current average hours. The restoration of average hours will therefore be an ongoing drag on new hiring.
Wages
Average hourly wages increased in July, from $22.55 to $22.59 in July. Nominal hourly wage growth has been generally slowing since the summer of 2008 and remains low–wages grew at a 1.6% annualized rate over the last three months. They grew at 1.8% over the last year, somewhat faster than inflation (which was 1.1% from June 2009 to June 2010, the most recent data available). After falling faster than average hourly wage growth for the first year and a half of the recession, average weekly earnings growth has seen some improvements since the spring of 2009, as average hours have been generally improving. July’s increase in average hours meant weekly paychecks increased further – after growing at a 2.5% annualized rate over the prior three months, average weekly paychecks grew at a 5.8% annualized rate in July.
Long-term unemployment
The share of unemployed workers who have been unemployed for over six months dropped from 45.5% to 44.9%. This improvement likely reflects workers dropping out of the labor force after exhausting unemployment insurance benefits. Despite the improvement, the long-term unemployed share remains the fourth-highest share on record, and there are still 6.6 million workers who have been unemployed for longer than six months. These dramatic figures are unsurprising given that there remain roughly five unemployed workers per job opening (note, that doesn’t mean there are five applicants for every job–there could be a huge number of applicants for each job posting as job seekers apply for multiple jobs–instead it means that for every five unemployed workers there is literally only one job available). The median, or typical, unemployment spell dropped from 25.5 to 22.2 weeks, and the average unemployment spell dropped from 35.2 to 34.2 weeks.
Underemployment
The “underemployment rate,” or the U-6 measure of labor underutilization, is a more comprehensive measure of labor market slack than the unemployment rate because it includes not just the officially unemployed, but also jobless workers who have given up looking for work, and people who want full time jobs but have had to settle for part-time work (note, however, it does not include people who are underemployed in the sense that they have had to take a job that is below their skills, training, or experience level). This measure was at 16.5% in July, meaning that one in six U.S. workers was either unemployed or underemployed. This was unchanged from June, masking an increase of 110,000 in the number of “marginally attached” workers (jobless workers who have given up looking for work), and a decline of 98,000 of involuntary part-time workers. In July, there were a total of 25.8 million workers who were either unemployed or underemployed.
Demographics
Demographic breakdowns in unemployment show that while all major groups have experienced substantial increases over this downturn, men, racial and ethnic minorities, young workers, and workers with lower levels of schooling are getting hit particularly hard.
- In July, unemployment was 18.6% among workers age 16-24, 8.5% among workers age 25-54, and 6.9% among workers age 55+ (increases of 6.8, 4.4, and 3.7 percentage points, respectively, since the start of the recession in December 2007).< /li>
- Unemployment was 15.6% among black workers, 12.1% among Hispanic workers, and 8.6% among white workers (increases of 6.6, 5.8, and 4.2 percentage points, respectively, since the start of the recession).
- Unemployment was 10.4% for men, compared to 8.5% for women (increases of 5.3 and 3.6 percentage points since the start of the recession).
- For workers age 25 or older, unemployment reached 10.1% for high school educated workers and 4.5% for those with a college degree (increases of 5.4 and 2.4 percentage points, respectively, since the start of the recession).
Sectors
The shedding of public sector jobs at the state and local level remains an ongoing drag on employment growth. In July, state and local governments shed 48,000 jobs (-10,000 state, -38,000 local). Since their peak in August 2008, state and local governments have shed 316,000 jobs (-69,000 state, -247,000 local).
After adding jobs for nine straight months, temporary help services lost 6,000 jobs in July. This does not bode well for future jobs growth. Construction saw a loss of 11,000 jobs, all in residential, though 10,000 of the construction losses were due to a strike. Manufacturing added 36,000 jobs, its seventh straight month of gains, but most of this (20,700) was in motor vehicles and parts manufacturing, as Detroit auto makers did not shut down in July, as they usually do, to retool for new models.
Retail trade gained 7,000 jobs in July, after losing an average of 4,000 for the prior three months. Financial activities lost 17,000 in July, with 9,000 of those lost in real estate. Leisure and hospitality added 6,000 jobs in July, after adding an average of 14,000 for the prior three months. One bright spot was health care, which added 27,000 jobs in July, after adding an average of 15,000 for the prior three months.
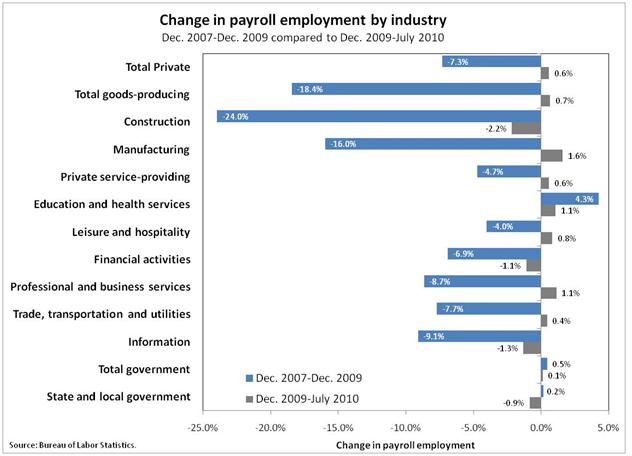
The recession began in December 2007, and employment reached its lowest point two years later, in December 2009. Since last December, the private sector has been adding jobs. The following chart shows percent changes in employment over these two periods by sector. Over the first two years of the recession, construction employment declined by 24.0%, and has continued to decline since then. Manufacturing lost 16.0% over the first two years, but is now adding jobs, increasing by 1.6% since last December. Employment in leisure and hospitality declined by 4.0% over the first two years, but has increased by 0.8% since then. Professional and business services declined by 8.7% in the first two year, but increased by 1.1% since then–the swing in that sector was driven in large part by temporary help services, which lost 32.6% of employment from December 2007 to September 2009 (the trough for temp help), and has gained 21.1% since then. All together, private service-producing sectors lost 4.7% in the first two years, and have gained 0.6% since then.
The labor market remains 7.7 million payroll jobs below where it was at the start of the recession in December 2007. And this number understates the size of the gap in the labor market by failing to take into account the fact that, simply to keep up with the growth in the working-age population, the labor market should have added around 3.2 million jobs since December 2007. This means the labor market is now roughly 10.9 million jobs below the level needed to restore the pre-recession unemployment rate (5.0% in December 2007). To get down to the pre-recession unemployment rate within five years, the labor market would have to add roughly 285,000 jobs every month for that entire period. In July, excluding changes in temporary Census hiring, the labor market added 12,000.
Conclusion
With a deficit of 10.9 million jobs–a 9.5% unemployment rate–the private sector is not yet able to provide a robust recovery, and it is time for the government to do substantially more to create jobs so the backlog of unemployed workers in this country can have a desperately needed chance to get back to work. Yesterday, the Senate voted to approve a bill that included $26 billion in aid to states and school districts; the House is expected to vote on it on Tuesday. With state and local government shedding 48,000 jobs in July, this relief is crucial.
—Research assistance from Kathryn Edwards and Andrew Green
