This morning, the Bureau of Labor Statistics released the July report from the Job Openings and Labor Turnover Survey (JOLTS), showing that job openings increased by 178,000 in July, though downward revisions to earlier data reveal that there were 73,000 fewer jobs openings in June than previously reported.
The total number of job openings in July was 3.0 million, while from the Current Population Survey we know that the total number of unemployed workers was 14.6 million. This means that the ratio of unemployed workers to job openings was 4.8-to-one, an improvement from the revised June ratio of 5.1-to-one. Importantly, this ratio does not measure the number of applicants for each job. There may be throngs of applicants for every job posting, since job seekers apply for multiple jobs. The 4.8-to-1 ratio means that, for example, that for every 48 unemployed workers, there are only 10 jobs available.
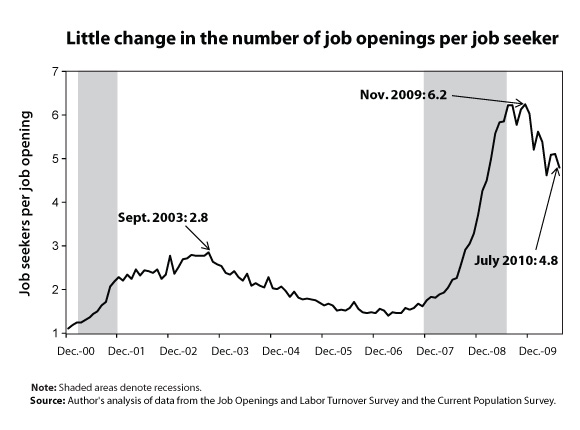 The good news is that the ratio is significantly improved from its peak last November of 6.2-to-one. However, there remains a severe lack of jobs. The ratio of unemployed workers per job opening is still much higher than at the worst point in the early-2000’s recession, when it peaked at 2.8 unemployed workers per job opening in September of 2003. For the first half of 2007 before the current downturn began, the ratio averaged 1.5-to-one. July’s value, at 4.8-to-one, was over three times that high.
With so many unemployed workers per available job, it is no surprise that workers who have gotten laid off continue have a difficult time finding a new job and get stuck in unemployment for very long periods. In July, 44.9% of this country’s unemployed workers had been unemployed for over six months, nearly 20 percentage points above the high of all prior recessions, which was 26.0%, set in the summer of 1983.
Furthermore, when calculating the ratio of unemployed-to-job-openings, if we were to include not just the 14.6 million officially unemployed workers, but also the 2.6 million “marginally attached” workers (jobless workers who want a job, are available work, have looked for work in the last year but have given up actively seeking work and are therefore not counted as officially unemployed), the ratio would be 5.7-to-one.
Another concern in today’s report is the recent increase in private sector layoffs. As shown in Figure 2, private sector layoffs reached their peak in January of 2009, at 2.5 million. That declined substantially to 1.6 million in April of 2010. However, since that time, it has climbed back up again, and was at 1.9 million in July. The increase in layoffs from April to July was the largest three-month increase in layoffs since early 2009. Furthermore, private sector hires have also stalled. After hiring bottomed out in the summer of 2009, it rose slowly but fairly steadily through March of this year. Since that time, hiring has not increased. The combination of layoffs rising and hiring stalling out will severely dampen net employment gains.
 In July there were 11.6 million more officially unemployed workers than there were job openings. The August employment report released on September 3rd showed very slow growth in August. Barring changes in temporary Census employment, the labor market added only 60,000 jobs. This rate of growth is nowhere near what is needed to bring the unemployment rate down. It is time for bold action to create jobs and put America back to work.
