What to Look for in next Week’s Census Income Data: How Long Will It Take to Claw Back Lost Years of Income Growth?
Next week will see the release of Census data on family income (as well as poverty and health insurance coverage) for 2013. Before the data are released, it’s worth reminding ourselves of one thing that last year’s data showed clearly: economic recoveries in recent recessions have been increasingly unequal, largely mirroring the generation-long upwards march of income inequality more generally. And this pattern seems poised to continue in the recovery from the Great Recession.
The figure below shows these unequal recoveries from recessions in a potentially new way. It essentially looks at just how many years of income growth were lost by each income grouping in various recessions. It measures this by simply counting how many years it took after a recession for each group to regain its previous income peak. For example, incomes for the middle fifth saw a peak in 1989 at $62,212. The recession in the following year led average income for these middle-fifth families to fall for a time, and the 1989 peak of $62,212 was not re-gained for these families until 1996, meaning that essentially seven years (from 1989 to 1996) of income growth for this group was stalled by the recession of the early 1990s. The figure below shows this number of lost years of income growth by income grouping across a range of recessions.
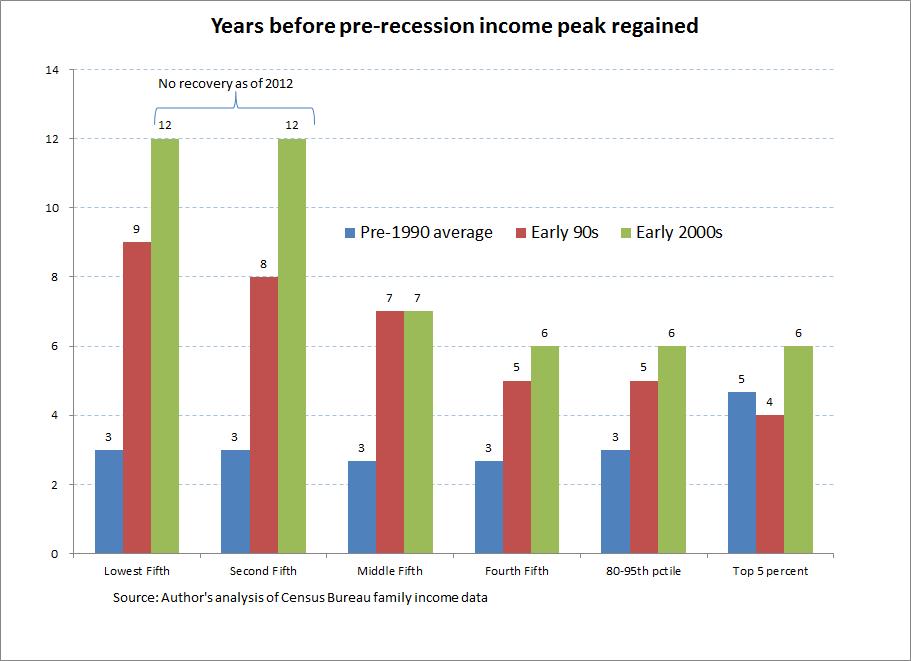
The patterns shown reinforce the divergent fortunes in the post-1979 American economy more generally. Specifically, before 1989 (see the blue bars), each recession led to a very similar number of years of lost income growth for each income grouping. Averaging over each recession, families in the bottom and middle fifths, for example, both regained pre-recession income peaks within 3 years, and it actually took a bit longer for the top 5 percent to regain pre-recession peaks.
Since 1989, however, each recession has seen lower income groupings suffer a greater number of years of lost income growth. For example, following the 1989 income peak it took 9 years for the bottom fifth of households to regain their previous peak, 7 years for the middle-fifth, and just 4 years for the top 5 percent.
In fact, the bottom 40 percent of families have never regained their 2000 peak, hence the value of 12 in 2012 indicating no recovery since 2000. The middle-fifth of families took 7 years to regain their previous peak while families above this level took 6 years.
Since fully 40 percent of American families (those in the bottom two fifths of the income distribution) have never regained even their 2000 income peaks, and because no income group had re-achieved their pre-Great Recession peak levels of income by 2012, it makes little sense to extend this figure for the most recession and recovery.
But we can get a sense of the scale of the damage done by the Great Recession and how little progress has been made in recovery of family incomes. In the table below, I take the 2012 income level for each income group and find the most recent previous year that saw income levels that low for each group. In this exercise, the further back one must go to find income levels corresponding to 2012 levels for each group, the less effective recovery from the Great Recession has been. The results are striking.
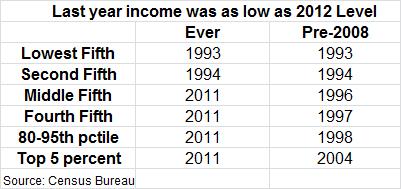
For the bottom fifth, the last year that average income was as low as the $15,780 income that prevailed in 2012 was 1993. For the second fifth of families, the last year that average incomes was as low as the $38,737 that prevailed in 2012 was 1994.
Each other income grouping saw higher incomes in 2012 than in 2011. But, the next column then shows the last pre-Great Recession year when saw incomes were as low as their 2012 levels. After all, clawing back one year of growth after the freefall of the Great Recession may not be a great measure of how well incomes have recovered.
For the bottom and second fifth, the years are the same – incomes as low as what they claimed in 2012 were last seen in 1993 and 1994, respectively. For the middle fifth, the last pre-Great Recession year when average income was as low as 2012 was 1996. For the fourth fifth, the last pre-recession year when average income was as low as their 2012 level was 1998. For families between the 80th and 95th percentiles the last pre-recession year when average income was as low as the $154,382 they claimed in 2012 was 1998. And for families in the top 5 percent, the last time average income was as low as the $357,434 that prevailed in 2012 was also 2004.
What’s the upshot of all this? Many American families have lost years of income-growth already from the Great Recession, and the progress in getting these lost years back is deeply unequal.
Enjoyed this post?
Sign up for EPI's newsletter so you never miss our research and insights on ways to make the economy work better for everyone.