The economy is on the right track, but key indicators show we’re not at full employment yet
The Bureau of Labor Statistic’s released its employment situation report for November this morning, which had the economy adding 228,000 jobs and the unemployment rate holding steady at 4.1 percent. Labor force participation among prime-age workers, those 25-54 years old, increased slightly, while the prime-age employment-to-population (EPOP) ratio hit its highest point in this recovery. Meanwhile, year-over-year nominal wage growth is stalled at 2.5 percent, below where it should be and with no sign of inflationary pressures to weigh on the Federal Reserve’s decision whether to raise rates later this month.
Given the weather-related volatility this fall, it’s useful to provide some context on the topline employment growth figure. Over the last three months, average job growth was 170,000, while over the last six months, job growth averaged 178,000. An increase of about 90,000 is enough to keep up with population growth—so by any measure, smoothed or not, the economy is pulling more people off the sidelines and into the labor force. Even if the unemployment rate simply holds steady, absorbing more and more would-be workers at this point of the recovery is a sign of a healthy economy well on its way to full employment. There is no reason to think that much of the remaining slack, particularly among prime-age workers, won’t continue to be soaked up in a steadily improving economy.
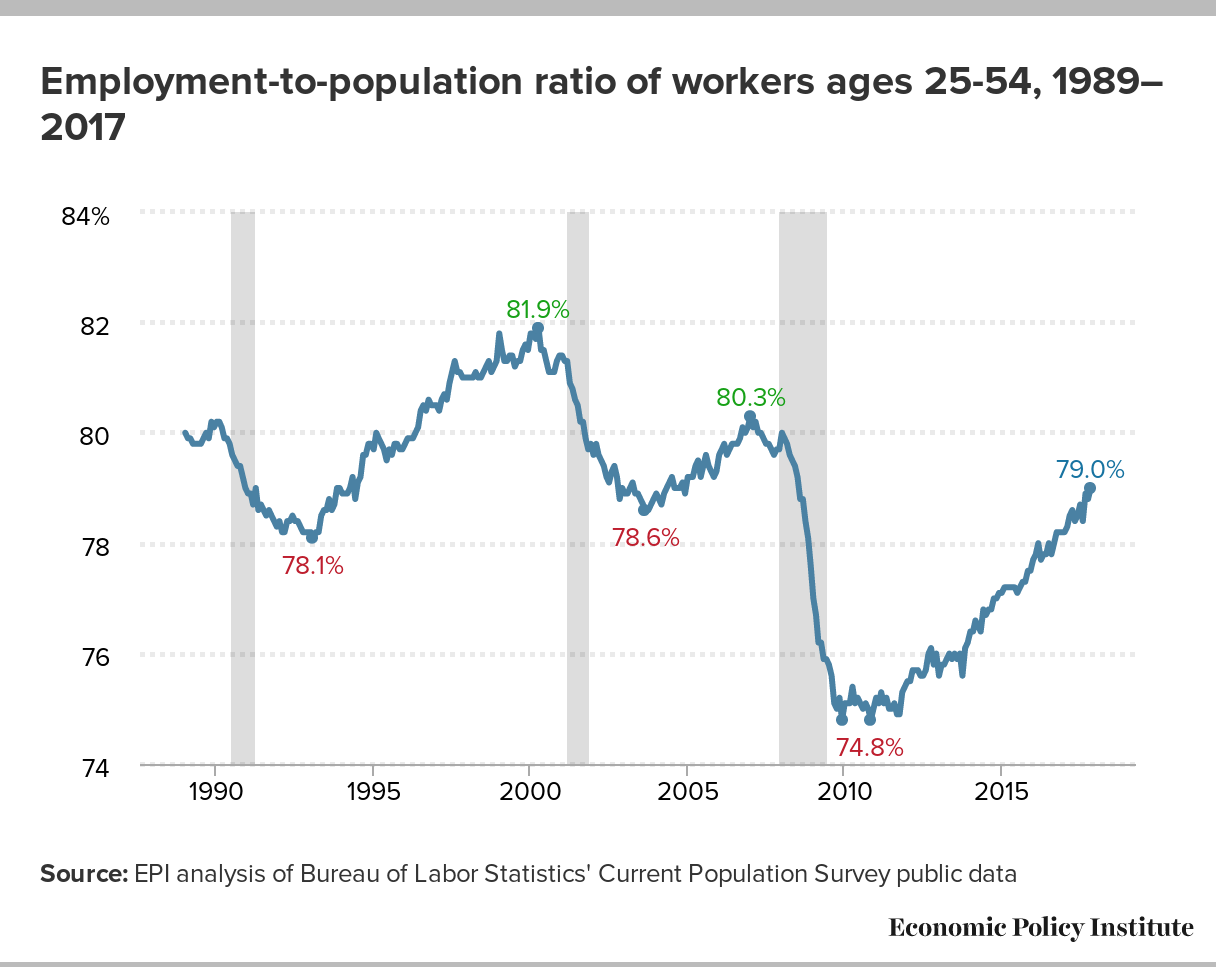
The prime-age EPOP hit a high water mark this month, rising 0.2 percentage points, to 79.0 percent. The overall EPOP—including those above age 55 and below age 25—fell ever so slightly (0.1 percentage points). Unfortunately, this drop is due to losses among young workers, rather than older workers voluntarily retiring. While these differences are certainly important to note, I’d argue that the prime-age EPOP is a better measure of overall labor market health. In a stronger economy, we would expect a larger share of this population to be gainfully employed. As you can see in the figure below, the prime-age EPOP has now comfortably passed the low water mark of the last two business cycles, but still has a way to go before hitting full employment levels.
In addition to prime-age EPOPs, one of the best indicators of how much slack remains in the economy is year-over-year nominal wage growth. In November, nominal wages grew at 2.5 percent over the last year. The figure below illustrates year-over-year nominal wage growth for production/nonsupervisory workers and total nonfarm employees. The production/nonsupervisory series roughly represents the bottom 82 percent of payroll employment; over the last several months it’s been running about 0.2 percentage points slower than the overall series, indicative of some growth in wage inequality. The topline series, however, remains below target levels and has been shown no sign of acceleration. Over the last three months, average growth was 2.5 percent. During that same period last year, the year-over-year September through November growth rate averaged 2.7 percent. Then, it appeared like we could be reaching a consistently higher rate of growth—faster than the 2.4 percent we saw for the same months the previous year. Unfortunately, these signs of potential acceleration have been dashed. Wage growth in recent months has been slower on average, below target levels, and certainly provides no concerns over spiraling inflation. The Federal Reserve should keep this in mind when it meets later this month and should resist pressure to raise interest rates. For the recovery to reach all workers, we need to let the economy get back to genuine full employment.
Nominal wage growth has been far below target in the recovery: Year-over-year change in private-sector nominal average hourly earnings, 2007–2018
| Date | All nonfarm employees | Production/nonsupervisory workers |
|---|---|---|
| Mar-2007 | 3.44% | 4.11% |
| Apr-2007 | 3.13% | 3.85% |
| May-2007 | 3.53% | 4.14% |
| Jun-2007 | 3.61% | 4.19% |
| Jul-2007 | 3.25% | 4.05% |
| Aug-2007 | 3.35% | 3.98% |
| Sep-2007 | 3.09% | 4.15% |
| Oct-2007 | 3.03% | 3.78% |
| Nov-2007 | 3.07% | 3.83% |
| Dec-2007 | 2.92% | 3.75% |
| Jan-2008 | 2.91% | 3.80% |
| Feb-2008 | 2.85% | 3.79% |
| Mar-2008 | 3.04% | 3.83% |
| Apr-2008 | 2.89% | 3.70% |
| May-2008 | 3.07% | 3.69% |
| Jun-2008 | 2.67% | 3.56% |
| Jul-2008 | 3.05% | 3.67% |
| Aug-2008 | 3.33% | 3.89% |
| Sep-2008 | 3.28% | 3.64% |
| Oct-2008 | 3.32% | 3.81% |
| Nov-2008 | 3.50% | 3.91% |
| Dec-2008 | 3.59% | 3.90% |
| Jan-2009 | 3.58% | 3.72% |
| Feb-2009 | 3.43% | 3.65% |
| Mar-2009 | 3.28% | 3.47% |
| Apr-2009 | 3.37% | 3.35% |
| May-2009 | 2.93% | 3.06% |
| Jun-2009 | 2.88% | 2.88% |
| Jul-2009 | 2.69% | 2.76% |
| Aug-2009 | 2.44% | 2.64% |
| Sep-2009 | 2.44% | 2.75% |
| Oct-2009 | 2.53% | 2.68% |
| Nov-2009 | 2.15% | 2.67% |
| Dec-2009 | 1.96% | 2.50% |
| Jan-2010 | 2.09% | 2.66% |
| Feb-2010 | 2.09% | 2.55% |
| Mar-2010 | 1.81% | 2.27% |
| Apr-2010 | 1.81% | 2.38% |
| May-2010 | 1.90% | 2.59% |
| Jun-2010 | 1.76% | 2.53% |
| Jul-2010 | 1.85% | 2.42% |
| Aug-2010 | 1.75% | 2.36% |
| Sep-2010 | 1.84% | 2.19% |
| Oct-2010 | 1.93% | 2.45% |
| Nov-2010 | 1.79% | 2.13% |
| Dec-2010 | 1.79% | 2.02% |
| Jan-2011 | 1.96% | 2.28% |
| Feb-2011 | 1.83% | 2.11% |
| Mar-2011 | 1.83% | 2.06% |
| Apr-2011 | 1.87% | 2.11% |
| May-2011 | 2.04% | 2.10% |
| Jun-2011 | 2.13% | 2.05% |
| Jul-2011 | 2.30% | 2.26% |
| Aug-2011 | 1.95% | 1.99% |
| Sep-2011 | 1.94% | 1.99% |
| Oct-2011 | 2.07% | 1.88% |
| Nov-2011 | 1.98% | 1.82% |
| Dec-2011 | 2.02% | 1.77% |
| Jan-2012 | 1.75% | 1.35% |
| Feb-2012 | 1.79% | 1.45% |
| Mar-2012 | 2.14% | 1.76% |
| Apr-2012 | 2.09% | 1.70% |
| May-2012 | 1.74% | 1.39% |
| Jun-2012 | 1.96% | 1.54% |
| Jul-2012 | 1.69% | 1.39% |
| Aug-2012 | 1.86% | 1.33% |
| Sep-2012 | 1.99% | 1.54% |
| Oct-2012 | 1.51% | 1.18% |
| Nov-2012 | 1.94% | 1.48% |
| Dec-2012 | 2.11% | 1.69% |
| Jan-2013 | 2.11% | 1.89% |
| Feb-2013 | 2.19% | 1.99% |
| Mar-2013 | 1.93% | 1.88% |
| Apr-2013 | 2.01% | 1.78% |
| May-2013 | 2.14% | 1.93% |
| Jun-2013 | 2.13% | 1.98% |
| Jul-2013 | 2.09% | 2.03% |
| Aug-2013 | 2.26% | 2.23% |
| Sep-2013 | 2.04% | 2.12% |
| Oct-2013 | 2.25% | 2.37% |
| Nov-2013 | 2.20% | 2.32% |
| Dec-2013 | 1.90% | 2.26% |
| Jan-2014 | 1.98% | 2.21% |
| Feb-2014 | 2.23% | 2.55% |
| Mar-2014 | 2.06% | 2.30% |
| Apr-2014 | 1.97% | 2.40% |
| May-2014 | 2.13% | 2.44% |
| Jun-2014 | 2.05% | 2.34% |
| Jul-2014 | 2.08% | 2.33% |
| Aug-2014 | 2.21% | 2.43% |
| Sep-2014 | 2.16% | 2.33% |
| Oct-2014 | 2.03% | 2.22% |
| Nov-2014 | 2.03% | 2.26% |
| Dec-2014 | 1.99% | 1.92% |
| Jan-2015 | 2.19% | 2.06% |
| Feb-2015 | 1.93% | 1.66% |
| Mar-2015 | 2.22% | 1.95% |
| Apr-2015 | 2.22% | 1.95% |
| May-2015 | 2.34% | 2.14% |
| Jun-2015 | 2.17% | 2.09% |
| Jul-2015 | 2.12% | 1.99% |
| Aug-2015 | 2.24% | 2.08% |
| Sep-2015 | 2.24% | 2.03% |
| Oct-2015 | 2.52% | 2.37% |
| Nov-2015 | 2.43% | 2.12% |
| Dec-2015 | 2.56% | 2.51% |
| Jan-2016 | 2.55% | 2.40% |
| Feb-2016 | 2.38% | 2.40% |
| Mar-2016 | 2.50% | 2.54% |
| Apr-2016 | 2.61% | 2.58% |
| May-2016 | 2.44% | 2.33% |
| Jun-2016 | 2.56% | 2.43% |
| Jul-2016 | 2.76% | 2.62% |
| Aug-2016 | 2.47% | 2.42% |
| Sep-2016 | 2.63% | 2.56% |
| Oct-2016 | 2.70% | 2.36% |
| Nov-2016 | 2.57% | 2.40% |
| Dec-2016 | 2.65% | 2.49% |
| Jan-2017 | 2.40% | 2.35% |
| Feb-2017 | 2.72% | 2.39% |
| Mar-2017 | 2.55% | 2.24% |
| Apr-2017 | 2.51% | 2.24% |
| May-2017 | 2.46% | 2.33% |
| Jun-2017 | 2.50% | 2.32% |
| Jul-2017 | 2.49% | 2.22% |
| Aug-2017 | 2.60% | 2.31% |
| Sep-2017 | 2.83% | 2.59% |
| Oct-2017 | 2.28% | 2.21% |
| Nov-2017 | 2.47% | 2.35% |
| Dec-2017 | 2.70% | 2.43% |
| Jan-2018 | 2.89% | 2.43% |
*Nominal wage growth consistent with the Federal Reserve Board's 2 percent inflation target, 1.5 percent productivity growth, and a stable labor share of income.
Source: EPI analysis of Bureau of Labor Statistics Current Employment Statistics public data series
Enjoyed this post?
Sign up for EPI's newsletter so you never miss our research and insights on ways to make the economy work better for everyone.