Remember the Last Time the Fed Tightened After a Recession? I Didn’t Either, So…
[Updated – somehow didn’t get the GDP row in previous table to come along—should be fixed now]
Ten years ago (July 2004) was the last time the Fed started raising the effective Federal Funds Rate to provide less support to an economic recovery. Many observers—even presidents of regional Fed banks—think the Fed should start tightening today. I thought I’d just take a quick look at some measures of slack and inflationary pressures to see if the economy does indeed look at least as tight as it did in July 2004. Indicators are in the table below.

First, the unemployment rate—it was 5.6 percent in the second quarter of 2004 (i.e., right before tightening began) and it’s 6.2 percent today.
Next, we look at the employment to population ratio for prime-age adults—simply the share of prime-age (25-54) adults with a job. This was 79 percent in July 2004 and is 76.5 percent today.
Third, we examine the output gap, as measured by the Congressional Budget Office. This is a measure of how much of the economy’s productive potential is being unused—the most direct attempt to measure economic slack. In the second quarter of 2004 this measure indicated that 0.9 percent of potential output being unused, while today this number is 4.5 percent—and this even after the CBO has made very large downward revisions in the unobserved “potential” measure.
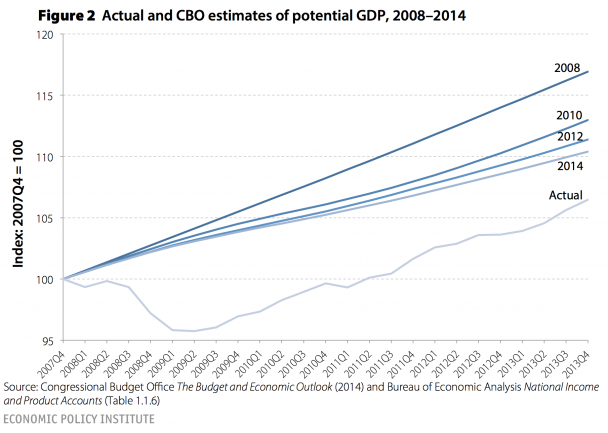
Fourth, inflation in core prices—we track year over year change in the “market-based” deflator for personal consumption expenditures excluding food and energy. This had risen 1.8 percent in the year before the second quarter of 2004, but has risen just 1.3 percent over the past year.
Fifth, the last year’s GDP growth. In the second quarter of 2004 GDP had risen 4.2 percent relative to the same quarter the previous year. In the second quarter of 2014, this growth rate was 2.4 percent.
Finally, a measure of wage inflation: changes in hourly wages for production and non-supervisory workers (a group consisting of about 80 percent of the private workforce). In the second quarter of 2004, these grew at a yearly rate of 2 percent, while in the second quarter of 2014 they rose at a 2.1 percent rate.
So, on every measure except hourly wage inflation, there seems to be much more slack in the economy now than there was the last time the Fed tightened to slow a recovery. And on that wage measure, there’s really no difference.
Two other thoughts:
First, it’s far from clear that tightening in July 2004 was the right move. The 2001-2007 recovery and expansion were the weakest on record in almost every measure, particularly in labor market indicators. This led to the flat-lining of median household income between business cycle peaks—a truly terrible performance. So, using this as the bar for when the Fed should tighten is quite conservative.
Second, there was some evidence in July 2004 that a macroeconomically significant bubble in asset prices was forming that would both fuel demand growth and which perhaps should have been deflated—the housing bubble. By July 2004, home prices were well above historical trend. One can certainly argue (I would) that raising short-term rates is the wrong instrument to fight bubbles, but, there is at least some glimmer of reason why raising these rates in July 2004 in the face of slack might make some sense. There is not obvious macroeconomically significant asset market bubble currently. And after the crisis of 2008/09 and the useful tools and implicit mandate given (we hope!) to financial regulators to restrain financial excess without damaging the broader economy, this bubble-prevention case for tightening also doesn’t hold a lot of water.
Enjoyed this post?
Sign up for EPI's newsletter so you never miss our research and insights on ways to make the economy work better for everyone.