Real world data continues to show no link between corporate cuts and wage increases
With today’s release of the Republican tax plan, the debate over tax policy has finally officially begun. The Trump administration’s Council of Economic Advisers (CEA) has been doggedly campaigning for corporate tax cuts by claiming, unconvincingly, that these cuts will off a cascade of economic changes that lead to higher wages for American workers. Earlier this week the CEA released a second report claiming to marshal evidence showing the benefits of corporate tax cuts for economic growth and wages. This post first notes a key flaw that undermines much of the CEA’s review of this evidence, and then moves on to data from U.S. states that demonstrates (yet again) that there is no reliable link between cutting corporate taxes and raising wages.
The key flaw undermining much of the CEA report from earlier this week is that they completely ignore how their tax cuts will be financed in the long-run. The economic theory relating corporate rate cuts to higher wages rests on these cuts leading to a drop in interest rates (or a related concept, the “user cost of capital”, or UCC) which in turn spurs businesses to invest in productivity-enhancing plants and equipment. The new report cites a number of papers that estimate the effect of a lower user cost of capital (UCC) on economic outcomes.
The first thing to note about these claims is that the size of the effect of a lower UCC on economic outcomes is a contested issue in macroeconomics. But even if it was not, and even if there were universal agreement that a lower UCC significantly boosted growth, there is no reason to believe that enacting the Republican tax plan announced today would result in a lower UCC.
This is because the plan’s architects are silent on how these tax cuts will be financed. Cutting corporate income taxes in isolation would indeed boost post-tax returns to capital, which could lower the user cost of capital. But unless these corporate tax cuts are paired with cuts in federal spending or tax increases elsewhere, the resulting increases in budget deficits would put upward pressure on interest rates and the UCC so long as the economy was near full employment.
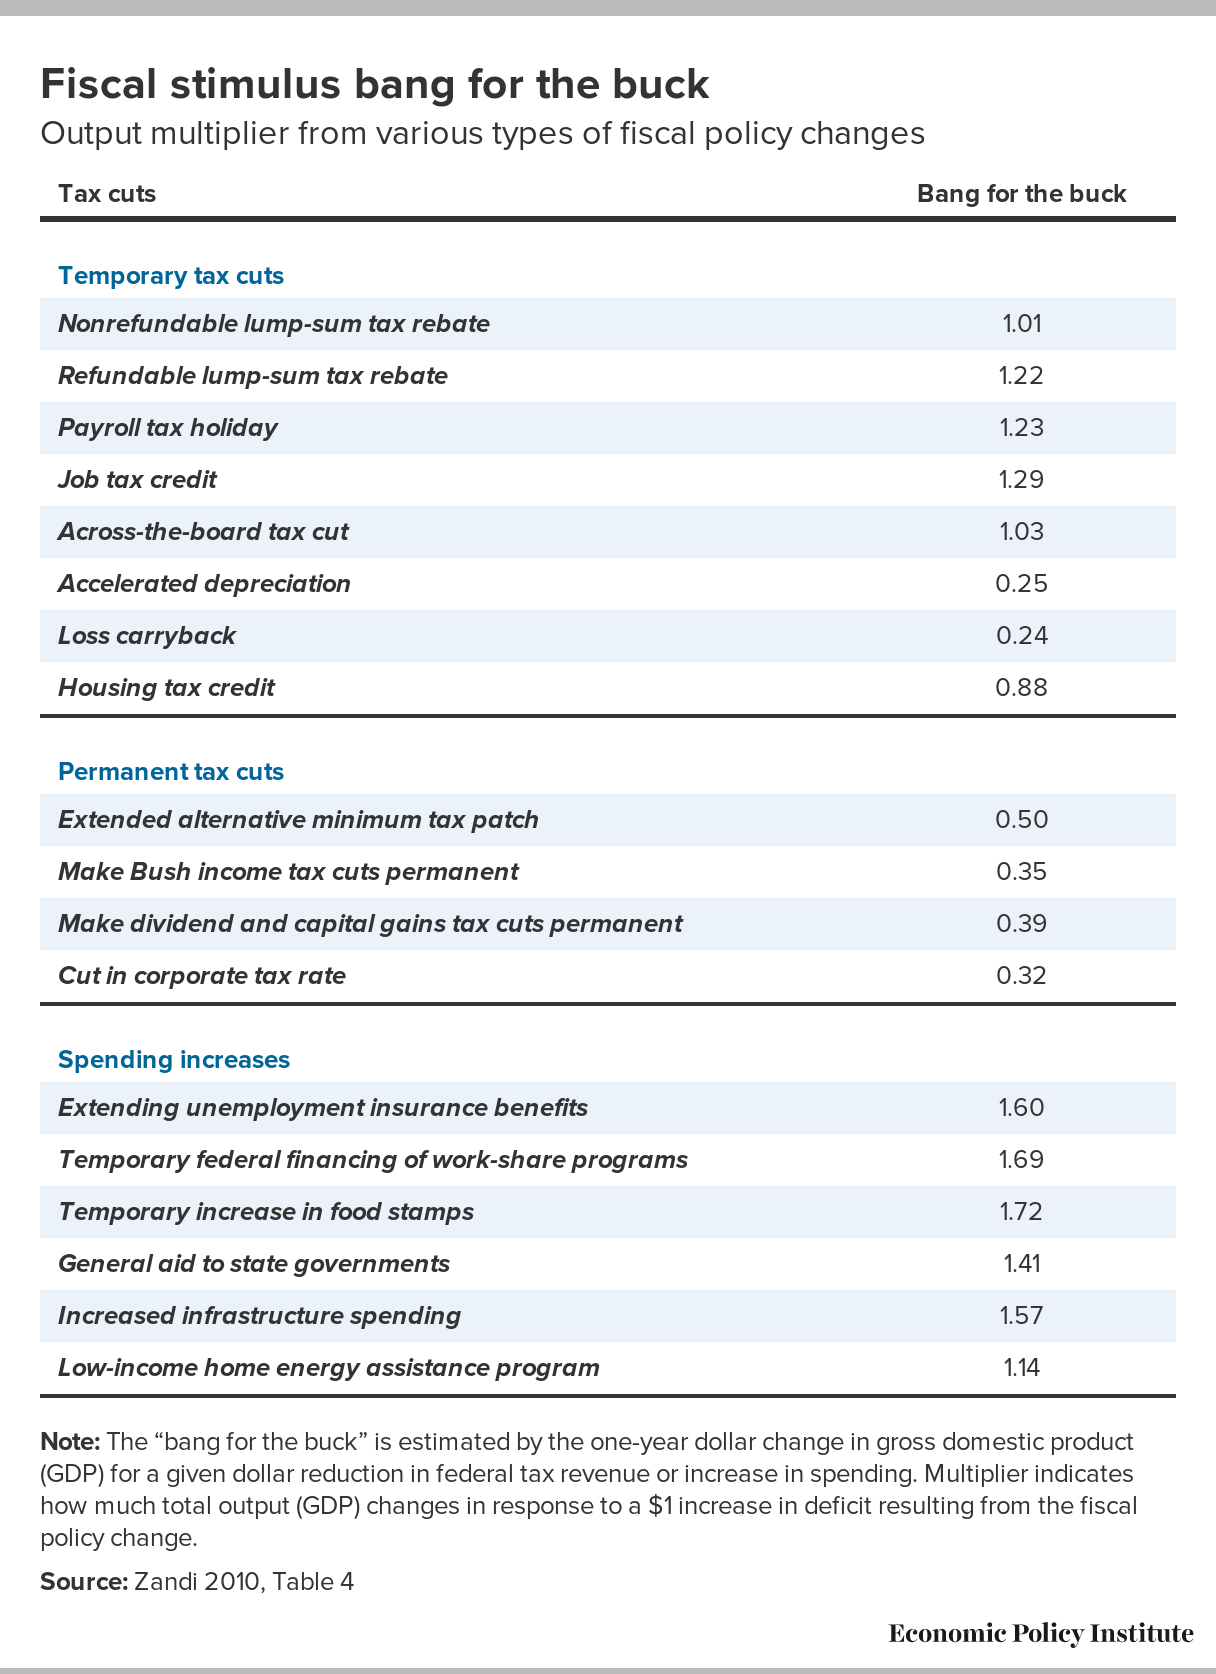
Proponents of the Republican tax cut plan could argue that the economy is not currently at full employment, so increases in budget deficits would not push up interest rates but would simply increase overall economic activity. This is a more-than-defensible argument—though not one these proponents typically make. But if they chose to make this argument, it severely weakens the case for a corporate tax cut in the first place. If the economy is not currently at full employment, the overriding policy goal should be to push it there as quickly as possible. And corporate tax rate cuts are about the weakest fiscal tool we have to push the economy towards full employment. Tax cuts targeted at low- and middle-income households, or direct spending on infrastructure and similar investments, would yield a much higher bang-for-the-buck in terms of creating jobs to get us back to full employment.
Finally, if the economy is indeed not at full employment, then productivity-enhancing investment is not constrained by the availability of economy-wide savings, instead it is constrained by a shortfall of spending by households, businesses and governments. In this environment, there will be no downward pressure on interest rates or the UCC from trying to induce more private savings, and even the supply-side rationale for these cuts evaporates.
This debate, and the CEA advocacy for tax cuts, continues to be plagued by a failure to mobilize convincing real-world evidence. I’ve noted before that the economic data clearly indicates that each link in the causal chain of events that must occur for corporate rate cuts to result in wage gains is weak when assessed against real-world data. In a blog post last week, I called out the CEA for falsely asserting that the benefits of corporate rate cuts for increased capital investment are “highly visible” in international data. Instead, evidence I presented shows that large corporate tax rate cuts between 2000 and 2016 were associated with (very slightly) slower growth in capital investment.
Another place to look for direct evidence that could be “highly visible in the data” regarding the effect of corporate rate cuts is across individual U.S. states. These states are in many ways the best possible candidate for lower corporate taxes to actually show up as higher wages. In the jargon of economists, these individual states can be thought of as “small and open” economies—meaning that their wages, prices, and interest rates are highly driven by influences external to the state economy. This is important because economic models that suggest that corporate income tax rate cuts could translate into large wage gains essentially require economies be small and open. If the data show that even individual U.S. states see little correlation between corporate rate cuts and wage growth, it is almost impossible to credibly claim that a cut in the federal corporate rate for the entire—clearly not “small and open”—U.S. economy would deliver wage growth.
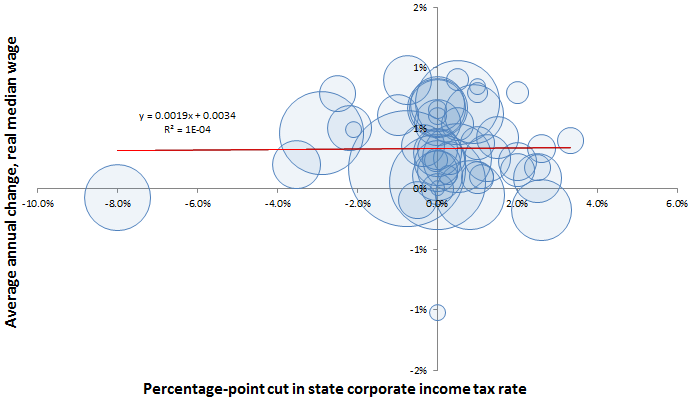
Figure A shows the change in state corporate income tax rates from 1980 to 2010 and the change in the inflation-adjusted state median wage in that period. There is no correlation at all visible in the data. This reveals a key truth policymakers should face: boosting wages will require a range of policies, and most of these useful wage-boosting policies will not involve taxes.
Cutting corporate tax rates is not associated with gains in median wages: Percentage-point change in state corporate income tax rate and annualized growth in median wages, 1980–2010
| Corporate rate | Median wage | Population (weight) |
|---|---|---|
| 1.5% | 0.4% | 4.80E+06 |
| 0.0% | -1.0% | 710231 |
| -3.5% | 0.2% | 6.30E+06 |
| 0.5% | 0.5% | 2.90E+06 |
| -0.8% | 0.2% | 3.70E+07 |
| -0.4% | 0.4% | 5.00E+06 |
| -2.5% | 0.8% | 3.60E+06 |
| 0.0% | 0.7% | 897934 |
| 0.5% | 0.7% | 1.90E+07 |
| 0.0% | 0.7% | 9.70E+06 |
| 0.0% | 0.2% | 1.40E+06 |
| 1.1% | 0.1% | 1.60E+06 |
| 0.8% | -0.1% | 1.30E+07 |
| 2.5% | 0.1% | 6.50E+06 |
| 2.0% | 0.2% | 3.00E+06 |
| 0.3% | 0.3% | 2.90E+06 |
| 0.0% | 0.3% | 4.30E+06 |
| 0.0% | 0.1% | 4.50E+06 |
| 2.0% | 0.8% | 1.30E+06 |
| 0.0% | 0.5% | 5.80E+06 |
| -0.8% | 0.9% | 6.50E+06 |
| 2.6% | -0.2% | 9.90E+06 |
| -2.2% | 0.5% | 5.30E+06 |
| 1.0% | 0.4% | 3.00E+06 |
| 1.3% | 0.3% | 6.00E+06 |
| 0.3% | 0.1% | 989415 |
| 3.3% | 0.4% | 1.80E+06 |
| 0.0% | 0.0% | 2.70E+06 |
| 0.5% | 0.9% | 1.30E+06 |
| 0.0% | 0.7% | 8.80E+06 |
| 2.6% | 0.3% | 2.10E+06 |
| -2.9% | 0.5% | 1.90E+07 |
| 0.9% | 0.6% | 9.50E+06 |
| -2.1% | 0.5% | 672591 |
| -8.0% | -0.1% | 1.20E+07 |
| 2.0% | 0.2% | 3.80E+06 |
| -0.5% | -0.1% | 3.80E+06 |
| 0.5% | 0.3% | 1.30E+07 |
| 1.0% | 0.8% | 1.10E+06 |
| -1.0% | 0.6% | 4.60E+06 |
| 0.0% | 0.6% | 814180 |
| 0.0% | 0.3% | 6.30E+06 |
| 0.0% | 0.1% | 2.50E+07 |
| 1.0% | 0.1% | 2.80E+06 |
| 1.0% | 0.8% | 625741 |
| 0.0% | 0.7% | 8.00E+06 |
| 0.0% | 0.1% | 6.70E+06 |
| 2.5% | 0.2% | 1.90E+06 |
| 0.0% | 0.2% | 5.70E+06 |
| 0.0% | 0.0% | 563626 |
Note: Author’s analysis of data on state corporate tax rates from Serrato and Zidar (summary data here). Data on state median wages from the Current Population Survey Outgoing Rotation Groups (ORG). Data is deflated using the CPI-U-RS. Data points weighted by state population in 2010.
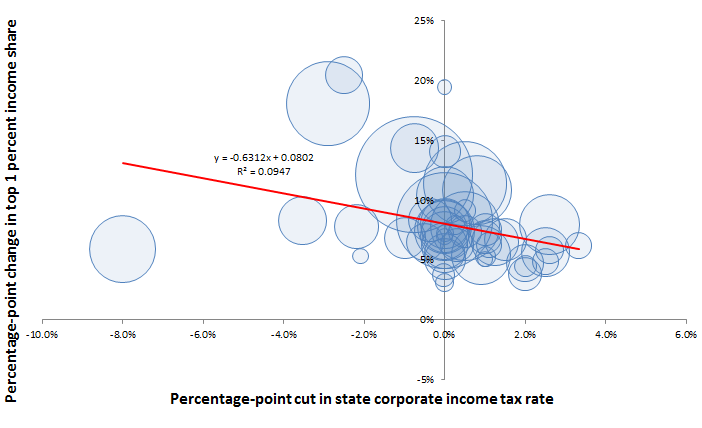
Are we sure that nobody in these states will see any gain from cutting corporate taxes? No. Figure B looks at the same 1980 to 2010 period and shows the relationship between the change in state corporate income tax rates and the change in the share of total state income claimed by the richest 1 percent of households. Here the correlation (evidenced by the downward sloping trend-line) is clearer: a reduction in the corporate rate is associated with an increase in the share of total income claimed by the top 1 percent.
Cutting corporate rates boosts top 1 percent incomes: Percentage-point change in state corporate income tax rates and top 1 percent income share, 1980–2010
| Corporate rate | Top 1 percent income share | Population (weight) |
|---|---|---|
| 1.5% | 6.7% | 4.80E+06 |
| 0.0% | 7.0% | 710231 |
| -3.5% | 8.3% | 6.30E+06 |
| 0.5% | 7.4% | 2.90E+06 |
| -0.8% | 12.1% | 3.70E+07 |
| -0.4% | 8.3% | 5.00E+06 |
| -2.5% | 20.5% | 3.60E+06 |
| 0.0% | 3.1% | 897934 |
| 0.5% | 11.4% | 1.90E+07 |
| 0.0% | 7.5% | 9.70E+06 |
| 0.0% | 3.8% | 1.40E+06 |
| 1.1% | 6.2% | 1.60E+06 |
| 0.8% | 10.8% | 1.30E+07 |
| 2.5% | 5.7% | 6.50E+06 |
| 2.0% | 3.9% | 3.00E+06 |
| 0.3% | 6.2% | 2.90E+06 |
| 0.0% | 5.6% | 4.30E+06 |
| 0.0% | 5.1% | 4.50E+06 |
| 2.0% | 4.5% | 1.30E+06 |
| 0.0% | 6.2% | 5.80E+06 |
| -0.8% | 14.3% | 6.50E+06 |
| 2.6% | 8.0% | 9.90E+06 |
| -2.2% | 7.8% | 5.30E+06 |
| 1.0% | 6.9% | 3.00E+06 |
| 1.3% | 6.5% | 6.00E+06 |
| 0.3% | 8.0% | 989415 |
| 3.3% | 6.2% | 1.80E+06 |
| 0.0% | 14.1% | 2.70E+06 |
| 0.5% | 9.1% | 1.30E+06 |
| 0.0% | 10.4% | 8.80E+06 |
| 2.6% | 5.8% | 2.10E+06 |
| -2.9% | 18.1% | 1.90E+07 |
| 0.9% | 5.4% | 9.50E+06 |
| -2.1% | 5.3% | 672591 |
| -8.0% | 5.9% | 1.20E+07 |
| 2.0% | 4.8% | 3.80E+06 |
| -0.5% | 6.5% | 3.80E+06 |
| 0.5% | 7.8% | 1.30E+07 |
| 1.0% | 5.3% | 1.10E+06 |
| -1.0% | 6.8% | 4.60E+06 |
| 0.0% | 7.2% | 814180 |
| 0.0% | 7.1% | 6.30E+06 |
| 0.0% | 8.3% | 2.50E+07 |
| 1.0% | 7.6% | 2.80E+06 |
| 1.0% | 5.1% | 625741 |
| 0.0% | 7.8% | 8.00E+06 |
| 0.0% | 8.1% | 6.70E+06 |
| 2.5% | 4.9% | 1.90E+06 |
| 0.0% | 7.6% | 5.70E+06 |
| 0.0% | 19.5% | 563626 |
Note: Author’s analysis of data on state corporate tax rates from Serrato and Zidar (summary data here). Data on top 1 percent income shares by state from the Frank-Price-Sommeiller state income data. Data points weighted by state population in 2010.
Essentially, the only thing that seems to qualify as “highly visible in the data” regarding corporate rate cuts is that they send a lot of money to the top of the income distribution.
Enjoyed this post?
Sign up for EPI's newsletter so you never miss our research and insights on ways to make the economy work better for everyone.