In Memoriam: Lynn Williams
Lynn Williams—president of the United Steelworkers of America from 1983 to 1994—died on May 5 at the age of 89.
Lynn was an extraordinary union leader—smart, compassionate, and a visionary. His strength and creativity helped protect and expand his union through the crisis years of mass layoffs, bankruptcies, and industry consolidation. He was also an enthusiastic and loyal supporter of EPI from the very beginning.
I first met Lynn in the mid-1970s when he was USWA’s Secretary-Treasurer. I was involved in an effort to revive a shut down steel mill in Youngstown, Ohio under worker and community ownership. The Steelworkers in Youngstown were of course totally supportive, but there was skepticism and even some hostility from the international union in Pittsburgh. But Lynn saw something important in the effort, and he helped steer me through some political land mines.
The Youngstown project failed, but the idea did not. And when Lynn became union president he aggressively and successfully used worker ownership—including seats on company board of directors—to negotiate agreements that kept at least 25 steel companies from disappearing.
The President Has This One Exactly Right: Cutting Corporate Taxes Should Not Be a Priority, but Extending Unemployment Insurance Should Be
Today (or possibly tomorrow) the House of Representatives will vote on H.R. 4438, which would permanently extend and expand the research and development tax credit. But unlike every other piece of legislation sponsored by the House GOP, this bill does not offset the $156 billion 10-year price tag. Apparently, tax cuts for corporations are such a high priority that passing them does not require the sacrifice elsewhere in spending or taxes that the House GOP demands for every other fiscal change. This flies in the face of everything the House GOP has done in this Congress. Last month, for example, House Republicans themselves passed a budget resolution that required offsetting with other revenue measures any tax extenders that were made permanent.
H.R. 4438 will cost 15 times more than the proposed extension of emergency unemployment benefits, which House Republicans insist be offset. And it is more than double the discretionary funding increases in the Bipartisan Budget Act of 2013, all of which were offset. President Obama has rightfully issued a statement that he would veto this bill if it passes.
House Republicans are making their priorities clear by rushing to make business tax cuts permanent without offsets and calling for raising taxes on millions of working families and students by letting important improvements to the Earned Income Tax Credit, Child Tax Credit, and education tax credits expire. Not to mention failing to reverse the cut-off of extended unemployment benefits at a time when long-term unemployment remains higher than it has ever been in the past when extended benefits were ended. If the House GOP were truly concerned about long-term fiscal challenges, then they would offset tax breaks by permanently closing other tax loopholes.
No Sign of Labor Shortages in Construction: There are Seven Unemployed Construction Workers for Every Job Opening
The National Association of Home Builders wants you to believe their members face a serious shortage of construction workers, even though construction employment is more than 1.7 million jobs below its pre-recession peak, and unemployed construction workers outnumber job openings in construction by well over seven-to-one. More and more news stories, even in respected sources like NPR and the Wall Street Journal, repeat the builders’ talking points and toss around wage figures with very limited resemblance to reality. (A healthy dose of skepticism is in order when employers complain about high wages. How many tile setters make “$100,000 a year,” which the WSJ story suggests is now the pay for experienced workers in Denver? Not many. The median hourly wage for tile setters in Denver is less than $18 an hour, and nationally, even the 90th percentile wage for tile setters is only $73,510 a year.)
The best way to identify a tight labor market, let alone a market beset by actual labor shortages, is to examine wages. Basically, if wages aren’t rising, the labor market isn’t tightening; if they don’t rise strongly, there are no shortages. As Adam S. Posen and David Blanchflower argue in a recent paper, if wages aren’t rising, it’s a sign of labor slack, weak demand, and a weak economy.
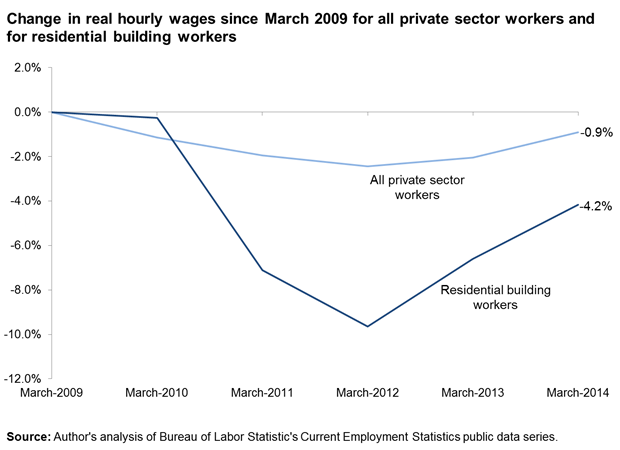
So what’s happening in residential construction? The Wall Street Journal describes a frenzied search for skilled labor, causing pay to soar “to boom-time levels and beyond.” While it’s true that construction wages have risen over the past two years, they’ve risen from such a deep depression that they are still well below the levels of 2009. In fact, the real hourly wages of residential building workers are still 4.2% below 2009, a loss significantly deeper than that of the overall private sector workforce, whose wages are 0.9 percent below 2009.
A Decidedly Weird Report
Today’s jobs report was, to say the least, strange. The first look was exciting—288,000 payroll jobs added! Now that is the kind of job growth that would get us back to a healthy labor market relatively soon. If we were to keep up this pace, we would get back to pre-recession labor market conditions by the end of 2016. Even I could live with that.
The second look was good, too—the household survey showed the unemployment rate plunged to 6.3 percent. But I should have stopped looking there, because the rest was pretty bad. It turns out the drop in unemployment was entirely due to people dropping out of the labor force. Employment in the household survey actually declined, and the labor force participation rate fell back down to its lowest point of the recovery. Our estimate of the number of “missing workers” (workers who are not working or actively seeking work but who would be if job opportunities were strong) increased to an all-time high of 6.2 million. If those missing workers were in the labor force looking for work, the unemployment rate would be 9.9 percent instead of 6.3 percent.
So this was one of those cases where the two surveys were telling completely different stories—the establishment survey was strong, the household survey was weak. As always, when the two surveys tell different stories, the rule of thumb is to place much more weight on the payroll survey, since it is larger and less erratic. But the weak household survey certainly dampens the fun of the payroll survey. If the economy really were entering a new stage of much stronger job growth, I’d expect both surveys to regularly be posting strong gains. That was far from the case in April.
The African American Labor Force Shows Remarkable Resilience
Today’s jobs report brings some positive news to balance the disappointing first quarter estimates of GDP growth (a meager 0.1 percent) announced earlier this week; there were 288,000 jobs added in April. At the same time, the unemployment rate fell to 6.3 percent, but this decline was entirely the result of people leaving the labor force, not people finding work. While all major race and ethnic groups experienced a similar pattern of declining unemployment rates and labor force participation rates in April, there are some interesting insights into the upward trend in the black-white unemployment rate gap to be gained from today’s numbers.
As unemployment rates have gradually declined over the last four years, the black-white unemployment rate ratio has been increasing and is currently higher than it was before the recession, meaning that there’s been less improvement in the black unemployment rate than the white rate. Indeed, the African American unemployment rate remains 3.3 percentage points higher than the 2007 average while the white unemployment rate is just 1.2 percentage points higher than in 2007.
Further, when we look at the difference between the current and 2007 employment-population ratios, we find that the decline in the share of employed working age adults in the population was greater for African Americans (down 4.6 percentage points) than for whites (down 3.9 percentage points).
Number of Missing Workers Jumps to All-Time High
After a few months of the labor force participation rate (LFPR) showing what was hopefully early signs of strength, it dropped back down to its low of the recovery in March. The biggest drops in labor force participation in March were among young workers; the LFPR of workers under age 25 dropped 1.3 percentage points, from 55.6 percent to 54.3 percent. (However, these series are erratic due to small sample sizes, and the April decline in the under-25 LFPR was simply a reversal of its jump up in March.) The biggest drop in LFPR in April was among men under the age of 20. To my knowledge, data on unemployment insurance exhaustions by age don’t exist, but it is unlikely that young workers are a big proportion of exhaustions. This means that the April drop in labor force participation is likely not being driven by the expiration of federal unemployment insurance benefits last December as some have suggested, but simply by the weak labor market.
There is currently an all-time-high of 6.2 million missing workers (potential workers who are neither working nor actively seeking work due to the weak labor market). Almost a quarter of them (1.4 million) are under age 25. The figure below shows that the unemployment rate for young workers would be 18.4 percent instead of 12.8 percent if the missing young workers were in the labor force looking for work and thus counted as unemployed.
For a complete picture of the labor market prospects facing the new cohort of young adults graduating from high school and college this spring, see the Class of 2014 report released yesterday. It includes, for example, a detailed discussion of the finding that there is little evidence that today’s missing young workers are “sheltering in school”.

Are Today’s Minimum Wage Workers Worth Less?
Sen. Mike Enzi (R-WY) is a nice, older man who remembers the years of his youth with a golden glow. His father owned a shoe store, so Enzi had a comfortable life. He went to college and eventually took over his dad’s business. He says he was paid the minimum wage when he started out as a “stock boy,” so he ought to have some empathy for minimum wage workers today, many of whom don’t have business owners for fathers and have to support themselves and other family members, as well.
But instead, Enzi voted against raising the minimum wage in the U.S. Senate yesterday. In fact, he voted against even bringing the issue up for debate. He doesn’t think today’s minimum wage workers are worth as much as he was. Back in 1963, when Enzi was 19, the minimum wage was $1.25, which would be $9.65 today. Enzi doesn’t want to debate a bill to raise the minimum from $7.25 an hour, apparently believing that he was worth $2.40 an hour more than today’s minimum wage workers, many of whom are in their thirties, veterans, or parents. More than 40% of those who would benefit from an increase to $10.10 an hour have been to college and have more education than Enzi did when he earned the minimum wage.
Why doesn’t Enzi think these workers are worth as much as he was? As Paul Whitfield reports in the Los Angeles Times, Sen. Enzi says today’s workers “don’t know how to interrupt their texting to wait on a customer.” Really? More than half of the workers who would benefit from a raise to $10.10 an hour are over 30, and more than 1 in 10 are at least 55 years old.
Whether from scorn or simple lack of empathy for their fellow citizens, Enzi and his fellow Republican senators who have voted against helping the long-term unemployed, voted to cut families off food stamps, or voted to deny workers an increase in the minimum wage to the level of purchasing power Enzi received 50 years ago are consistent in pulling up the ladder of opportunity after climbing it themselves—or after having been set at the top by family circumstances. From way up there in the one percent, the people at the bottom apparently look undeserving.
EPI Stands By the Rigorous Methods and Findings of Its Report on Privately Run Charter Schools and the Rocketship Company
Last week EPI published the report Do Poor Kids Deserve Lower-Quality Education Than Rich Kids? Evaluating School Privatization Proposals in Milwaukee, Wisconsin, authored by University of Oregon associate professor Gordon Lafer, an EPI research associate. The paper includes a detailed examination of a “blended learning” model of education that replaces teachers with online learning for part of the school day, long a source of controversy in education policy debates. This approach is exemplified by the Rocketship chain of charter schools, which is being promoted for expansion in Milwaukee.
EPI maintains the highest standards of rigorous research, and this report is no exception. Dr. Lafer’s description of Rocketship’s model was largely based on Rocketship’s own corporate documents, which were cited repeatedly in the report. In addition, the author interviewed Rocketship representatives both in Milwaukee and at the company’s national headquarters, including several top executives.
After the report was published, the author emailed a copy to Rocketship executives, inviting their comment and specifically asking them to identify any particular facts in the report they might believe to be incorrect.
While Rocketship responded by issuing a statement denouncing EPI’s report, the statement is a recitation of talking points rather than a rebuttal of the report’s rigorously researched and meticulously documented findings. Indeed, the company has not identified a single inaccurate fact in the report. Further, neither this report nor EPI as an organization is opposed to charter schools per se; indeed, the report concludes with proposals for accountability standards that would allow charter schools to function on an equal footing with public schools.
What to Watch on Jobs Day: Will the Number of Missing Young Workers Decline Again?
There are currently nearly one million “missing workers” under the age of 25. (In total, there are 5.3 million missing workers, who are neither working nor actively seeking work due to the weak labor market.) In March, the total number of missing workers dropped substantially, due almost entirely to an increase in the labor force participation of workers under the age of 25, particularly men. It turns out that the March increase in labor force participation of young men simply partially reversed a five-month slide, and their labor force participation remains far below its long-run trend. However, what happens with the labor force participation of young men in April will help clarify whether the March increase was a real step in the right direction or just a one-month fluke in a volatile series.
The figure below shows the number of missing young workers (men and women combined). There is a great deal of volatility month-to-month, so looking at the long-run trend is crucial. The number of missing workers under age 25 shot up to 1.6 million between early 2007 and early 2010, and then fluctuated around that level for a year-and-a-half, before declining to its current level of 950,000 (580,000 men and 370,000 women). I should note that this calculation takes into account long-run trends in labor force participation, such as lower labor force participation of young people due to increasing college enrollment over recent decades. (The methodology for calculating the number of missing workers is described here.) But it is also true that today’s missing young workers have not been able to “shelter in school” from the labor market effects of the Great Recession. Increases in college and university enrollment rates between 2007 and 2012 were no greater than the increases seen before the recession began—and since 2012, college enrollment rates have dropped substantially. This is discussed in more depth in my latest paper, on the class of 2014.
Missing workers* under age 25, January 2006–March 2014
| Missing workers | |
|---|---|
| Jan-2006 | 230,000 |
| Feb-2006 | -20,000 |
| Mar-2006 | 70,000 |
| Apr-2006 | 150,000 |
| May-2006 | 60,000 |
| Jun-2006 | 0 |
| Jul-2006 | 50,000 |
| Aug-2006 | -160,000 |
| Sep-2006 | 110,000 |
| Oct-2006 | -40,000 |
| Nov-2006 | -120,000 |
| Dec-2006 | -200,000 |
| Jan-2007 | -120,000 |
| Feb-2007 | 50,000 |
| Mar-2007 | 90,000 |
| Apr-2007 | 380,000 |
| May-2007 | 570,000 |
| Jun-2007 | 230,000 |
| Jul-2007 | 420,000 |
| Aug-2007 | 710,000 |
| Sep-2007 | 200,000 |
| Oct-2007 | 300,000 |
| Nov-2007 | 160,000 |
| Dec-2007 | 290,000 |
| Jan-2008 | 140,000 |
| Feb-2008 | 560,000 |
| Mar-2008 | 530,000 |
| Apr-2008 | 350,000 |
| May-2008 | -80,000 |
| Jun-2008 | 190,000 |
| Jul-2008 | 210,000 |
| Aug-2008 | 300,000 |
| Sep-2008 | 270,000 |
| Oct-2008 | 360,000 |
| Nov-2008 | 620,000 |
| Dec-2008 | 470,000 |
| Jan-2009 | 760,000 |
| Feb-2009 | 500,000 |
| Mar-2009 | 630,000 |
| Apr-2009 | 540,000 |
| May-2009 | 660,000 |
| Jun-2009 | 670,000 |
| Jul-2009 | 770,000 |
| Aug-2009 | 940,000 |
| Sep-2009 | 1,170,000 |
| Oct-2009 | 1,410,000 |
| Nov-2009 | 1,360,000 |
| Dec-2009 | 1,460,000 |
| Jan-2010 | 1,640,000 |
| Feb-2010 | 1,510,000 |
| Mar-2010 | 1,470,000 |
| Apr-2010 | 1,240,000 |
| May-2010 | 1,400,000 |
| Jun-2010 | 1,680,000 |
| Jul-2010 | 1,540,000 |
| Aug-2010 | 1,360,000 |
| Sep-2010 | 1,610,000 |
| Oct-2010 | 1,440,000 |
| Nov-2010 | 1,370,000 |
| Dec-2010 | 1,650,000 |
| Jan-2011 | 1,460,000 |
| Feb-2011 | 1,570,000 |
| Mar-2011 | 1,480,000 |
| Apr-2011 | 1,580,000 |
| May-2011 | 1,700,000 |
| Jun-2011 | 1,720,000 |
| Jul-2011 | 1,780,000 |
| Aug-2011 | 1,480,000 |
| Sep-2011 | 1,370,000 |
| Oct-2011 | 1,220,000 |
| Nov-2011 | 1,290,000 |
| Dec-2011 | 1,380,000 |
| Jan-2012 | 1,600,000 |
| Feb-2012 | 1,390,000 |
| Mar-2012 | 1,470,000 |
| Apr-2012 | 1,520,000 |
| May-2012 | 1,410,000 |
| Jun-2012 | 1,310,000 |
| Jul-2012 | 1,310,000 |
| Aug-2012 | 1,690,000 |
| Sep-2012 | 1,480,000 |
| Oct-2012 | 1,220,000 |
| Nov-2012 | 1,220,000 |
| Dec-2012 | 1,210,000 |
| Jan-2013 | 1,110,000 |
| Feb-2013 | 1,300,000 |
| Mar-2013 | 1,510,000 |
| Apr-2013 | 1,320,000 |
| May-2013 | 1,300,000 |
| Jun-2013 | 1,040,000 |
| Jul-2013 | 1,190,000 |
| Aug-2013 | 1,350,000 |
| Sep-2013 | 1,080,000 |
| Oct-2013 | 1,270,000 |
| Nov-2013 | 1,300,000 |
| Dec-2013 | 1,290,000 |
| Jan-2014 | 1,360,000 |
| Feb-2014 | 1,480,000 |
| Mar-2014 | 950,000 |
* Potential workers who, due to weak job opportunities, are neither employed nor actively seeking work, and are thus not reflected in the unemployment rate
Source: Authors' analysis of Toossi (2007) and Current Population Survey public data series
Paul Ryan Still Doesn’t Understand the Scale of the Poverty Problem
Earlier today, House Budget Committee Chair Paul Ryan (R-Wis.) continued his study of poverty with a hearing entitled, “A Progress Report on the War on Poverty: Lessons from the Frontlines.” Featuring witnesses from several poverty-fighting non-profits, Rep. Ryan styled the hearing as a “listening exercise” to hear about the strategies these charities and non-profits use to help alleviate poverty on the local level.
While it is admirable that Rep. Ryan gave a platform for community leaders to share their stories, he seems to have no sense of the scale of the problem before him. Indeed, Rep. Ryan’s veneration for the work of private charity is quite the contrast with his opinion of the federal government’s anti-poverty programs, which he has disparaged as “duplicative,” “complex,” and “ineffective.” However, for as much good work as it does, private philanthropy has well-known biases, as charitable donations tend to flow disproportionately to more glamorous causes, and often dry up during business cycle downturns—just when they’re needed most. In short, while individual charities and non-profits do incredible work to help our communities, they lack the ability to create widespread change; only the federal government has the resources to help alleviate poverty at the scale that is required.
Austerity’s Legacy: GDP is Far Below Potential, and Not Climbing
Today’s GDP report was, not to get too technical, just crummy nearly across-the-board. Consumption spending was up, but the personal savings rate fell, meaning that the increased consumer spending was not financed by good wage and income growth, but by reducing savings. Exports fell sharply (hard to blame on bad U.S. weather) while most categories of investment fell as well. Core price deflators also ticked down again, signaling that economic slack is surely not shrinking.
One of the only bright spots in the report was that government spending is shifting from a large drag on growth to roughly neutral. This is what qualifies as decent news in today’s low expectations economy, I guess. We’ve tried to illustrate the historically large drag that austerity has put on the current recovery, in a bunch of ways. Here’s another try.
The figure below shows the simple percentage point contribution to GDP growth from government spending. Two things stand out.

Proposed Cuts to Detroit Pensions No Cause for Rejoicing
The tentative deal reached between Detroit Emergency Manager Kevyn Orr and the Detroit pension funds has been characterized in the New York Times and other news reports as a victory for workers and retirees. This is true only in the sense that much worse cuts had been threatened.
The confusion stems from a tendency to treat cost-of-living adjustments (COLAs) as icing on the cake rather than necessary for subsistence, when in fact workers would be better off with equivalent across-the-board cuts than an erosion in the real value of benefits. COLA cuts take a bigger bite as retirees age and face dwindling savings and higher out-of-pocket health costs (exacerbated, in this case, by proposed cuts to retiree health benefits).
The deal would initially cut the pensions of general employees by 4.5 percent and eliminate these workers’ 2.25 percent annual COLA. Police and firefighters would see no initial cuts and would retain a 1 percent annual COLA. Though the uniformed services face a smaller cut in percentage terms (a reduction of roughly 15 percent in real lifetime benefits as shown in the table below), they lose more in dollar terms because they tend to retire younger and have larger pensions. Because Detroit police and firefighters aren’t covered by Social Security, their real incomes in retirement may be nearly as affected as those of general employees, who face larger cuts in percentage terms but at least will receive inflation-adjusted Social Security benefits.
Get Rid of Job Killing Tax Extenders; Pay For the Rest
The House Ways and Means Committee plans to mark up six bills tomorrow that would make six temporary tax breaks—part of an annual tax extenders package—permanent. The justification being given for making these provisions permanent is they will “help businesses grow the economy and create jobs.” The resulting permanent increase in budget deficits, however, could eventually reduce economic growth and job growth if the debt-to-GDP ratio becomes large enough.
More importantly, two of the provisions cannot be said to boost even short-term economic growth. The CFC look-though rule (H.R. 4464) and the active financing exception (H.R. 4429) help multinational corporations avoid paying U.S. taxes and create incentives to move jobs and investments overseas. Making these two tax provisions permanent would eliminate jobs and increase budget deficits by $80 billion over the next 10 years.
The six tax provisions that Chairman Camp wants to make permanent are part of a group 50 to 60 temporary tax provisions that are routinely extended for another year or two, and which typically reduce tax revenues by about $100 billion over 10 years. Like other temporary measures, such as extending unemployment insurance for unemployed workers during times of weak labor demand, the budget cost of the tax extenders package is rarely offset. (Mr. Camp notes that paying for the tax extenders package “is not consistent with recent practice by Congress.”) But the House GOP is now demanding that a temporary extension of unemployment insurance (budget cost of about $10 billion) be fully paid for, but not the permanent extension of selected tax extenders (budget cost of $310 billion).
With this markup, committee chairman Dave Camp appears to have morphed from a serious legislator trying to piece together a revenue-neutral reform of our byzantine tax system to a politician who talks out of both sides of his mouth—he supports fiscal responsibility but is proposing to make six temporary business tax breaks permanent and in doing so increase federal deficits by over $300 billion over the next 10 years. If he were truly concerned about long-term fiscal challenges, he would offset these tax breaks by permanently closing other tax loopholes, and he would not be working to make provisions that kill jobs a permanent part of the tax code.
Three-Fourths of Job Injuries on Farms Go Unreported
Today is Workers Memorial Day, a day of remembrance for the thousands of workers who die on the job each year, and the tens of thousands whose lives are shortened by illness or disease contracted at work. It’s easy to see the dangers of construction work, or to imagine why logging would be the single most dangerous occupation. But farm work is far from most people’s minds when it comes to dangerous work. It turns out that that’s partly because so little is reported about the dangers, either to the media or to government agencies.
New research, published in the April issue of the Annals of Epidemiology, finds that approximately 77 percent of non-fatal occupational injuries and illnesses in agriculture go unreported. Such a large undercount likely results in fewer private and public resources devoted to ameliorating agricultural safety and health threats.
The Bureau of Labor Statistics’ annual Survey of Occupational Injuries and Illnesses (SOII) estimates the number and types of nonfatal injuries and illnesses within and across all industries. Injuries include fractured bones, lacerations, severed body parts, and head trauma; illnesses include asthma, chronic obstructive pulmonary disease, and cancer. The SOII estimated there were 19,700 injuries and illnesses for crop farms and 12,400 for livestock farms in 2011. My colleagues and I estimated that the numbers of cases was actually 74,932 and 68,504, respectively, which means the SOII undercounted by 74 percent and 82 percent.
A Million Veterans Would Benefit from a Minimum Wage Increase
We ask a lot of our armed forces. They serve our country in some of the most dangerous environments and difficult situations faced by any American. Yet having endured those experiences, too many veterans returning to civilian jobs find themselves in work that barely pays enough to live on. In fact, of the roughly 10 million veterans working in America today, 1 in 10—that’s one million veterans—is paid wages low enough that they would receive a raise if the federal minimum wage were increased to $10.10 per hour, as proposed in the Fair Minimum Wage Act of 2013.
Months ago, we released an analysis showing that increasing the federal minimum wage to $10.10 would lift wages for 27.8 million workers nationwide. The one million veterans that would benefit from such an increase are a relatively small segment of this larger group, but the fact that a million former service members would benefit from raising the minimum wage should dispel the persistent myth that raising the minimum wage only benefits teenagers and students from affluent families. Not only is this an inaccurate description of the typical low-wage worker, but the veterans that would get a raise look nothing like this affluent teen stereotype and are, in some ways, noticeably different from the larger population of would-be beneficiaries from a minimum-wage increase. (See the table below for details, or click here for a pdf.)
New BLS Data Show College Enrollment Rates of Recent High School Grads Have Been Dropping Since 2009
In this recent post, I pointed out that after increasing for decades, college enrollment rates have dropped since 2012. The data in that post are college/university enrollment rates for people age 20-24—I used those ages because they are very easy to get from the BLS site.
This morning, BLS released their annual report on college enrollment and work activity of recent high school grads. The figure shows college enrollment of recent high school graduates (specifically, it’s the college enrollment rate in October 2013 of people age 16-24 who graduated from high school earlier the same year). The data are volatile year to year, but they show that college enrollment of brand new high school graduates has been dropping since 2009. This is a worrisome trend, particularly to the extent that it is due to students being unable to enter college because the lack of decent work in the weak recovery meant they could not put themselves through school or because their parents were unable to help them pay for school due to their own income or wealth losses during the Great Recession and its aftermath. Falling college enrollment indicates that upward mobility may become more difficult for working class and disadvantaged high school graduates.
In a couple weeks, we will release our annual “Class of …” report, which will detail the labor market prospects of new high school and college graduates. (Here is last year’s report.) In this report, we investigate the drop in enrollment, including the fact that dropping enrollment rates at a time when employment is not increasing very strongly means that a larger share of young people are “disconnected”—i.e. not enrolled and not employed. This represents an enormous loss of opportunities for this cohort that will have long-term scarring effects on their careers.

A Key Lesson From Piketty: You Can’t Reverse Inequality or Provide Broad-Based Prosperity While Ignoring the Top 1 Percent
EPI was lucky enough to co-host the first American event for Thomas Piketty to discuss his new book Capital in the Twenty-First Century (video from the event is online if you missed it). Piketty’s book is getting justly deserved praise, and his work suggests a dizzying array of political and policy implications.
Chief among them is something that remains surprisingly controversial, even among those genuinely concerned with the rise in American inequality: the idea that ameliorating this inequality and providing decent living standards growth, for the bottom and middle requires braking income growth at the very top.
The logic is pretty simple: given overall income growth, more income being claimed by the very top must necessarily come at the expense of families at the bottom and middle. So, when the top 1 percent’s share of income doubled between 1979 and 2007, this meant that there was much less room to provide income growth to the bottom and middle. The objection to this logic is, of course, that income growth is not given, and attempts to steer more income growth away from the top and towards the bottom and middle would have just led to slower overall growth.
But there are plenty of reasons to doubt this. Let me start with an appeal to authority: Piketty put it pretty bluntly in the EPI/WCEG event yesterday, saying “we don’t need 19th century inequality to generate 21st century growth.” And, appealing to the same authority, but this time relying on empirical evidence, Piketty and co-authors have shown that cutting taxes for the top 1 percent actually increases their own pre-tax income growth and reduces income growth at the bottom.
Thinking About Death and Taxes on April 15
“’Tis impossible to be sure of any thing but Death and Taxes” -Christopher Bullock, The Cobler of Preston, 1716
“Things as certain as Death and Taxes” -Daniel Defoe, The History of the Devil, 1727
“[N]othing can be said to be certain, except death and taxes” -Benjamin Franklin, Letter to Jean-Baptiste Leroy, 1789
Every year on Tax Day, there are always jokes about death and taxes, and questions on which one is preferable. (For example, recall the character in the Hitchhiker’s Guide to the Galaxy series—Hotblack Desiato—who spent a year dead for tax purposes.) Almost no one, however, talks about the group of taxpayers who worry about neither death nor taxes: corporations.
By the end of the day, almost every individual taxpayer will be reminded of the certainty of taxes (while death has been postponed for another year). 30 percent of taxpayers fall into the 15 percent tax bracket. They can expect to pay about $3,000 in federal income taxes, on an adjusted gross income of almost $50,000. (This does not count the all the other taxes paid such as Social Security payroll taxes and state and local income taxes.) These taxpayers face a 15 percent statutory tax rate and paid a bit over 6 percent of their AGI in federal income taxes.
Thomas Piketty and Tax Day
This morning, EPI will welcome economist Thomas Piketty to lead a panel discussion on wealth, income, and inequality. The event will be live-streamed here.
In his much talked-about book “Capital in the Twenty-First Century,” recently translated from the original French and currently a New York Times best-seller, Piketty argues that without dramatic policy changes—conducted cooperatively across international borders—wealth inequality in developed countries will only continue to increase.
One such policy change that Piketty has endorsed—and one that is quite pertinent on Tax Day—is a major increase in the top marginal income tax rate. Along with co-authors Emmanuel Saez and Stefanie Stantcheva, Piketty has written that the revenue-maximizing top tax rate is 83 percent, more than double today’s top rate here in the U.S.
Dramatically increasing the top rate is a proposal EPI has previously supported. In the context of base-broadening tax reform that aims to increase both federal revenue and tax progressivity, raising rates makes even more sense. Indeed, raising rates can be seen as a complement to, not a substitute for, broadening the base. As the tax code squeezes out opportunities for tax avoidance schemes, the revenue-maximizing top rate would increase because high-income households would have fewer chances to change their behavior in such a way as to lessen their tax liability.
Additional federal revenue is clearly needed. Even as the federal deficit continues to fall in the near term, the major parts of the federal budget (Social Security, federal health care programs, defense) continue to increase in cost, squeezing priorities like education and infrastructure to a smaller and smaller slice of the pie. Worse, Congress looks to be actively searching for ways to give the additional revenue garnered in the deal to avert the “fiscal cliff” away, mostly to corporations. Meanwhile, what individuals pay in taxes remains extremely low, compared to historic standards.
So on this Tax Day, let’s see if we can take a lesson from EPI’s guest speaker Thomas Piketty and talk about a tax policy that usually goes unmentioned—the need for tax reform that broadens the base and raises the rates.
The Gender Gap on Television
Media Matters for America released a report this week showing that only a handful of female economists appeared on evening cable news shows in the last 12 months. They found that more than 90 percent of the economists that appeared on television in the past year were men.
EPI has five outstanding female economists: Emma Garcia, Elise Gould, Monique Morrissey, Heidi Shierholz and Valerie Wilson. All have PhDs and all are terrific at explaining the economy.
EPI experts both male and female do get interviewed very often—which shows just how helpful EPI research can be. Heidi Shierholz recently discussed the incredibly hard odds for job seekers with Marketplace’s Sabri Ben-Achour, drawing on her analysis that shows that job seekers outnumbered job openings by 2.5-to-1 in February.
It’s easy to see how Heidi’s analysis made this story come alive. Now we just need to convince more television producers.
Something To Keep An Eye On: College Enrollment Has Dropped Substantially Since 2012
Here is some surprising and unpleasant news: enrollment rates have dropped in each of the last two years, a sharp divergence from several decades of growth. The figure below shows enrollment rates in the first quarter of every year since 1985 for people age 20-24. (Note: enrollment here is technically for college, university, or high school enrollment, but very few people age 20-24 are enrolled in high school.) Enrollment was on a general upward trend since 1985, but peaked in 2012 and has since dropped in each of the last two years. The fact that this is a two-year drop suggests that it isn’t just a one-year fluke in a volatile series.
The dotted line shows the linear trend based on 1989-2007 data (the trend line since 2007 thus shows what enrollment rates would have been in the last seven years if they had simply continued on their long-run path over this period). The data are somewhat variable year-to-year, but this shows that between 2007 and 2013, there was no meaningful departure from the long term trend, but that by 2014, enrollment was substantially below the long-run trend. This drop in enrollment rates is worrisome, particularly to the extent that it is due to students being forced to drop out of school, or never enter, either because the lack of decent work in the weak recovery meant they could not put themselves through school or because their parents were unable to help them pay for school due to their own income or wealth losses during the Great Recession and its aftermath.
The Maryland Minimum Wage Increase Is a Strong Accomplishment, but Not Without Some Failings
The Maryland state legislature took an important step Monday toward restoring the value of an honest day’s work, by raising the state minimum wage to $10.10 per hour. I’ve estimated that this increase will lift wages for nearly half a million Maryland workers, and spur an additional $456 million in otherwise unrealized output for the Maryland economy. Maryland is now the second state to raise its minimum to $10.10 per hour, matching the level set by Connecticut last month. Maryland joins 23 other states, plus the District of Columbia, that will have minimum wages higher than the federal minimum wage of $7.25 by next year. It will also join 7 other states, plus the District of Columbia, that will have minimum wages higher than $9 per hour by 2017.
While the Maryland bill is unquestionably a step in the right direction—and a praiseworthy accomplishment for all those that worked toward its passage—the final version of the bill does have a number of shortcomings that should not be overlooked.
Inflation is always eating away at the purchasing power of the dollar, so any time the minimum wage is raised in stages over several years, the purchasing power of the eventual wage is less (in real terms) than the proposed nominal dollar value. In the Maryland minimum wage proposal’s original conception, the bill would have raised the state minimum wage to $10.10 by July of 2016. Taking account for projected inflation over the next three years, this would have been equal to a minimum wage of about $9.67 in today’s dollars. Unfortunately, legislators chose to stretch out the increases over a longer period of time, thereby reducing the real value of the eventual increase. The bill that was passed will reach $10.10 by July 2018—a projected real value of $9.25 in today’s dollars. This may not seem like a big difference, but for a full-time minimum wage worker, it’s a loss of about $875 in real annual income.
Long-Term Unemployment Is Elevated Across All Education, Age, Occupation, Industry, Gender, And Racial And Ethnic Groups
Today’s Economic Snapshot shows that long-term unemployment is elevated for workers at every education level. The table below provides additional breakdowns of long-term unemployment by age, gender, race/ethnicity, occupation, and industry. For each category, the table shows the long-term unemployment rate in 2007, the long-term unemployment rate in 2013, and ratio of the two. It demonstrates that while there is considerable variation in long-term unemployment rates across groups—which is always true, in good times and bad—the long-term unemployment rate is substantially higher now than it was before the recession started for all groups. The long-term unemployment rate is between 2.9 and 4.3 times as high now as it was six years ago for all age, education, occupation, industry, gender, and racial and ethnic groups. Today’s long-term unemployment crisis is not at all confined to unlucky or inflexible workers who happen to be looking for work in specific occupations or industries where jobs aren’t available. Long-term unemployment is elevated in every group, in every occupation, in every industry, at all levels of education.
As Congress Votes on Budget Proposals, It Is Also Voting on Whether It Understands the Economy
Later today and tomorrow, the House of Representatives will consider and vote on six different budget proposals—those put forth by the House leadership of both the Democratic and Republican parties, as well as by the Obama administration, the Congressional Progressive Caucus (CPC), the Congressional Black Caucus, and the Republican Study Committee.
We already know that only the Republican budget, authored by House Budget Committee Chair Paul Ryan (R-Wisc.), will pass in the House—and even then, it won’t become law—but it is still important to understand what these proposed budgets call for. While it’s true that a budget proposal is a statement of values, it is also the reflection of its supporters’ understanding of the economy.
The chart below shows the cuts and increases to various parts of the budget, as called for by the proposals made by Chairman Ryan, House Budget Committee Ranking Member Chris Van Hollen (D-Md.), and the CPC. Chairman Ryan includes deep cuts to just about every budget function, and doubles down on the unspecified sequester cuts. Rep. Van Hollen’s budget gets rid of the onerous sequestration spending cuts but otherwise primarily stays the course. Meanwhile, the CPC’s budget calls for immediate stimulus spending in order to meet its stated goal of returning the economy to full employment over the next three years.
Equal Pay Transparency
In honor of Equal Pay Day, my colleagues Heidi Shierholz and Hilary Wething suggest a number of ways to close the pay gap between men and women, including raising the minimum wage, enacting mandatory paid leave, helping workers unionize, shoring up employment law enforcement, enacting immigration reform, and passing the Paycheck Fairness Act. I would add another modest idea: requiring employers to disclose relative pay rankings so workers can tell if they are paid more or less than comparable workers. This would allow future Lilly Ledbetters to quickly find out if they are being discriminated against. Like Heidi and Hilary’s suggestions, it would also put upward pressure on the pay of all lower-paid workers rather than closing the pay gap by dragging down the wages of lower-paid men.
Employers will likely cite privacy concerns and administrative costs as reasons to oppose such a measure. But the law need not require that actual wages or salaries be disclosed, just relative rankings. In any case, Congress has already placed more onerous burdens on unions, who have to disclose employee compensation in excruciating detail. You can also look up the pay of congressional staff, White House staff, and the highest-paid nonprofit employees, among others. Since the American Enterprise Institute recently used pay disclosure to tweak the White House, maybe they can join forces with us on this effort.
In the meantime, President Obama is taking meaningful steps in the right direction, signing two executive orders today that ban federal contractors from retaliating against employees who discuss their pay and requiring them to provide the government with data on employee compensation by sex and race.
Equal Pay Day: A Reminder that Women (and Men!) Deserve More
Today is Equal Pay Day, a reminder that women and men are not always compensated at the same rate. While the widely reported statistic that women, on average, earn 77 cents to every man’s dollar has been is a great indicator that women are put in situations every day that for a variety of reasons mean they earn less, it has been criticized for not measuring individuals of similar characteristics, such as age, occupation, education, or experience. To try to get a better understanding of the gender wage gap among specific age groups, and given that many high school and college seniors are on the brink of graduating and entering the labor force, I thought it would be interesting look at the gender wage gap by age and education, to see how women and men fare as they enter today’s unsteady labor market.
The figures below show the entry-level wages of young college and high school graduates, as they appear in a presentation my colleague, Elise Gould, gave for a recent Senate Briefing on the Equal Rights Amendment (check it out! It’s a really good overview of the gender wage gap at various points in the wage distribution, and documents the gender wage gap by age and education). Both figures show the progress recent high school and college educated young women have made in closing the gender wage gap. In 1979, women with a high school degree made 74 cents to their male counterpart’s dollar, and women with a college degree made 79 cents. By 2013, the gap has narrowed for both groups: both high school and college educated entry-level working women make 84 cents to a man’s dollar.
To close the gender wage gap, women need to see real wage growth faster than their male counterparts. The best type of narrowing occurs when both women and men see real annual wage growth. It is possible for the gender wage gap to close because women see real wage increases, while men’s wages stagnate, but this isn’t the good kind of narrowing.
On the whole, college educated women have experienced the good closing of the gender wage gap. Between 1979 and 2013, both young college educated men and women wages saw real wage growth, but women’s wages grew slightly faster than their male counterparts (although neither groups experienced wage growth throughout the 2000s).

Conversely, the narrowing of the wage gap for high school graduate men and women occurred for all the wrong reasons. Both men and women saw real wage declines over the 1979-2013 period; high school men make 27.5 percent less in 2013 than they did in 1979, and high school women make 16.6 percent less. Because high school educated men fared much worse than their female counterparts, the gender wage gap narrowed.

We should be defining success in closing the gender wage gap by women catching up to men while both men and women share in overall growth. Congress has some great tools at their disposal to do this. Passing the Paycheck Fairness Act would be a great first step. In addition to prohibiting wage discrimination among women and men, the Paycheck Fairness Act incentivizes greater transparency between employers and employees, by collecting pay information data and providing information on how to reduce pay disparities for employers and labor organizations.
Similarly, President Obama’s executive orders to prohibit federal contractors from punishing employees for discussing their pay, and to require that contractors provide data on their employees’ compensation, will effectively provide greater transparency between employees and employers regarding pay rates. Greater transparency will in turn help employees advocate for equal pay, and fairly and substantively shift bargaining power towards employees to set stronger wage standards—ultimately closing the gender wage gap in a productive and fair way.
How to Make the Labor Market Work for Women
Today is Equal Pay Day, which means that policymakers, including the president, are talking about how to close the gender wage gap. In 2013, the typical female worker made $15.10 an hour, while the typical male worker made $18.11 an hour. And the gap in wages between women and men extends beyond those at the middle; it affects earners at all wage levels. High-wage women make less than high-wage men, and low-wage women make less than low-wage men.
A key backdrop to any discussion of how gender wage gaps have evolved is the fact that since the 1970s, the country has seen dramatically rising wage inequality among both men and women. Between 1979 and 2013, the median woman’s wages grew 21.7 percent, but the 95th percentile woman saw her wages grow more than three times that fast, while the 10th percentile woman saw her wages decline. Among men, high-wage workers also saw strong growth—the 95th percentile man saw his wages grow 40.1 percent over this period—but the entire bottom 60 percent of the male wage distribution saw wage losses. The forces holding back wage growth for low- and moderate-wage men—factors such as declining unionization, the erosion of other labor standards and institutions, the lack of full employment, trade agreements that eroded labor standards, and skyrocketing executive and finance professional pay that left less for everyone else—were also holding down the wage growth of low- and moderate-wage women. However, gains made by women over this period in educational attainment, work experience, and occupational upgrading (i.e., moving into higher-paying occupations) more than overcame these adverse forces (at least until the last decade, when the entire bottom 60 percent of female wage earners also saw wage losses).
How has the gender wage gap evolved over time? In short, while still large, it is smaller than it used to be. In the late 1970s, after a long period of holding fairly steady, the gap in wages between men and women began improving as women’s gains in education, work experience, and occupational upgrading, along with greater legal protections against discriminatory pay, began boosting their pay. Since the 1970s, the gender wage gap has improved at all parts of the wage distribution, meaning that low-wage, middle-wage, and high-wage women all saw stronger wage growth over this period their male counterparts.
Third Way’s Surprising Retirement Proposal
After getting into hot water for criticizing Sen. Elizabeth Warren for wanting to expand Social Security, self-styled centrist Democrats Jonathan Cowan and Jim Kessler of Third Way are testing the retirement waters again by proposing, in a New York Times op-ed, to expand savings in IRAs.
This by itself would not be blog-worthy, since every Wall Street-friendly policy wonk wants workers to put more money into IRAs. What surprised me, though, was that they propose requiring employers to contribute 50 cents per hour in these accounts. This amounts to $1,000 per year for full-time workers, and, unlike many proposals, could actually make a difference to workers’ retirement security if savings aren’t siphoned off with high fees. Cowan and Kessler’s default investment would be a low-fee lifecycle fund overseen by a Thrift Savings Plan-like board. Though TSP’s lifecycle funds, which are composed of index funds, are too aggressive—the share invested in stocks ranges from 86% to 52% during the accumulation phase—at least they’re not obvious rip-offs like many 401(k) and IRA investment options.
Cowan and Kessler take pains to assure readers that their proposal has nothing in common with President George W. Bush’s plan to privatize Social Security. But it’s not clear whether they have renounced their previous support for Social Security cuts. If not, they don’t explain why we should shrink a well-functioning social insurance system in order to expand an individual savings system that leaves families financially exposed when breadwinners die or are disabled, financial markets tank, or inflation rises. Under the Third Way plan, retirees could also outlive their savings if they opt out of the default annuity. In the end, back-door privatization may not be that much better than a frontal assault.
Larry Summers, Jeremy Stein, and the Better Off Budget
Larry Summers gave a talk earlier this week at the launch of the Full Employment project headed by Jared Bernstein of the Center on Budget and Policy Priorities (CBPP). In a reasonable, evidence-based world, his talk—and the paper he co-authored with Larry Ball and Brad DeLong for the event—would be deeply influential to policymakers.
The best summation of it is the first paragraph of the accompanying paper:
“At present and going forward, activist fiscal policy is likely to be essential for the American economy to operate near potential levels of output and employment. This conclusion is a substantial change in view from the near-consensus of economists that monetary policy alone could and should be left to carry out the stabilization policy mission, a view that prevailed for nearly a generation prior to the 2008 financial crisis”
Basically, what Summers et al. are saying is that the Federal Reserve won’t be able to engineer a full recovery from the Great Recession (a recovery that remains far from complete) with the monetary policy tools that they have at their disposal. And unless fiscal policy changes sharply from its current contractionary stance to one that supports growth and jobs, the U.S. economy could throw away years of potential income growth (totaling trillions of dollars) and consign millions of workers and families to years of completely needless economic misery.
Besides arguing that the Fed alone couldn’t generate a full recovery with the tools at its disposal, Summers also echoed a point made recently by Jeremy Stein, a member of the Fed’s Board of Governors: that these tools currently being used by the Fed to try to generate recovery—keeping interest rates extraordinarily low for an extended period of time—carry the danger of spurring financial market bubbles that would sow the seeds for the next economic downturn.
The State of Black and Brown America
This week, the Urban League released the 38th edition of its annual State of Black America report, with the theme One Nation Underemployed: Jobs Rebuild America. With an emphasis on growing economic inequality, the report features the 10th installment of the Urban League’s Black-White Equality Index, and the 5th installment of the Hispanic-White Equality Index. At the national level, these numbers tell an all too familiar story of racial economic inequality in America that persists through the ups and downs of the business cycle.
Though the recession briefly narrowed the black-white unemployment rate gap to a ratio of 1.7-to-1 in 2009, the black unemployment rate is again double the rate for whites, while the Hispanic unemployment rate has remained between 1.4 and 1.5 times higher than whites since 2007. The widening disparity between low, middle, and high incomes—i.e. increasing overall inequality—has also expanded racial income gaps, since African American and Latino households are more likely to have incomes below the national median. According to the report, black median household income is about 60 percent of that of whites (down from 62 percent before the recession) and Hispanic median household income is 71 percent of that of white households (down from 74 percent before the recession).
With the addition of a metro-level analysis of unemployment and income inequality in State of Black America 2014, a slightly more nuanced picture of racial and ethnic inequality in America emerges. Based on data from the 1-year sample of the 2012 American Community Survey, the report suggests that the state of black and brown America depends on what part of America you live in—although at least for African Americans, it’s really not all that great anywhere. According to the report’s listing of metro area unemployment rates, the black unemployment rate ranged from a low of 9.0 percent in Oklahoma City, Okla. (the only metro area with a black unemployment rate under 10 percent) to a high of 24.5 percent in Sacramento, Calif. When it comes to the income gap, at best, the median black household income has 78 cents for every dollar of white income in the Riverside, Calif. metro area.