Introducing the People’s Budget
The American economy faces two major and interrelated problems, and contrary to what one would expect given the newly resurgent cries of deficit hawks, more spending is essential to solving both.
First and foremost, the economy has still not fully recovered from the Great Recession. Since the enactment of the Budget Control Act of 2011, ongoing austerity measures have meant that now, six and a half years after the Great Recession officially ended, the economy still has some slack and demand for workers is still too low. Indeed, if public spending growth over the current recovery had simply matched that of the early 1980s recovery, the economic recovery would already be complete. Instead, pulling away fiscal support too soon led to unnecessarily depressed output and high unemployment that has persisted throughout the recovery.
But austerity hasn’t just blocked a recovery to pre-recession trends, as bad as that would be. A growing body of research strongly suggests that the decelerating productivity growth that’s shown up in economic data recently is driven in large part by the weak aggregate demand implied by austerity.
The fastest growth in wage inequality between men happened in 2015
In my new paper on trends in wages in 2015, I discuss the resurgence of the growth in inequality. The main story of 2015 wage trends is that they were very unequal—so much so that the fastest growth in wage inequality between men happened in 2015.
Wage inequality can be measured in a number of ways. For example, there’s the growth of the top 1 percent compared to the bottom 90 percent. For that, we can look at Social Security wage data and find that from 1979 to 2014, wages at the top grew nearly 150 percent, while the bottom grew less than 17 percent. That’s a really stark difference, but we don’t have data yet that would allow us to see what happened in 2015.
Using the Current Population Survey Outgoing Rotation Group (CPS-ORG), we can look at what happened to wages in 2015 at every decile and the 95th percentile (but no higher because of data limitations). There are two key ways gaps we can look at within those data limitations. One compares the middle to the bottom (the 50/10 wage ratio) and the other compares the top to the middle (the 95/50 wage ratio). In my paper, I show how the 50/10 wage ratio has been fairly steady for the last 15 years. In fact, for men, the 50/10 wage ratio for men was about the same in 2015 as it was in the late 1970s.
Durbin and Sessions agree H-1B guestworker program must be fixed to protect migrant and American tech workers
Senator Jeff Sessions (R-Ala.), a Tea Party favorite, and Senator Dick Durbin (D-Ill.), a progressive stalwart, rarely agree on immigration policy. But last week, they did. What’s the issue they agree on? The need to reform two temporary work visas, the H-1B and L-1, because corporations use them to keep wages low and indenture foreign guestworkers—and replace U.S. workers in the technology sector with those lower-paid indentured foreign workers. This isn’t the first time this kind of bipartisan agreement has happened though: last year, 10 senators from across the political spectrum, from Bernie Sanders to James Inhofe, signed on to a letter to the Departments of Justice, Homeland Security, and Labor, asking them to investigate abuses of the H-1B program.
Sessions, who chairs the Senate Subcommittee on Immigration and the National Interest, held a hearing on February 25 to highlight H-1B abuses, especially the scandal surrounding the Walt Disney Company. Disney received much attention last year after the New York Times reported on its practice of laying off American workers and forcing them to train their own replacements on H-1B visas. The hearing was a substantive discussion about what’s wrong with the H-1B program and how to fix it. (The L-1 visa, which is also abused by the same companies and for the same occupations as the H-1B, but has fewer rules and virtually no enforcement, did not get nearly as much attention.) For anyone interested in U.S. immigration policy relating to skilled workers, the hearing is well worth watching in its entirety, but a few moments are worth highlighting.
Sessions and Durbin agreed that the system is being abused, and used primarily in ways that were not originally intended. Namely, most H-1B visas are not used to fill labor shortages or to bring in the best and brightest workers from abroad, or to put them on a path to lawful permanent residence. Instead, they are mainly used by temporary employment agencies that have an offshore outsourcing business model. This means that the H-1B workers who come to work in the United States are rented out to third-party companies, learn their job, and then transfer as much of the work as they can to the foreign offices of their staffing company. These outsourcing companies get about half of the 85,000 H-1B visas that are allotted each year to for-profit firms, and data show they apply for permanent residence for only a minuscule share of their workers. That means their H-1B workers aren’t on a path to permanently benefit U.S. labor market, but instead are being used as temporary, cheap labor and constantly rotated back to their home countries.
What to watch on Jobs Day: No evidence for another rate hike
Data on employment and unemployment in February will be released this coming Friday by the Bureau of Labor Statistics. Notably, this is the last jobs official jobs data we’ll get before the Federal Reserve meets in two weeks to decide whether or not to follow up December’s quarter point interest rate increase with another rate hike.
Forecasters are expecting Friday’s report to show quite weak performance in February, driven in large part by the major snowstorms that hit the East Coast during the week when jobs data was collected. However, even aside from expected temporary weakness, Friday’s jobs report is extremely unlikely to provide any strong evidence that the December rate hike should be followed with another increase in two weeks when the Fed meets again. In fact, data since the December hike contain mixed messages at best regarding the pace of recovery.
For example, after the December rate hike, data was released showing that gross domestic product grew at less than a 1 percent annualized rate in the last three months of 2015. Other data showed that the employment cost index, a closely-watched indicator of trends in labor costs pressure, grew just 2 percent year-over-year for the last quarter of 2015. And job growth in January was 151,000, down from the average monthly rate of 228,000 that the economy saw in 2015.
There have been encouraging (but quite small) upticks in some other economic data. Retail sales were strong in January. Core price inflation as measured by the consumer price index grew year-over-year in January at 2.2 percent, the fastest rate since 2012. (though Dean Baker highlights the role of rental price inflation in driving this, and the fact that attacking rental price inflation with higher interest rates is a flawed strategy).
Inflation makes proposed minimum wage increases more modest than they appear
This November, voters in several states will consider ballot measures to raise their state minimum wages. Because all of the proposals would incrementally phase in the higher minimum wages over a period of several years, it is important to look beyond the headline dollar amounts proposed, and consider what the new minimum wages would equal for someone in today’s economy. In other words, voters should evaluate proposed minimum wages after accounting for the inflation that will likely occur as the increases are gradually implemented.
Of course, it’s impossible to know what future inflation is going to be, but a variety of forecasters in both the public and private sector do make an attempt. The table at the bottom of this post shows the schedule of proposed minimum wage changes in California (under two possible ballot initiatives), Colorado, the District of Columbia, Maine, and Washington. It also shows the value of each proposed minimum wage in constant 2016 dollars1 using three different forecasts for consumer inflation—projections for the Consumer Price Index (CPI-U) from the Office of Management and Budget (OMB), the Congressional Budget Office (CBO), and Moody’s Analytics.2
As the table shows, a $12 minimum wage in 2020—proposed in Colorado and Maine—would have a current dollar value between roughly $11 and $10.75, depending on whose projections for inflation you believe. In Colorado, where the minimum wage is currently $8.31, this amounts to a real (inflation-adjusted) increase of between 29 and 32.5 percent over the current minimum. In Maine, where the minimum wage is currently $7.50, the proposed hike amounts to an increase of roughly 43 to 47 percent after inflation.
How we can save $17 billion in public assistance—annually
This post originally appeared on TalkPoverty.org.
Note to conservatives: Want to know the best way to find savings in government assistance programs? Here’s a hint—it’s not by cutting nutrition assistance to working people who are struggling.
It’s by paying them fairly for their labor.
A new report from the Economic Policy Institute indicates that raising the federal minimum wage to $12 by 2020 would lift wages for more than 35 million workers nationwide and generate about $17 billion annually in savings to government assistance programs.
This report shouldn’t come as a surprise. In contrast to the stereotypes and lies about people with low incomes, the reality is that a majority of public assistance recipients either have a job or have an immediate family member who is working. In fact, 41.2 million working Americans—or 30 percent of the workforce—receive means-tested public assistance. Nearly half of them work full-time.
Not surprisingly, workers who receive public assistance are concentrated in jobs that pay low hourly wages, like the retail, food services, and leisure and hospitality industries. A majority (53 percent) of workers earning $12.16 per hour or less—or the bottom 30 percent of wage earners—rely on public assistance. As wages go down, the percentage of workers relying on public assistance gets higher: 60 percent of workers earning less than $7.42—only slightly higher than the $7.25 federal minimum wage—receive some form of means-tested public assistance. Overall, 70 percent of the benefits in programs meant to aid non-elderly low-income households—programs like food stamps, Medicaid, and the Earned Income Tax Credits—go to working families.
Republicans (and two Democrats) in Congress want to derail commonsense protections for workers
Dozens of Republican members of Congress and two Democrats—Collin Peterson (D-Minn.) and Brad Ashford (D-Neb.)—have signed a letter to Secretary of Labor Thomas Perez about the Department of Labor’s (DOL) proposed rule on overtime pay for salaried employees, calling on him “to reconsider moving forward with this rule as drafted.” Oddly, a good part of the letter complains about provisions that are not in the proposed rule “as drafted.” The signers should be thanking the secretary, rather than complaining.
In particular, the letter complains that even though the proposed rule makes no change in the current regulation’s “duties test,” which identifies whether an employee’s job duties are those of an executive, professional, or administrative employee who might be exempt from overtime pay, the secretary does not spell out his future intentions. The signers worry, for example, that DOL is considering a common-sense tightening of the test to limit exemptions to employees who spend most of their time engaged in exempt duties. (The current duties test allows exemption of employees who spend nearly 100 percent of their time doing routine chores such as serving customers, running a cash register, stocking shelves, sweeping floors, and cleaning bathrooms.)
But, for better or worse, that change is not in the rule “as drafted.”
Workers, and honest employers, need a strong OSHA
Every day, events remind us why Congress created and continues to fund the Occupational Safety and Health Administration (OSHA). Cranes collapsing in New York and Cincinnati, mill explosions in Georgia, a foundry worker crushed in Ohio, construction workers falling to their deaths throughout the United States. When OSHA was created in 1970, 14,000 workers were killed on the job. Today in a much larger workforce, the number of on-the-job fatalities is less than 5,000 a year. Workplaces are undeniably safer today, in large part because of the training and education OSHA has provided and required employers to provide, its grants to union and non-profit worker safety training programs, the mandatory health and safety standards and guidance it issues, and its enforcement efforts. But they aren’t safe enough. In addition to the toll of deaths, nearly 4 million work-related injuries and illnesses are reported each year, and many more go unreported.
Enforcement is essential because standards and rules mean nothing if they aren’t followed, and a stubborn minority of businesses just don’t care enough about their employees to work safely and protect them from known hazards. Even hazards we’ve known about for a thousand years are routinely ignored by greedy contractors trying to cut corners and squeeze more profit out of their employees’ work.
Nothing better illustrates why workers need a strong enforcement effort from OSHA than trenching violations, such as putting workers into ten-foot deep trenches in loose soil without shoring the sides or protecting them with a metal trench box. Year after year, two to three dozen workers are killed when trench walls cave in, burying them in tons of dirt and rock, crushing their lungs. A single cubic yard of soil can weigh up to 3,000 pounds, and a worker caught by a cave-in can die even when his heads is not buried.
The Fed shouldn’t accept the “new normal” without a fight
Federal Reserve Chair Janet Yellen is testifying before Congress today and tomorrow, where she will be fielding questions about the state of the economy following the Fed’s recent rate hike.
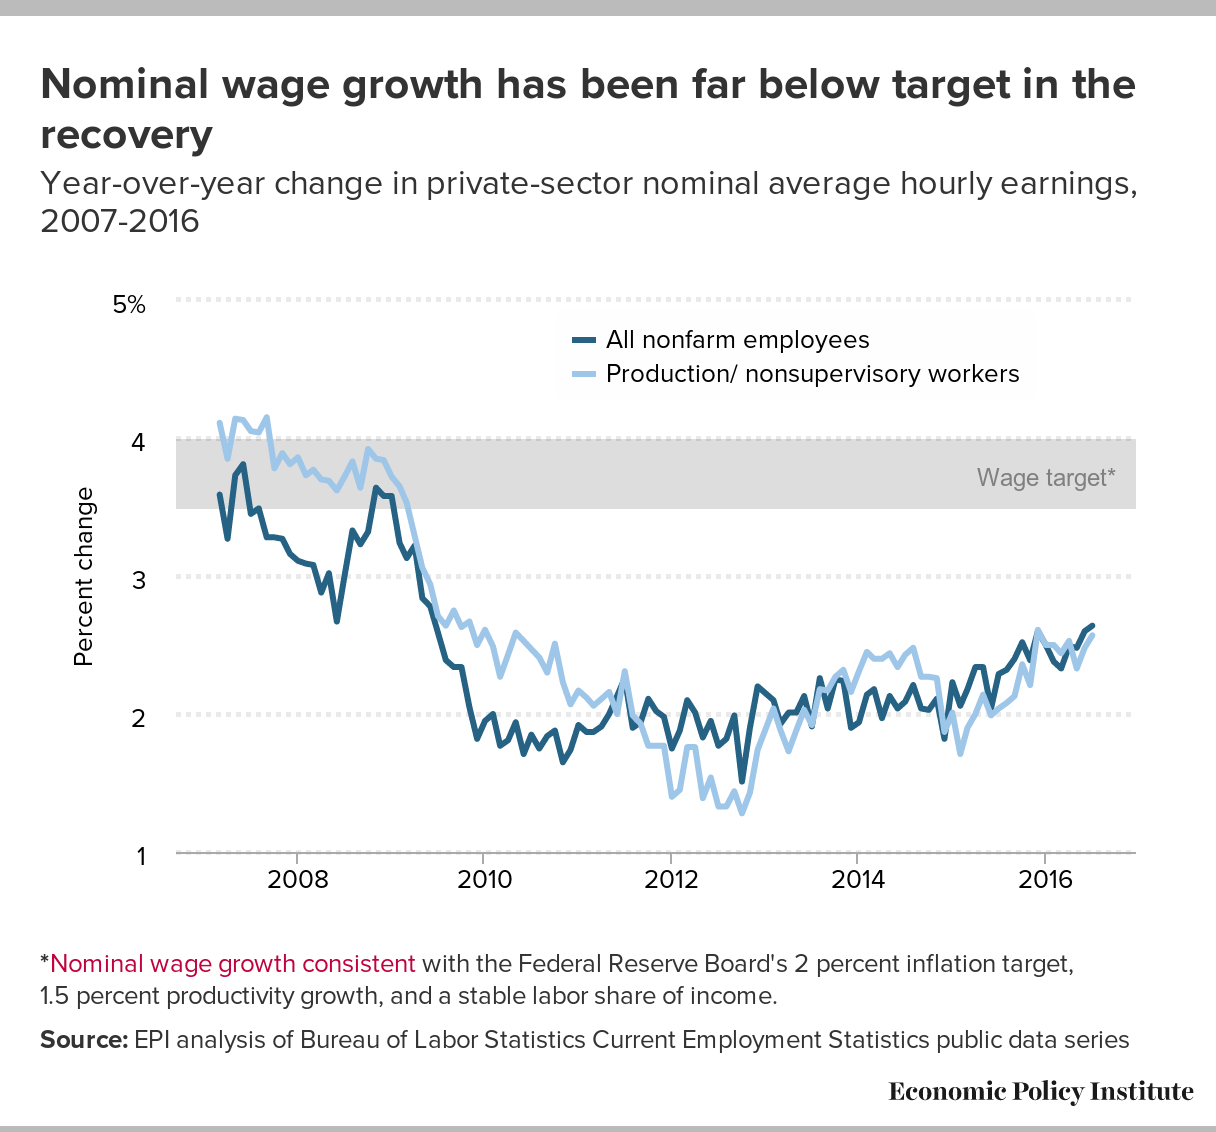
Despite steady progress on some fronts, the economy is far from healthy. Yes, the unemployment rate fell below 5 percent for the first time since 2008 in January. But wage growth is still far below what a healthy target would be, and a glaring new weakness has appeared in the economic data in recent years—a significant slowdown in the pace of productivity growth. Productivity is essentially the value of income and output produced in an average hour of work in the U.S. economy—it provides the ceiling on how high living standards can rise. Productivity growth also provides a buffer against inflationary pressures. If American workers can produce 2 percent more income and output in a given hour of work from one year to the next, this means their hourly wages can rise 2 percent without putting any upward pressure on costs at all (to walk through the intuition, remember that while labor costs per hour have risen 2 percent, output per hour has also risen 2 percent, so labor costs per unit of output hence remain flat). These effects on living standards and inflation make productivity slowdowns particularly worrisome.
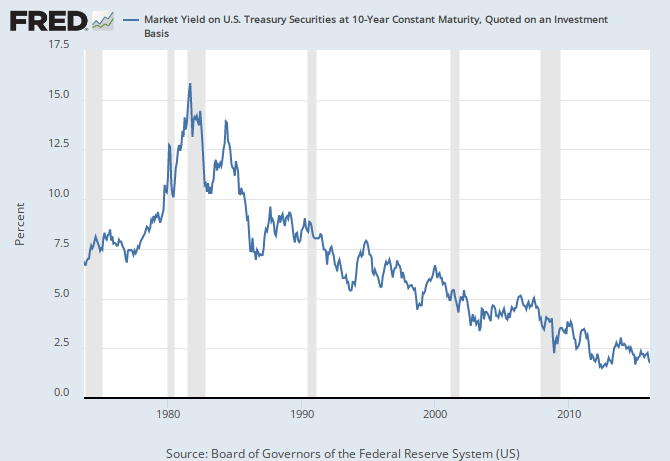
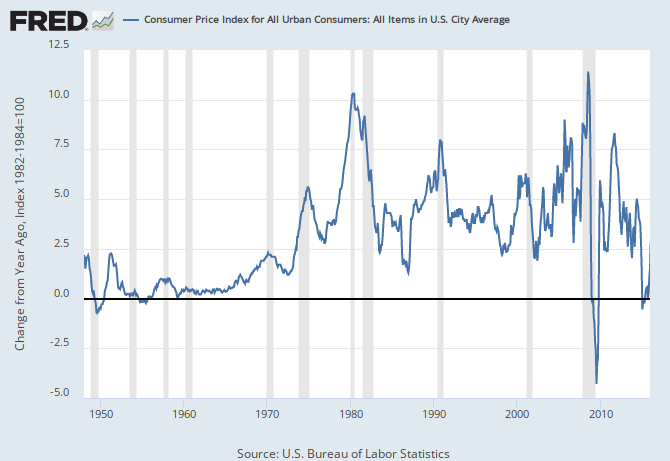
Historically, the combination of an unemployment rate low enough to spark Federal Reserve tightening and decelerating productivity growth would lead people to think that an overheating economy had pushed up inflation and interest rates, which crowded-out private sector investment. But this is definitely not the culprit behind recent productivity declines.
For one, interest rates and inflation remain historically low—and have shown no sign at all at lifting off the floor in recent years. It’s never been cheaper to borrow to make investments, so it’s not an overheating economy that has convinced private-sector firms to not invest.
So what has led to plunging productivity growth? It’s hard to know for sure, but we need to seriously consider the possibility that productivity growth (normally thought of by economists as a supply-side phenomenon) is just the last casualty of the chronic demand shortfall that brought on the Great Recession and which was never filled in sufficiently to push the economy back to full health.
When quitting is a good thing
This morning’s Job Openings and Labor Turnover Survey (JOLTS) report came in pretty much in line with other economic indicators that suggested a solid finish the 2015 labor market. Most notably, the hires and quits rates saw small upticks in December, a positive sign for an economy continuing to recovery. Unfortunately, those stronger results were somewhat tempered by January’s employment numbers, so the big question will be whether the upticks in today’s report will hold or will return back to their lower values. If these trends continue, it will mean we are still on the road towards full employment. Regardless, we need to stay on that road by encouraging the Federal Reserve to keep their foot off the brakes and encouraging policymakers at all levels of government to abandon austerity in favor of boosting local and state economies through increased investments and public sector employment.
While jobs day brings a whole series of great measures to analyze labor market slack, from the prime-age employment-to-population ratio to nominal wage growth, my favorite indicator on JOLTS day is the quits rate. A high quits rate is important because it means that workers feel confident enough in the economy to quit jobs that are not right for them and search for ones that are. It means a stronger labor market, where job opportunities abound and workers can find a better match. We often talk about all those workers who have been discouraged by economy, who aren’t seeing opportunities for them in the labor market or getting the hours they want. The quits rate is a similar measure. In a stronger economy, we should see the underemployment rate tick down while the quits rate ticks up. As you can see in the figure below, the quits rate has recently been moving up, but it’s still below a fully recovered rate and certainly below a full employment rate.
Despite seemingly stable U.S. trade balance, rapidly growing trade deficits in non-oil goods could lead to American job losses
The U.S. Census Bureau reported that the annual U.S. trade deficit in goods and services increased from $508.3 billion to $531.5 billion from 2014 to 2015, an increase of $23.2 billion (4.6 percent). The slow growth of the overall U.S. trade deficit hides massive underlying shifts in the trade deficit in petroleum products (which declined $157.3 billion, or 55.3 percent), compared with the trade deficit in all other goods, which increased from $547.7 billion to $673.1 billion—an increase of $125.4 billion, or 22.9 percent. In other words, the sharp decline in the petroleum trade deficit masked a large increase in the non-oil goods trade deficit, which could result in substantial U.S. job losses in the future.
Most U.S. goods trade consists of manufactured products. In 2015, manufacturing constituted 86.9 percent of total U.S. goods trade, and 94.3 percent of total trade in non-oil goods. Because manufacturing is such a large employer, rapidly growing trade deficits in non-oil goods are a threat to future employment in this sector. The growing trade deficit in manufactured products rose to 3.8 percent of GDP, only 0.7 percent (7 tenths) of a percentage point below the maximum reached in 2005. The manufacturing trade deficit also reached a record high of $681 billion in 2015, well in excess of the previous peak $619.7 in 2007. Rapidly growing manufacturing trade deficits were responsible for most, if not all, of the 4.8 million U.S. manufacturing jobs lost between December 2000 and December 2015, and there’s every reason to believe that these job losses will continue if the non-oil trade deficits keeps growing.
This analysis is primarily concerned with shifts in goods trade. The U.S. balance of trade in services declined slightly in 2015, falling from a trade surplus of $233.1 billion in 2014 to $227.4 billion in 2015. Trade in goods continues to dominate overall trade flows for the United States—trade in services totaled only 24.1 percent of total U.S. goods and services trade in 2015.
Should we care about slow nominal wage growth when price inflation is slow? YES.
Nominal wages for American workers rose by 2.6 percent in the 12 months ending in December 2015. Over the same time, prices have risen just under 0.7 percent (held down mostly by falling oil prices). This mean that real (that is, inflation-adjusted) wages have grown 1.9 percent in that year. In historical perspective, this is a very healthy rate of real wage growth (for example, real hourly wages for the bottom 70 percent of workers have averaged well under 0.5 percent annually since 1979).
Since it is this real, not nominal, wage growth that influences living standards, shouldn’t we be perfectly happy with this constellation of wage and price inflation? Not really, for a number a reasons.
For one, the extraordinarily low rates of price inflation won’t continue. They’ve been driven by large declines in commodity prices. The gains to real living standards are genuine—cheap gas really does make paychecks stretch further (though how good cheap gas is in the long run for climate change is a whole other story), but we know that commodity prices are volatile and are likely to stabilize or even rise in the next year. If either of these things happens, the overall rate of inflation in the next year will rise.
Further, even if commodity prices remained depressed forever and overall price inflation really did permanently shift to a slower pace, it is far from clear that this would be a good outcome or that the real wage growth seen in the past year would continue.
What to Watch on Jobs Day: Will we finally reach full employment in 2016?
We’ve seen solid growth in employment over the past couple of years, and the unemployment rate has come down dramatically, but by any reasonable definition we are still not that close to genuine full employment. So, what is full employment? In a great book (pdf), Jared Bernstein and Dean Baker define full employment as “the level of employment at which additional demand [injected into] the economy will not create more employment.” Full employment should show up in indicators on both the quantity and the price side (i.e., wages) of the labor market. Unemployment is low during periods of full employment, and due to high demand for labor, employed workers have more bargaining power—as a result they will be better able to negotiate higher wages and get the hours they want.
Let’s look at some measures of employment on the quantity side. A good measure of slack in employment and hours is the BLS’s U6 measure of labor underutilization. It measures total unemployed, plus all persons marginally attached to the labor force, plus total employed part time for economic reasons, as a percent of the civilian labor force. Basically, people who want to work, plus employed people who want to work more hours, plus people who have looked for work in the last year but stopped looking for some reason in the last four weeks and are hence not classified as currently “in the labor force.”
The figure below shows these data by race, which demonstrates that, as with the unemployment rate, the underemployment rate is much higher for people of color. While the U6 has come down substantially but it is still elevated and has a ways to go before it gets to pre-recession levels. (And these pre-recession levels are elevated relative to the last time we had unambiguous full employment in the late 1990s and 2000.)
NPR report reveals the real reason why agricultural employers prefer guestworkers
A recent story from NPR’s Dan Charles titled “Guest Workers, Legal Yet Not Quite Free, Pick Florida’s Oranges,” provides a crucial glimpse into what it’s like being a guestworker in the United States. As the title suggests, it’s not pretty. The headline is probably using the word “free” as a double entendre: guestworkers are not free in the sense of the free market, nor in the sense of someone who has personal freedom and agency; i.e., is not a slave.
Guestworkers are foreign workers who are temporarily authorized to work in the United States with nonimmigrant visas. EPI and civil rights groups, farmworker advocates, and numerous media reports have highlighted how employers often prefer to employ guestworkers instead of Americans because they can be paid less and are indentured to their employers. Often, employers claim that guestworkers are doing “dirty jobs,” which Americans find so unappealing that they just flat out won’t do them. There’s plenty of evidence out there to suggest that the real reasons are much different. For instance, two recent investigative reports from Buzzfeed paint a bleak picture of the H-2A and H-2B programs (two guestworker programs that allow employers to hire temporary foreign workers for agricultural and non-agricultural jobs, respectively), documenting the ways in which these workers are indentured servants with few rights or labor protections. This happens because 1) guestworkers often arrive heavily in debt to labor recruiters who connect them to their temporary jobs, and 2) their employer controls the visa status, which means that 3) guestworkers do not have the legal right to switch employers if they don’t get paid an appropriate fair wage or if their boss breaks the law or exploits them in some other way. Ultimately, the result for guestworkers is a reasonable fear that if they complain about low pay or unsafe work conditions, they’ll get fired, which renders them deportable and means they won’t have a chance to earn back the thousands of dollars they had to borrow to pay the recruiter.
The labor rights of four million migrants hang in the balance at the Supreme Court
The Supreme Court deserves praise for agreeing to review United States v. Texas, a case that will determine the fate of the most significant of the executive immigration actions announced by the president on November 20, 2014. The Court will review a lower court’s decision that temporarily blocked President Obama’s Department of Homeland Security (DHS) guidance directive that “establish[es] a process for considering deferred action for certain aliens who have lived in the United States for five years and either came here as children or already have children who are U.S. citizens or permanent residents” (hereinafter referred to simply as “Guidance”). The Supreme Court will decide whether the president overstepped the bounds of his legal authority when DHS issued this Guidance.
More specifically, the Guidance in question would defer the deportation of unauthorized immigrants who are the parents of children who are either U.S. citizens or legal permanent residents, have resided in the United States for at least five years, and are not a DHS enforcement priority for deportation. This is known as the “DAPA” initiative, Deferred Action for the Parents of Americans and Legal Permanent Residents. The Guidance would also update and expand “DACA,” the Deferred Action for Childhood Arrivals initiative (in place since 2012), which to date has provided deferred action to over 660,000 persons who entered the country as young people without authorization. Combined, over five million persons could be eligible for DAPA, DACA, and expanded DACA (sometimes referred to as DACA+), out of a total unauthorized immigrant population of 11 million.
The Obama administration pushes for a better response to unemployment
President Obama has announced a package of reforms to repair some of the damage done in recent years to the unemployment insurance system and to provide more help to workers at risk of losing jobs—incentives for employers to retain workers, more income support for job losers, and more help getting retrained and back to work. Reforms are needed, and most of the president’s proposals are obviously helpful.
Background
When the economy crashed in 2007 the federal-state system of unemployment insurance (UI) was far from ready. States had had five years since the previous recession to replenish their UI trust funds, improve coverage (with the help of generous federal grants provided during the Bush administration) and plan for the next downturn. Yet when the crash came and the unemployment rate rose to 10 percent, UI trust funds had not been refilled. Many states had unwisely cut taxes rather than accumulate surpluses that could be drawn down in a recession. By 2007, only 17 states were minimally solvent. Some states—but not many—had extended coverage to workers with unstable employment histories, seasonal workers, and poorly paid individuals who previously would not have qualified for benefits. If you had to give the states a grade on preparedness, a D+ would be generous.
The result was a disaster. Thirty-six states ran out of money and had to borrow in order to pay benefits, with the loans peaking at $47 billion in 2010. Most of the state UI trust funds are still in bad shape, and—according to the White House—only 20 states have sufficient reserves to weather a single year of recession. As of January 13, 2016, California still owes $6.5 billion to the Federal Unemployment Account, Ohio owes $773 million, and Connecticut owes $100 million.
The Lilly Ledbetter Act is part of a more ambitious women’s economic agenda
This Friday is the anniversary of the Lilly Ledbetter Fair Pay Act of 2009, a reminder that a significant pay gap still exists between men and women in the United States. At the median, hourly pay for women is only 82.9 percent of men’s median wage ($15.21 versus $18.35). While over the last several decades women have made gains in terms of education attainment and labor force participation, compared to men, they are still paid less, are more likely to hold low wage jobs, and are more likely to live in poverty. This economic gap exists to a greater degree for women of color and remains persistent across women of varying education levels and working in different occupations.
But the gender wage gap is only one way the economy shortchanges women. At the same time the gender wage gap has persisted, hourly wages for the vast majority of workers have stagnated, as the fruits of increased productivity and a growing economy have accrued to those at the top. It hasn’t always been this way: pay rose with productivity in the three decades following World War II. But since the 1970s, pay and productivity have grown further apart, as the result of intentional policy decisions that eroded the leverage of the vast majority of workers to secure higher wages.
A progressive women’s economic agenda, one that seeks to truly maximize women’s economic potential, must focus on both closing the gender wage gap and raising wages more generally.
14 states raised their minimum wage at the beginning of 2016, lifting the wages of more than 4.6 million working people
At the beginning of the year, 14 states raised their minimum wages, lifting wages for over 4.6 million workers in states across the country. Unlike last year’s increases, the majority of these increases (12) were scheduled increases initiated by legislation or approved by voters through ballot measures. The other two (Colorado and South Dakota) were changed as a result of inflation indexing—a process adopted by 15 states by which the minimum wage is automatically adjusted each year to match increases in prices.
Table 1 below shows the magnitude of the minimum wage increase in each state, ranging from an increase of 5 cents in South Dakota to 1 dollar in four states (Alaska, California, Massachusetts, and Nebraska). Because inflation was very low in 2015, nine of the 11 states with inflation indexing set to go into effect at the beginning of the year did not adjust their minimum wages in 2016. Colorado and South Dakota were the only exceptions, yet their increases were small, and thus the increases affected relatively small shares of each state’s workforce: 2.1 percent and 3.4 percent, respectively. Minimum wage increases affected a much larger portion of the workforce in states that initiated larger increases through legislation. For example, California’s $1.00 minimum wage increase lifted wages for 18.6 percent of the state workforce.
All together, these increases will provide 4.6 million workers over $3.5 billion in higher annual wages. This additional pay, though modest, represents a significant boost to the spending power of low-wage workers and their families. For example, a worker in Nebraska who was previously earning the state minimum wage of $8.00 an hour in 2015 will see their hourly pay increase by 12.5 percent.
States with minimum wage increases effective January 1, 2016
| States with minimum wage increase | Amount of wage increase | New wage on Jan. 1, 2016 | Reason for change | Directly affected workers1 | Indirectly affected workers2 | Total affected workers | Share of state’s wage-earning workforce | Total wage increases for affected workers3 |
|---|---|---|---|---|---|---|---|---|
| Alaska | $1.00 | $9.75 | Legislation | 15,000 | 18,000 | 33,000 | 10.7% | $23,476,000 |
| Arkansas | $0.50 | $8.00 | Legislation | 45,000 | 45,000 | 90,000 | 7.8% | $38,036,000 |
| California | $1.00 | $10.00 | Legislation | 1,748,000 | 1,172,000 | 2,920,000 | 18.6% | $2,703,126,000 |
| Colorado | $0.08 | $8.31 | Inflation adjustment | 44,000 | 6,000 | 50,000 | 2.1% | $14,429,000 |
| Connecticut | $0.45 | $9.60 | Legislation | 79,000 | 27,000 | 106,000 | 6.7% | $57,813,000 |
| Hawaii | $0.75 | $8.50 | Legislation | 23,000 | 27,000 | 50,000 | 8.6% | $23,576,000 |
| Massachusetts | $1.00 | $10.00 | Legislation | 181,000 | 175,000 | 356,000 | 11.4% | $266,335,000 |
| Michigan | $0.35 | $8.50 | Legislation | 184,000 | 98,000 | 283,000 | 6.9% | $77,857,000 |
| Nebraska | $1.00 | $9.00 | Legislation | 58,000 | 42,000 | 101,000 | 11.5% | $67,741,000 |
| New York4 | $0.25 | $9.00 | Legislation | 273,000 | 213,000 | 486,000 | 5.9% | $143,521,000 |
| Rhode Island | $0.60 | $9.60 | Legislation | 37,000 | 27,000 | 64,000 | 13.5% | $32,186,000 |
| South Dakota | $0.05 | $8.55 | Inflation adjustment | 8,000 | 5,000 | 13,000 | 3.4% | $3,108,000 |
| Vermont | $0.45 | $9.60 | Legislation | 15,000 | 3,000 | 18,000 | 6.3% | $8,768,000 |
| West Virginia4 | $0.75 | $8.75 | Legislation | 49,000 | 26,000 | 75,000 | 11.5% | $46,700,000 |
| Total | 2,760,000 | 1,886,000 | 4,646,000 | $3,506,675,000 |
1. Directly affected workers will see their wages rise as the new minimum wage rate will exceed their current hourly pay.
2. Indirectly affected workers have a wage rate just above the new minimum wage (between the new minimum wage and the new minimum wage plus the dollar amount of the increase in the previous year's minimum wage). They will receive a raise as employer pay scales are adjusted upward to reflect the new minimum wage.
3. Total annual amount of increased wages for directly and indirectly affected workers.
4. Changes went into effect 12/31/2015.
Note: Totals may not sum due to rounding. "Legislation" indicates that the new rate was determined by legislature or ballot vote. "Inflation adjustment" indicates that the new rate was based on some measure of inflation.
Source: EPI analysis of Current Population Survey Outgoing Rotation Group microdata 2014Q4-2015Q3
The lead crisis in Flint will affect the city for years to come
By now, the story of what’s happening in Flint is well known. The city has been struggling since the decline of its automobile industry. Its financial troubles were severe enough that the city went into state receivership and an emergency manager was appointed by the state of Michigan to fix the budget. One way to lighten Flint’s financial woes was to cease piping water all the way from Detroit and instead source water locally. A water treatment facility that would be used to get water from Lake Huron would not be ready for a couple of years, so as a stopgap measure, the city began piping water from the polluted Flint River. Residents started complaining about the water almost immediately. City authorities waffled—issuing boil orders, telling residents to run their taps for five minutes before using the water, and adding large amounts of chlorine (creating another problem), before finally admitting that the water was undrinkable.
Since the switch to Flint River water, the number of children in Flint with blood lead levels over 5 micrograms per deciliter has doubled. In some Flint zip codes, the numbers are even higher. And those are only the children we know about. The number of children who are lead poisoned is likely much higher.
Children who have been exposed to lead suffer irreversible learning deficiencies and behavioral problems and the effects of early exposure persist throughout life. Even very low levels of lead contribute to cognitive impairment, including reductions in IQ, verbal, and reading ability, with no identifiable safe bottom threshold. Lead exposure also affects young children’s behavior, leading to a greater propensity to engage in risky behavior and violent or criminal activity later in life.
An annotated reading of Obama’s flawed framing of wage and income problems in the SOTU
Having closely followed all of President Obama’s speeches on income inequality, I’ve noticed a significant move forward, from an abstract discussion to one that focused on the key underlying issue—the need to generate robust, widespread wage growth. Unfortunately, this week’s State of the Union (SOTU) address was a huge step backward in how the president framed and discussed the issue. His policy agenda, which I view very favorably, has not shifted. President Obama actually has a wage growth agenda—he just does not highlight its elements as part of a coherent package. That’s unfortunate.
The president’s SOTU framed income inequality and the “strain” on working families as the result of ongoing technological disruption, a force widely considered to be something we cannot nor should not do something about. This is extremely disappointing, incorrect as a factual matter, and misdirects our policy focus and mis-educates the public. It is especially disappointing since the views of center-left economists have been converging on a recognition that technological change has not been a leading factor in our wage problems or inequality in the 2000s (see Mike Konzcal). One need only note the statements made by President Obama’s leading economic advisor in the first term, Larry Summers, last March at a Hamilton Project event on the role of robots:
“And I am concerned that if we allow the idea to take hold that all we need to do is there are all these jobs with skills and if we just can train people a bit then they will be able to get into them and the whole problem will go away. I think that is fundamentally an evasion of a profound social challenge… I think that the broad empowerment of labor in a world where an increasing part of the economy is generating income that has a kind of rent aspect to it, and the question of who is going to share in it becomes very large.”
In plainer terms, Summers is saying that economy’s winners at the top of the income scale have gotten more than their share gaining ‘rents’ (meaning they don’t reflect efficiency gains), and that giving working people the power to act collectively will be key to any rebalancing between the elites and the middle and working classes. He’s saying that any talk about “skill deficits” as the cause of wage problems—that is what the technology story is all about— is misguided, and evades the essential questions of power in the marketplace that drive inequality and wage stagnation.
Friedrichs case threatens to push down wages for workers beyond the public sector
The Supreme Court heard oral arguments yesterday in Friedrichs v. California Teachers Association, a case that could profoundly affect the economy and the ability of millions of workers to improve their wages and working conditions. Friedrichs challenges the right of a majority of workers, through their democratically elected union, to bargain a contract with their public employer that makes every employee covered by the contract pay her fair share of the costs of negotiating it, administering it, and enforcing it in the courts or in arbitration. By preventing “free riders,” fair share clauses help ensure the viability of the union and the collective bargaining relationship.
What the fair share requirements (also known as “agency shop” provisions) don’t do is equally important to understand. They don’t require anyone to join the union—the law has been clear for decades that no one can be forced to join a union. And fair share provisions don’t require anyone to contribute to union political activity or advocacy on issues unrelated to collective bargaining.
Nevertheless, anti-union groups and the complaining teachers claim that it is unconstitutional for a public employer such as a state or county to make unwilling employees pay their fair share of bargaining costs. They claim a First Amendment right to accept the higher wages and benefits that come with the union contract without having to pay anything to support the union that won that contract. Alarmingly, a majority of the Supreme Court justices appear to agree, even though it means overturning Supreme Court precedent that is less than 40 years old. That case, Abood v. Detroit Board of Education, held that the interests of the government in having a single, stable collective bargaining partner outweighed the right of dissenting employees not to associate with the union and help pay for bargaining and administering the employment contract:
“The governmental interests advanced by the agency-shop provision in the Michigan statute are much the same as those promoted by similar provisions in federal labor law. The confusion and conflict that could arise if rival teachers’ unions, holding quite different views as to the proper class hours, class sizes, holidays, tenure provisions, and grievance procedures, each sought to obtain the employer’s agreement, are no different in kind from the evils that the exclusivity rule in the Railway Labor Act was designed to avoid. See Madison School Dist. v. Wisconsin Employment Relations Comm’n, 429 U.S. 167, 178, 97 S.Ct. 421, 425, 50 L.Ed.2d 376 (Brennan, J., concurring in judgment). The desirability of labor peace is no less important in the public sector, nor is the risk of “free riders” any smaller.”
The road to full employment is long, but we are moving in the right direction
The labor market ended the year on a positive note, adding an additional 292,000 jobs in December. Of course, all economic woes are not solved. It’s clear from the data that we are still far from a full employment economy. Notably, wage growth is still not where it ought to be, and the prime-age employment-to-population ratio is barely half-way back to its 2007 level, which was not a banner year for full employment to begin with.
The Job Openings and Labor Turnover Survey (JOLTS) data released this morning provide further evidence that the economy is chugging along, but has a ways to go before the labor market is fully recovered. While my favorite indicators to watch on jobs day are nominal wage growth and the prime-age employment-to-population ratio, my favorite indicator on JOLTS day is the quits rate. There are three key lines in the graph below: the hires rate, the quits rate, and the layoffs rate.
Hires, quits, and layoff rates, 2000-2015
| Month | Hires rate | Layoffs rate | Quits rate |
|---|---|---|---|
| Dec-2000 | 4.100000 | 1.400000 | 2.300000 |
| Jan-2001 | 4.400000 | 1.600000 | 2.600000 |
| Feb-2001 | 4.100000 | 1.400000 | 2.500000 |
| Mar-2001 | 4.200000 | 1.600000 | 2.400000 |
| Apr-2001 | 4.000000 | 1.500000 | 2.400000 |
| May-2001 | 4.000000 | 1.500000 | 2.400000 |
| Jun-2001 | 3.800000 | 1.500000 | 2.300000 |
| Jul-2001 | 3.900000 | 1.500000 | 2.200000 |
| Aug-2001 | 3.800000 | 1.400000 | 2.100000 |
| Sep-2001 | 3.800000 | 1.600000 | 2.100000 |
| Oct-2001 | 3.800000 | 1.700000 | 2.200000 |
| Nov-2001 | 3.700000 | 1.600000 | 2.000000 |
| Dec-2001 | 3.700000 | 1.400000 | 2.000000 |
| Jan-2002 | 3.700000 | 1.400000 | 2.200000 |
| Feb-2002 | 3.700000 | 1.500000 | 2.000000 |
| Mar-2002 | 3.500000 | 1.400000 | 1.900000 |
| Apr-2002 | 3.800000 | 1.500000 | 2.100000 |
| May-2002 | 3.800000 | 1.500000 | 2.100000 |
| Jun-2002 | 3.700000 | 1.400000 | 2.000000 |
| Jul-2002 | 3.800000 | 1.500000 | 2.100000 |
| Aug-2002 | 3.700000 | 1.400000 | 2.000000 |
| Sep-2002 | 3.700000 | 1.400000 | 2.000000 |
| Oct-2002 | 3.700000 | 1.400000 | 2.000000 |
| Nov-2002 | 3.800000 | 1.500000 | 1.900000 |
| Dec-2002 | 3.800000 | 1.500000 | 2.000000 |
| Jan-2003 | 3.800000 | 1.500000 | 1.900000 |
| Feb-2003 | 3.600000 | 1.500000 | 1.900000 |
| Mar-2003 | 3.400000 | 1.400000 | 1.900000 |
| Apr-2003 | 3.600000 | 1.600000 | 1.800000 |
| May-2003 | 3.500000 | 1.500000 | 1.800000 |
| Jun-2003 | 3.700000 | 1.600000 | 1.800000 |
| Jul-2003 | 3.600000 | 1.600000 | 1.800000 |
| Aug-2003 | 3.600000 | 1.500000 | 1.800000 |
| Sep-2003 | 3.700000 | 1.500000 | 1.900000 |
| Oct-2003 | 3.800000 | 1.400000 | 1.900000 |
| Nov-2003 | 3.600000 | 1.400000 | 1.900000 |
| Dec-2003 | 3.800000 | 1.500000 | 1.900000 |
| Jan-2004 | 3.700000 | 1.500000 | 1.900000 |
| Feb-2004 | 3.600000 | 1.400000 | 1.900000 |
| Mar-2004 | 3.900000 | 1.400000 | 2.000000 |
| Apr-2004 | 3.900000 | 1.500000 | 2.000000 |
| May-2004 | 3.800000 | 1.400000 | 1.900000 |
| Jun-2004 | 3.800000 | 1.400000 | 2.000000 |
| Jul-2004 | 3.700000 | 1.400000 | 2.000000 |
| Aug-2004 | 3.900000 | 1.500000 | 2.000000 |
| Sep-2004 | 3.800000 | 1.400000 | 2.000000 |
| Oct-2004 | 3.900000 | 1.400000 | 2.000000 |
| Nov-2004 | 3.900000 | 1.500000 | 2.100000 |
| Dec-2004 | 4.000000 | 1.500000 | 2.100000 |
| Jan-2005 | 3.900000 | 1.400000 | 2.100000 |
| Feb-2005 | 3.900000 | 1.400000 | 2.000000 |
| Mar-2005 | 3.900000 | 1.500000 | 2.100000 |
| Apr-2005 | 4.000000 | 1.400000 | 2.100000 |
| May-2005 | 3.900000 | 1.400000 | 2.100000 |
| Jun-2005 | 3.900000 | 1.500000 | 2.100000 |
| Jul-2005 | 3.900000 | 1.400000 | 2.000000 |
| Aug-2005 | 4.000000 | 1.400000 | 2.200000 |
| Sep-2005 | 4.000000 | 1.400000 | 2.300000 |
| Oct-2005 | 3.800000 | 1.300000 | 2.200000 |
| Nov-2005 | 3.900000 | 1.200000 | 2.200000 |
| Dec-2005 | 3.700000 | 1.300000 | 2.100000 |
| Jan-2006 | 3.900000 | 1.300000 | 2.100000 |
| Feb-2006 | 3.900000 | 1.300000 | 2.200000 |
| Mar-2006 | 3.900000 | 1.200000 | 2.200000 |
| Apr-2006 | 3.800000 | 1.300000 | 2.100000 |
| May-2006 | 4.000000 | 1.400000 | 2.200000 |
| Jun-2006 | 3.900000 | 1.200000 | 2.200000 |
| Jul-2006 | 3.900000 | 1.300000 | 2.200000 |
| Aug-2006 | 3.800000 | 1.200000 | 2.200000 |
| Sep-2006 | 3.800000 | 1.300000 | 2.100000 |
| Oct-2006 | 3.800000 | 1.300000 | 2.100000 |
| Nov-2006 | 4.000000 | 1.300000 | 2.300000 |
| Dec-2006 | 3.800000 | 1.300000 | 2.200000 |
| Jan-2007 | 3.800000 | 1.200000 | 2.200000 |
| Feb-2007 | 3.800000 | 1.300000 | 2.200000 |
| Mar-2007 | 3.800000 | 1.300000 | 2.200000 |
| Apr-2007 | 3.700000 | 1.300000 | 2.100000 |
| May-2007 | 3.800000 | 1.300000 | 2.200000 |
| Jun-2007 | 3.800000 | 1.300000 | 2.000000 |
| Jul-2007 | 3.700000 | 1.300000 | 2.100000 |
| Aug-2007 | 3.700000 | 1.300000 | 2.100000 |
| Sep-2007 | 3.700000 | 1.500000 | 1.900000 |
| Oct-2007 | 3.800000 | 1.400000 | 2.100000 |
| Nov-2007 | 3.700000 | 1.400000 | 2.000000 |
| Dec-2007 | 3.600000 | 1.300000 | 2.000000 |
| Jan-2008 | 3.500000 | 1.300000 | 2.000000 |
| Feb-2008 | 3.500000 | 1.400000 | 2.000000 |
| Mar-2008 | 3.400000 | 1.300000 | 1.900000 |
| Apr-2008 | 3.500000 | 1.300000 | 2.100000 |
| May-2008 | 3.300000 | 1.300000 | 1.900000 |
| Jun-2008 | 3.500000 | 1.500000 | 1.900000 |
| Jul-2008 | 3.300000 | 1.400000 | 1.800000 |
| Aug-2008 | 3.300000 | 1.600000 | 1.700000 |
| Sep-2008 | 3.100000 | 1.400000 | 1.800000 |
| Oct-2008 | 3.300000 | 1.600000 | 1.800000 |
| Nov-2008 | 2.900000 | 1.600000 | 1.500000 |
| Dec-2008 | 3.200000 | 1.800000 | 1.600000 |
| Jan-2009 | 3.100000 | 1.900000 | 1.500000 |
| Feb-2009 | 3.000000 | 1.900000 | 1.500000 |
| Mar-2009 | 2.800000 | 1.800000 | 1.400000 |
| Apr-2009 | 2.900000 | 2.000000 | 1.300000 |
| May-2009 | 2.800000 | 1.600000 | 1.300000 |
| Jun-2009 | 2.800000 | 1.600000 | 1.300000 |
| Jul-2009 | 2.900000 | 1.700000 | 1.300000 |
| Aug-2009 | 2.900000 | 1.600000 | 1.300000 |
| Sep-2009 | 3.000000 | 1.600000 | 1.300000 |
| Oct-2009 | 2.900000 | 1.500000 | 1.300000 |
| Nov-2009 | 3.100000 | 1.400000 | 1.400000 |
| Dec-2009 | 2.900000 | 1.500000 | 1.300000 |
| Jan-2010 | 3.000000 | 1.400000 | 1.300000 |
| Feb-2010 | 2.900000 | 1.400000 | 1.300000 |
| Mar-2010 | 3.200000 | 1.400000 | 1.400000 |
| Apr-2010 | 3.100000 | 1.300000 | 1.500000 |
| May-2010 | 3.300000 | 1.300000 | 1.400000 |
| Jun-2010 | 3.100000 | 1.500000 | 1.500000 |
| Jul-2010 | 3.200000 | 1.600000 | 1.400000 |
| Aug-2010 | 3.000000 | 1.400000 | 1.400000 |
| Sep-2010 | 3.100000 | 1.400000 | 1.500000 |
| Oct-2010 | 3.100000 | 1.300000 | 1.400000 |
| Nov-2010 | 3.100000 | 1.400000 | 1.400000 |
| Dec-2010 | 3.200000 | 1.400000 | 1.500000 |
| Jan-2011 | 3.000000 | 1.300000 | 1.400000 |
| Feb-2011 | 3.100000 | 1.300000 | 1.400000 |
| Mar-2011 | 3.300000 | 1.300000 | 1.500000 |
| Apr-2011 | 3.200000 | 1.300000 | 1.500000 |
| May-2011 | 3.100000 | 1.300000 | 1.500000 |
| Jun-2011 | 3.300000 | 1.400000 | 1.500000 |
| Jul-2011 | 3.200000 | 1.300000 | 1.500000 |
| Aug-2011 | 3.200000 | 1.300000 | 1.500000 |
| Sep-2011 | 3.300000 | 1.300000 | 1.500000 |
| Oct-2011 | 3.200000 | 1.300000 | 1.500000 |
| Nov-2011 | 3.200000 | 1.300000 | 1.500000 |
| Dec-2011 | 3.200000 | 1.300000 | 1.500000 |
| Jan-2012 | 3.200000 | 1.300000 | 1.500000 |
| Feb-2012 | 3.300000 | 1.300000 | 1.600000 |
| Mar-2012 | 3.300000 | 1.300000 | 1.600000 |
| Apr-2012 | 3.200000 | 1.400000 | 1.600000 |
| May-2012 | 3.300000 | 1.400000 | 1.600000 |
| Jun-2012 | 3.200000 | 1.300000 | 1.600000 |
| Jul-2012 | 3.200000 | 1.200000 | 1.600000 |
| Aug-2012 | 3.300000 | 1.400000 | 1.600000 |
| Sep-2012 | 3.100000 | 1.300000 | 1.400000 |
| Oct-2012 | 3.200000 | 1.300000 | 1.500000 |
| Nov-2012 | 3.300000 | 1.300000 | 1.600000 |
| Dec-2012 | 3.200000 | 1.100000 | 1.600000 |
| Jan-2013 | 3.300000 | 1.200000 | 1.700000 |
| Feb-2013 | 3.400000 | 1.200000 | 1.700000 |
| Mar-2013 | 3.200000 | 1.300000 | 1.500000 |
| Apr-2013 | 3.300000 | 1.300000 | 1.700000 |
| May-2013 | 3.300000 | 1.300000 | 1.600000 |
| Jun-2013 | 3.200000 | 1.200000 | 1.600000 |
| Jul-2013 | 3.300000 | 1.200000 | 1.700000 |
| Aug-2013 | 3.400000 | 1.200000 | 1.700000 |
| Sep-2013 | 3.400000 | 1.300000 | 1.700000 |
| Oct-2013 | 3.300000 | 1.100000 | 1.800000 |
| Nov-2013 | 3.400000 | 1.100000 | 1.800000 |
| Dec-2013 | 3.300000 | 1.200000 | 1.700000 |
| Jan-2014 | 3.300000 | 1.300000 | 1.700000 |
| Feb-2014 | 3.400000 | 1.200000 | 1.800000 |
| Mar-2014 | 3.400000 | 1.200000 | 1.800000 |
| Apr-2014 | 3.500000 | 1.200000 | 1.700000 |
| May-2014 | 3.500000 | 1.200000 | 1.800000 |
| Jun-2014 | 3.500000 | 1.200000 | 1.800000 |
| Jul-2014 | 3.600000 | 1.300000 | 1.800000 |
| Aug-2014 | 3.400000 | 1.200000 | 1.800000 |
| Sep-2014 | 3.600000 | 1.200000 | 2.000000 |
| Oct-2014 | 3.700000 | 1.200000 | 2.000000 |
| Nov-2014 | 3.600000 | 1.100000 | 1.900000 |
| Dec-2014 | 3.700000 | 1.200000 | 1.900000 |
| Jan-2015 | 3.500000 | 1.200000 | 2.000000 |
| Feb-2015 | 3.600000 | 1.200000 | 1.900000 |
| Mar-2015 | 3.600000 | 1.300000 | 2.000000 |
| Apr-2015 | 3.600000 | 1.300000 | 1.900000 |
| May-2015 | 3.600000 | 1.200000 | 1.900000 |
| Jun-2015 | 3.700000 | 1.300000 | 1.900000 |
| Jul-2015 | 3.600000 | 1.200000 | 1.900000 |
| Aug-2015 | 3.600000 | 1.200000 | 1.900000 |
| Sep-2015 | 3.600000 | 1.300000 | 1.900000 |
| Oct-2015 | 3.600000 | 1.200000 | 2.000000 |
| Nov-2015 | 3.600000 | 1.200000 | 2.000000 |
Note: Shaded areas denote recessions. The hires rate is the number of hires during the entire month as a percent of total employment. The layoff rate is the number of layoffs and discharges during the entire month as a percent of total employment. The quits rate is the number of quits during the entire month as a percent of total employment.
Source: EPI analysis of Bureau of Labor Statistics Job Openings and Labor Turnover Survey
National Association of Manufacturers’ criticisms of the Obama overtime proposal all miss their mark
Last September, the National Association of Manufacturers (NAM) filed comments in opposition to the Labor Department’s proposed rule on overtime pay for salaried workers, which would raise the salary threshold under which all workers are eligible for overtime pay from $23,660 to $50,440. NAM’s chief criticism boils down to this: “The Labor Department set the salary level threshold for exemption too high.” The evidence NAM presents to support that criticism, however, is inaccurate, irrelevant, or contradicts its claims.
First, NAM claims, “The proposed salary threshold is grossly out of step with nearly 80 years of historical practice and precedent.” The evidence is a chart that purportedly shows the historic levels after each past increase, adjusted for inflation. But the chart is misleading. It cherry picks the lowest of the several potential levels set in the past, instead of the level that corresponds to the current duties test. When the correct levels are compared, DOL’s proposed $50,440 salary threshold is lower than the levels set in the Truman, Eisenhower, Nixon, and Ford administrations. As Tammy McCutchen testified in Congress on behalf of the U.S. Chamber of Commerce, the short test salary threshold varied between a low of $51,957.36 and a high of $63,741.60.
Even if you take NAM’s misleading chart at face value, it shows an increase in the threshold of 22% in the ten years from 1949 to 1959, or 2.2% per year. If the same rate of increase were applied to the 1975 threshold of $35,625, the 2015 threshold would be almost 90% higher, or about $67,000. NAM should be grateful that the Labor Department chose such a modest level.
An honest discussion of how to reduce poverty: strengthen the safety net and raise wages across the board
I’m afraid Speaker Paul Ryan’s poverty forum will fall short of coming up with solutions that will truly help lift the poor out of poverty. Real solutions should expand policies that have already been proven to work: strengthening the social safety net, making poverty programs better coordinated and more accessible to low income families, and improving job opportunities and wages across the board.
Given his past comments, it seems hugely unlikely that Ryan’s effort will emphasize these priorities, and will instead focus on pure distractions, like alleged fundamental design flaws in safety net programs that keep them from working. For example, Ryan’s arguments that the safety net creates disincentives to work can be solved by increasing program funding to flatten out phase out ranges to ensure minimal market distortions—that is (again) making the programs more generous. While some programs (e.g., the Earned Income Tax Credit [EITC]) already have these gradual phase-out ranges, others could be improved. The health insurance marketplace created a smooth transition from Medicaid to the marketplace with exchange premium and cost-sharing subsidies. Unfortunately, many states failed to expand Medicaid, leaving its near poor in the unnecessary gap. Child care subsidies, while vitally important and woefully underfunded, could be enhanced so that recipients do not fall off that eligibility cliff (PDF).
Ryan wants people to think that these issues represent a fundamental problem with these programs that can only be solved by ripping them up root and branch and sending core responsibility for safety net programs to the states. But this is wrong—these problems can best be solved with more money for benefit expansions and program coordination, including more generous and gradual phase out ranges. The fact is that Ryan’s main proposal to merge safety net programs and block grant funds to states are likely to do more harm than good, leading to increases in poverty, not reductions.
The American safety net does, of course, have a fundamental flaw: it’s simply not generous enough, because we do not provide it enough money. Any serious agenda to address poverty should attack both pre-tax and transfer inequality (mostly by boosting hourly compensation for low and moderate-wage workers) and post-tax and transfer inequality by strengthening the safety net.
The labor market is still moving in the right direction, but has a ways to go before reaching full employment
The top line numbers from this morning’s jobs report suggest that the economy is moving in the right direction, but we need to see a whole lot more movement before we reach full employment. It’s hard to overstate how important true full employment is for workers. In the absence of substantive policy changes to restore workers’ bargaining power, a tight labor market is the one avenue left to improve living standards for the vast majority of workers and their families. In a full employment economy, there are fewer people lined up for every job and employers have to offer higher wages to attract and retain workers. So, it’s really important for the Federal Reserve to let the economy achieve not just a full recovery from the Great Recession, but also genuine full employment.
While payroll employment growth in 2015 was a bit weaker than 2014, we ended the year on high note. Payroll job growth in December was strong at 292,000 jobs. While average payroll growth in 2015 (221,000 a month) was still below 2014 (260,000), the last three months saw some decent acceleration. Fourth quarter job growth averaged 284,000, compared to 174,000 in the third quarter. I’m hoping this is an indication of stronger job growth in 2016. If that strong pace continues over the next year, we will return to pre-recession labor market health in the near future.
When that happens, we should see better and better wage growth. Nominal average hourly wage growth rose 2.5 percent over the year, which is still too slow, but there have been some signs it’s picking up. In each successive quarter of 2015, average hourly wage growth increased by 0.1 percentage points. I wouldn’t go so far as to say that constitutes substantial acceleration, but the rate of growth has indeed nudged up. It’s important to remember, however, that nominal wage growth is still far below target levels. We need to see stronger and more sustained wage growth, above 3.5 percent, before it would be safe to say we were at full employment and it would be appropriate for the Fed to act to raise rates.
Recovery is still in full swing for African American workers
The 2015 job market ended on a high note after trailing the pace of monthly job growth in 2014 for much of the year. The economy averaged net job growth of 284,000 in the last quarter of 2015, adding 292,000 in December—the second highest month behind October. Though the national unemployment rate was unchanged over the last month, it appears that African Americans reaped notable benefits from the end of the year increase in hiring. The black unemployment rate declined 1.1 percentage points (to 8.3 percent) and the percentage of African Americans with a job (the employment-to-population ratio, or EPOP) rose by half a percentage point, to 56.4 percent.
Even with this end of the year hiring surge, unemployment rates have remained relatively flat over the last two quarters of the year and are still slightly above the 2007 pre-recession average. However, comparing annual averages for 2013, 2014, and 2015 reveals that there has been notable longer term progress, especially for black workers. On average, the black unemployment rate falls by 1.7 percentage points for every 1 percentage point drop in the national rate. The following chart shows that relationship has held up over the last couple years, but it also shows that changes in the black unemployment rate are consistent with increased employment and a growing (rather than shrinking) labor force. In fact, African American workers have registered more growth in labor force participation and employment than whites or Latinos over the last year.
What to Watch on Jobs Day: A 2015 Wrap Up
With the last jobs report for 2015 coming out tomorrow, let’s step back and put it in the context of the entire year—and of the recovery as a whole. If December’s numbers come in as expected (analysts are predicting job growth around 215,000), that will be an indication of a relatively strong labor market in 2015, especially compared with the Great Recession and the beginning of the recovery. While the economy has improved, when you look at the peak in 2007 or the stronger economy of 2000, it is clear we still have a way to go before we reach full employment.
Job gains in 2015 were slower than 2014, but they remained solid—slowly eating away at the slack created by the Great Recession. The unemployment rate, and the long-term unemployment rate, measurably declined. The unemployment rate fell from a January to November average of 6.2 percent in 2014 to 5.3 percent in 2015, while the long-term unemployment rate fell from 33.5 percent to 28.1 percent over the same period.
Another key indicator is the employment-to-population ratio (EPOP) of prime age workers (25-54 years old). While prime-age EPOP increased in 2014, it has barely budged since January of 2015, even as the unemployment rate continued to fall. A flat EPOP would mean we’re only adding enough jobs to absorb new prime age population growth. Job growth has to be stronger, and sustained for a longer period, before we return to recovery level EPOPs. If job growth continues in 2016, prime-age EPOPs should start rising again, continuing their march toward recovery.
The worst part of the Fed’s rate increase? It wasn’t data-driven
The Federal Reserve’s decision to begin nudging up interest rates in the clear absence of any inflationary pressures in economic data is disappointing. Interest rate increases should be a tool used to slow the pace of economic growth and halt downward progress on unemployment when there are clear signs of economic overheating that threaten to unsustainably push up wage and price inflation. There are no such signs in today’s economy.
If last week’s hike presages a regular round of increases and monetary tightening going forward, the cost would be immense—millions of Americans would have fewer work opportunities and tens of millions would see smaller wage increases 12-18 months from now. Further, these costs would be strongly regressive, disproportionately harming low and moderate-wage workers and communities of color.
Over the past generation in the American economy, only genuine full employment like we achieved in the late 1990s has delivered strong and equitable wage growth. Because other policy decisions made over this time have eroded most sources of American workers’ bargaining power (inflation-adjusted minimum wages are low, unionization rates are low, and exposure to global competition is high), low and moderate wage workers need extraordinarily tight labor markets to achieve decent rates of hourly pay increases. A full-employment economy is particularly vital for African American and Latino workers, who continue to experience significantly higher rates of unemployment and lower rates of wage growth than other workers, but who have seen larger drops in unemployment as the recovery has proceeded.
Sen. Mikulski wrecks labor standards in H-2B guestworker program
Senator Barbara Mikulski wants the public to believe that replacing U.S. workers with lower-paid foreign guestworkers is somehow good for us and good for the economy. That’s nonsense. The economy needs good-paying jobs for U.S. workers, not jobs that pay $5 an hour less and get filled by indentured workers recruited from foreign countries.
Sen. Mikulski claims that her efforts to gut the Department of Labor’s H-2B visa program regulations are all about trying to protect the Maryland seafood industry, which she claims is at risk because few Americans are willing to take oyster and crab-shucking jobs for minimum wage. What she doesn’t tell the public is that the H-2B visa program she’s expanding—while simultaneously gutting all of its rules—is used mostly to bring in landscape laborers and gardeners, not crab pickers. Her claim that bringing in one poorly paid gardener creates four jobs in the U.S. economy—a claim concocted by a conservative think tank—is utter baloney. You can find some economist somewhere who will defend almost any claim, but that particular claim is indefensible. Bringing in landscape laborers on H-2B visas who are indentured to their employers and can’t bargain for better wages and working conditions lowers wages for Americans who would otherwise get those jobs, and it leaves more money in the employer’s pocket, but it doesn’t create additional jobs. As EPI has shown, there are no labor shortages in landscaping or other H-2B occupations, but employers want H-2B workers instead of Americans because they can control them and keep them in shocking conditions.
H-2B visas are also used to bring in indentured construction laborers at wages far below prevailing wages. Ask a construction worker in Baltimore what he thinks about seeing what used to be decent-paying construction jobs go to people from thousands of miles away when thousands of Maryland construction workers are still unemployed.
If Sen. Mikulski weren’t so concerned about the corporations itching to bring in another 200,000 guestworkers, she could guarantee an adequate supply of seafood workers by restricting the 66,000 H-2B visas already available to jobs where a real labor shortage has been found—where employers offer higher wages and still can’t find qualified workers—rather than supporting an amendment that drastically cuts wages and labor protections and opening the gates for a race to the bottom.
Labor Department’s common sense fiduciary rule survives the House of Representatives
The Obama administration deserves the nation’s thanks for standing up to the financial industry and its army of lobbyists on a matter of principle as well as practical importance: holding financial advisers accountable to their clients. Secretary of Labor Tom Perez refused to back down from a rule he proposed that would require financial advisers to act in the best interests of their clients. The rule simply requires advisors to provide what most clients probably already think they are receiving: advice about their retirement plans untainted by conflicts of interest. It would prohibit common practices such as steering investments to companies that pay the adviser a commission.
This rule would seem to be a no-brainer, but the industry makes billions of dollars from conflicted advice, and it’s used to getting its way. So the outcome of its efforts to kill the fiduciary rule was uncertain until yesterday, when it was revealed that an amendment to block the fiduciary rule was left out of the House omnibus appropriations bill.