Latina workers have to work 10 months into 2017 to be paid the same as white non-Hispanic men in 2016
November 2nd is Latina Equal Pay Day, the day that marks how long into 2017 a Latina would have to work in order to be paid the same wages as her white male counterpart was paid last year. That’s just over 10 months longer, meaning that Latina workers had to work all of 2016 and then this far—to November 2nd!—into 2017 to get paid the same as white non-Hispanic men did in 2016. Unfortunately, Hispanic women are subject to a double pay gap—an ethnic pay gap and a gender pay gap. On average, Latina workers are paid only 67 cents on the dollar relative to white non-Hispanic men, even after controlling for education, years of experience, and location.
The wage gap between Latina workers and white non-Hispanic male workers persists across the wage distribution, within occupations, and among those with the same amount of education. Figure A below shows wages for Hispanic women and white non-Hispanic men at select points in their respective wage distributions. The 10th percentile Latina wage identifies the wage at which 10 percent of Latina workers earn less while 90 percent of Latina workers earn more. At the 10th percentile, Latina workers are paid $8.53 per hour, or 85 percent of the white male wage at the 10th percentile ($10.03 per hour). This wage gap—15 percent—is the smallest the gap gets, likely due to the wage floor set by the minimum wage. The gap rises to 41 percent at the middle of the wage distribution, and to 55 percent at the 95th percentile. That means that even the best paid Latinas are paid half as much as the best paid white non-Hispanic men.
Latinas are, thus, vastly over-represented in low-wage jobs and relatively under-represented in high-wage jobs. In fact, Latinas’ median wages are just above those of white men’s 10th percentile wage. In other words, nearly half of all Latina workers are paid less than the 10th percentile white male worker. Meanwhile, by comparing the white male median to the 80th percentile Latinas’ wages, you can see that more than half of white men are paid over $20 an hour while fewer than 20 percent of Latinas are. At the high end, only 1-in-20 Latina workers are paid more than white male workers at the 80th percentile.
Yellen can and should help rectify the big mistake Trump will make if he doesn’t reappoint her as chair of the Federal Reserve
Recent reports indicate that President Trump will not re-appoint Janet Yellen as the chair of the Federal Reserve’s Board of Governors (BOG). Instead, the reports indicate that he will appoint a current member of the BOG, Jerome Powell.
Choosing to pass over Yellen is an obvious mistake. Yellen is a world-recognized expert in macroeconomics and has enormous experience as a policymaker. Her performance as Fed chair has been widely and correctly praised. She takes the Fed’s mandate to maximize employment seriously and is data-driven. To be clear, I think she’s made a misstep or two in specific interest rate decisions, but in Yellen, those arguing with economic data have a real chance to be heard. Her recent speech at the Federal Reserve conference in Jackson Hole, Wyoming also provided an admirable signal that she continued to take the Fed’s role as chief financial sector watchdog seriously. This commitment to the Fed’s full employment mandate and its role as regulator of finance is exactly what we should want from a Fed chair. Replacing her in this role is, simply, a dumb mistake.
Jerome Powell has served seriously and well as a member of the BOG in recent years. He has been a consistent defender of the Yellen-charted path of the Fed. He is substantially better than the other non-Yellen candidates floated for the job.
But on the downside, Powell is a lawyer, not an economist (this is not a generic criticism—stay with me). In recent years, he has (correctly) followed the path of Yellen in making monetary policy decisions. If the Trump reshaping of the BOG that is underway surrounds Powell with less-wise voices, one worries that he could be swayed into charting a different path.
Wages rose for the bottom 90 percent in 2016 as those for top 1 percent fell
Newly available wage data show that the annual wages of those in the bottom 90 percent grew 0.5 percent from 2015 to 2016, and did so because wage growth disproportionately favored the vast majority of wage earners. At the same time, the highest earners, those in the top 0.1 percent, saw a 6.3 percent drop in their annual wages. How is that for a change! Annual wages averaged over all workers remained basically unchanged in 2016, but the share of all wages earned by the bottom 90 percent increased in 2016, resulting in improved wages for that group. Who says reducing inequality does not matter!
These are the results of EPI’s updated series on wages by earning group developed from Social Security Administration data. These data, unlike the usual source of our wage analyses (the Current Population Survey) allow us to estimate wage trends for the top 1.0 and top 0.1 percent of earners, as well as those for the bottom 90 percent and other categories among the top 10 percent of earners.
Looking back further, the top 1.0 percent of earners certainly fared well over the 1979 to 2007 period, seeing their annual wages grow by 156.2 percent (Figure A), with those in the top 0.1 percent seeing more than double that wage growth, 362.5 percent (Table 1). In contrast, wages for the bottom 90 percent only grew 16.7 percent in that time. Since the Great Recession, we have seen very modest wage growth across the board, with wages up just 4.0 percent over the nine years from 2007 to 2016. Wages fell furthest among top 1.0 percent of earners during the financial crisis, declining by 15.6 percent from 2007-09, but then recovered fully by 2015. The fall in top 1.0 and top 0.1 annual wages in 2016 leaves both groups with wages that are below pre-recession 2007 levels. Annual wages for the bottom 90 percent, meanwhile, fell slightly after 2007 and didn’t return to their 2007 level until 2014, and then grew roughly 4 percent since then.
Don’t believe the news of a new “top rate” in the forthcoming Republican tax plan: Their enormous “pass-through” loophole makes it largely irrelevant
House Republicans look set to unveil their tax bill on November 1. The “Unified Framework” previewing their plan included only three tax brackets: 12, 25, and 35 percent. But given that all independent analysis of their plan shows it adds enormously to deficits, they have publicly contemplated adding a fourth tax bracket above 35 percent to boost revenue. That top bracket may stay at the current 39.6 rate or be lower than the current rate while remaining above 35 percent. But when the tax plan is unveiled, no one should be tricked by this rate. The rate they choose doesn’t really matter all that much thanks to another loophole they’ve added, which all but ensures that that high income households won’t be paying more than 25 percent. They have disguised the loophole as helping small businesses since it’s targeted at so-called “pass-through income.” But while all small businesses are “pass-throughs”, not all pass-throughs are small businesses—lots of them include wildly rich businesses like hedge funds and private equity firms and boutique law firms. 86 percent of households with pass-through income already pay 25 percent or less—think of these as genuine small businesses. But 49 percent of all pass-through income goes to just the top 1 percent of households. This means that lowering the pass-through rate to 25 percent clearly makes this a tax cut for hedge funds, law firms, and private equity partners, not genuine small businesses. But from that egregiously tilted starting point, the loophole will still get worse, as it leads to rich individuals hiring accountants to re-classify other forms of income as pass-through income.
This means that rich households won’t be paying the top rate on ordinary income, wherever Republicans set it. Instead, their lawyers and accountants will ensure that the income they earn is routed through pass-through businesses like LLCs. This will allow rich households to pay a 25 percent top rate instead of 35 or 39.6.
International evidence shows that low corporate tax rates are not strongly associated with stronger investment
The Trump administration’s Council of Economic Advisers (CEA) released a paper last week arguing that cuts in the statutory corporate tax rate would lead to gains in business investment, productivity, and wages. I noted in a piece released yesterday why this was unlikely to be true.
The key piece of evidence the CEA claimed was “highly visible in the data” and showed the wage-boosting effect of corporate tax cuts was simply a graph that showed faster unweighted wage growth in just two years in a set of “low-tax” countries relative to a set of “high-tax” countries. I noted in my paper yesterday why this was so unconvincing: a serious test of this claim would look at corporate tax rate changes (not levels), would look over a longer time-period than four years, and would not allow three countries with a combined national income that is less than 0.4 percent of American national income to drive the results.
Moving beyond ACA repeal to address real health reform: Negotiating for lower drug prices under the Medicare Drug Price Negotiation Act
The Republican push to repeal the Affordable Care Act (ACA) seems to be on another hiatus, which is good news. At least some members of Congress are spending the time between efforts to gut the ACA pursuing socially useful reforms. For example, Senators Bernie Sanders (I-Vt.) and Patrick Leahy (D-Vt.), and Representatives Elijah Cummings (D-Md.), Lloyd Doggett (D-Texas), and Peter Welch (D-Vt.) have just announced they will introduce a bill that would instruct the Department of Health and Human Services (DHHS) to negotiate with pharmaceutical companies to get the lowest prices possible for drugs paid for by the federal government under Medicare.
The 2003 law that introduced a pharmaceutical benefit to the Medicare program by creating Part D specifically forbade such negotiation, thereby insuring that the program would be far more expensive than it had to be and that it would generate the maximum possible benefits for pharmaceutical corporations rather than the maximum benefits for America’s seniors. Crucially, the proposed bill to allow negotiation comes with real leverage—instructing the secretary to establish a formulary that will make it substantially harder for manufacturers that do not lower prices sufficiently to be reimbursed by Medicare. 1
A 2013 paper by Dean Baker estimates substantial savings from such a program. He finds that the federal government alone would save between $22–54 billion annually. Including the savings to households (who have to pay co-pays for drugs) and state governments would boost these projected savings to $30 to 70 billion annually. This is real money, even in health care terms.
Proposal to change the H-2A program via appropriations would allow agribusiness to fill hundreds of thousands of permanent, year-round jobs with temporary guestworkers
It’s become a time-honored tradition. Every year for almost a decade, members of Congress—spurred by corporate lobbyists who can’t gather enough support from their fellow colleagues for an immigration policy that will lower wages and degrade working conditions for migrant and American workers—use the appropriations process to get what they want. Few people pay close attention to the deliberations about how to fund the government, so members of Congress can quietly tack their bad idea as a “rider” onto an appropriations bill that is folded into an “omnibus” appropriations bill to keep the government running. If the president vetoes the omnibus budget, the government may shut down. This makes a veto unlikely, which allows riders to become law without facing a debate and vote on the merits of it in the House and Senate.
Appropriations riders have become common in U.S. labor migration policy. President Obama’s attempts to improve wages and working conditions for American and migrant workers in the H-2B guestworker program—for jobs in landscaping, forestry, construction and seafood processing, for example—were thwarted again and again through appropriations riders that lowered minimum wage rates for workers and prohibited the Labor Department from enforcing key rules. Senators Grassley (R-IA) and Feinstein (D-CA) took a bipartisan stand against the practice when it happened again this year. This time around, the rules in the H-2A program—which allows agricultural employers and farmers to hire workers from abroad to fill temporary or seasonal jobs lasting for less than one year—may also be modified via an appropriations rider.
There is no annual limit on the number of H-2A workers that can be hired, and H-2A is the fastest-growing U.S. guestworker program, more than doubling over the past decade, with over 200,000 farm jobs certified in in 2017. The vast majority of H-2A workers are employed on crop farms, picking fruits and vegetables.
The House appropriations committee in charge of funding the Department of Homeland Security (DHS) has now added a rider that would allow H-2A guestworkers to be employed in year-round jobs, thus drastically expanding the scope of this program. By allowing year-round employment, employers could seek to bring in guestworkers for jobs on dairy, livestock, and poultry and egg farms, as well as in nurseries and greenhouses and other non-seasonal agricultural occupations. Next week, the Senate appropriations committee is expected to consider its DHS appropriations bill. If this year-round rider becomes law, there would be a major change in immigration policy, converting the H-2A program from a safety valve for farmers who cannot find enough seasonal workers into a program admitting guestworkers to do year-round, permanent jobs. The H-2A program could radically change in purpose and size without ever being debated in either the House or Senate Judiciary Committees which are responsible for crafting immigration legislation.
The Legal Workforce and Agricultural Guestworker Acts would push down wages and labor standards for Americans and immigrants alike
From the perspective of immigration and the labor market, perhaps the two worst pieces of proposed legislation that we’ll see all year will be considered and marked up in the House Judiciary Committee Committee starting today.
One of the bills is the Legal Workforce Act (H.R. 3711), proposed by Rep. Lamar Smith (R-TX); it would mandate that all U.S. employers use E-Verify, an electronic system used to check if new hires are authorized to be employed in the United States. For a number of reasons, E-Verify is not ready for prime time. First, E-Verify’s accuracy rate is simply not good enough. Many authorized workers, including American citizens, would be erroneously flagged as unauthorized if all employers were required to use it. Moreover, Congress has not set up a procedure or process for workers improperly flagged as unauthorized to contest E-Verify findings. Job seekers—including many of the working poor with few resources—would have to visit Social Security Administration and/or Department of Homeland Security offices on their own time and at their own expense to correct an E-Verify error, or else face losing their jobs. And if they lose their job because of a government error, there is no meaningful recourse for them to get reinstated or sue for lost wages.
Furthermore, E-Verify should not be expanded nationwide until the 11 million unauthorized immigrants in the United States—including 8 million unauthorized immigrant workers—are legalized. While E-Verify might make sense someday as a policy option to deter future unauthorized migration, without making necessary improvements or coupling it with a broad legalization, it will do much more harm to low-wage workers than good. Many unauthorized immigrants will begin working off of formal payrolls, making it nearly impossible for them to contribute to payroll taxes and the social safety net, or to file successful compensation claims when they are injured on the job. Expanding E-Verify without legalizing the 8 million employed unauthorized immigrants would leave 5 percent of the labor market even more exploitable and vulnerable to retaliation based on immigration status than they already are, putting downward pressure on labor standards for U.S. workers who are employed alongside unauthorized immigrants.
The Supreme Court has a chance to restore a critical right to women at work
In 2017, the nation has been publically discussing what many women have known privately for years —there is still a vast amount of sexual harassment and gender discrimination in America’s workplaces. The revelations about Harvey Weinstein are the latest example of predatory sexual conduct against women at work, but the list of business leaders engaging in or condoning a culture of sexual harassment at work is staggering: Fox News Chairman Roger Ailes and reporter Bill O’Reilly, Uber CEO Travis Kalanick, Amazon Executive Roy Price, SoFi CEO Mike Cagney, BetterWorks CEO Kris Duggan, Epic Records chairman Antonio “L.A.” Reid … even the current U.S. president has admitted to sexual assault, and referred to his own daughter in sexually explicit and derogatory terms.
Women are also paid less than men for the same work. The disparities are even worse for women of color. Relative to white non-Hispanic men, white non-Hispanic women are paid only 76 cents on the dollar, but Hispanic women are paid only 68 cents on the dollar and black women are paid only 67 cents on the dollar, even after controlling for education, years of experience and location.
So, what can women do in the face of all of this workplace discrimination? We could take our employers to court, seeking justice through a class-action lawsuit. But it turns out, many of us probably can’t anymore. That’s because many of us have signed away our rights to go to court: 56.2 percent of private-sector nonunion employees are subject to mandatory employment arbitration procedures.
Nominating Kevin Warsh as Fed Chair would be the latest way Trump reneged on promises to put workers’ interests over financial elites
A consistent drumbeat in Donald Trump’s campaign for the presidency was a promise that he would stand up for the American working class against financial elites who had rigged policy to enrich themselves, a message that clearly resonated with some voters. He has reneged on this commitment in virtually every area of public policy, including providing better health care coverage than Obamacare, crafting better trade agreements, making sure tax cuts go to the middle class, and standing up for workers’ rights at work.
This month, workers who supported Trump may see another betrayal. It has been reported that Trump may pick Kevin Warsh, who married into a billionaire family, to replace Janet Yellen as the next Chair of the Federal Reserve Board of Governors (BOG). Decisions made by the Fed’s BOG are extraordinarily important for American workers. In recent years, pressure has built for the Fed to begin applying the brake to America’s economic recovery by raising interest rates. The rationale for this is that the Fed must slow growth to tamp down inflationary pressures. Warsh has consistently been on the side advocating for slowing growth to fight inflation. But these inflationary pressures appear nowhere in either wage or price data. And if the Fed hits the brake prematurely, millions of Americans could lose opportunities to work, and tens of millions could see smaller wage increases.
One underappreciated aspect of raising interest rates is that they will put upward pressure on the value of the U.S. dollar, and this stronger dollar will make U.S. exports less competitive on world markets while making foreign imports cheaper to American consumers. This will in turn lead to rising trade deficits which stunt growth in manufacturing employment. Warsh knows about this argument, but he just doesn’t really care.
“I would say that the academy’s view, the broad view of folks at the IMF and economics departments at elite universities, is that if only the dollar were weaker, then somehow we’d be getting this improvement in GDP arithmetic, we’d have an improvement in exports and we’d be getting much closer to trend. That’s not a view I share. My own views are that having a stable currency, now more than ever, provides huge advantages to the U.S. The U.S. with the world’s reserve currency is a privilege, but it is a privilege that we can’t just look to history to remind us of; it’s a privilege we have to earn and continually re-earn. And so it does strike me that those that think that dollar weakness, made possible by QE as one channel for QE, is the way to achieve these vaunted objectives are going to be sorely disappointed.”
What to Watch on Jobs Day: The teacher gap, the hurricanes, and how we know slack remains
Tomorrow, the Bureau of Labor Statistics will release September’s numbers on the state of the labor market. As usual, I’ll be paying close attention to the prime-age employment-to-population ratio (EPOP) and nominal wages, which are two of the best indicators of labor market health. There will likely be discussion of whether or how September’s storms affected the data, and I lay out some those issues below. Last, Friday’s report will give us a chance to examine the “teacher gap”—the gap between local public education employment and what is needed to keep up with growth in the student population.
Falling unemployment
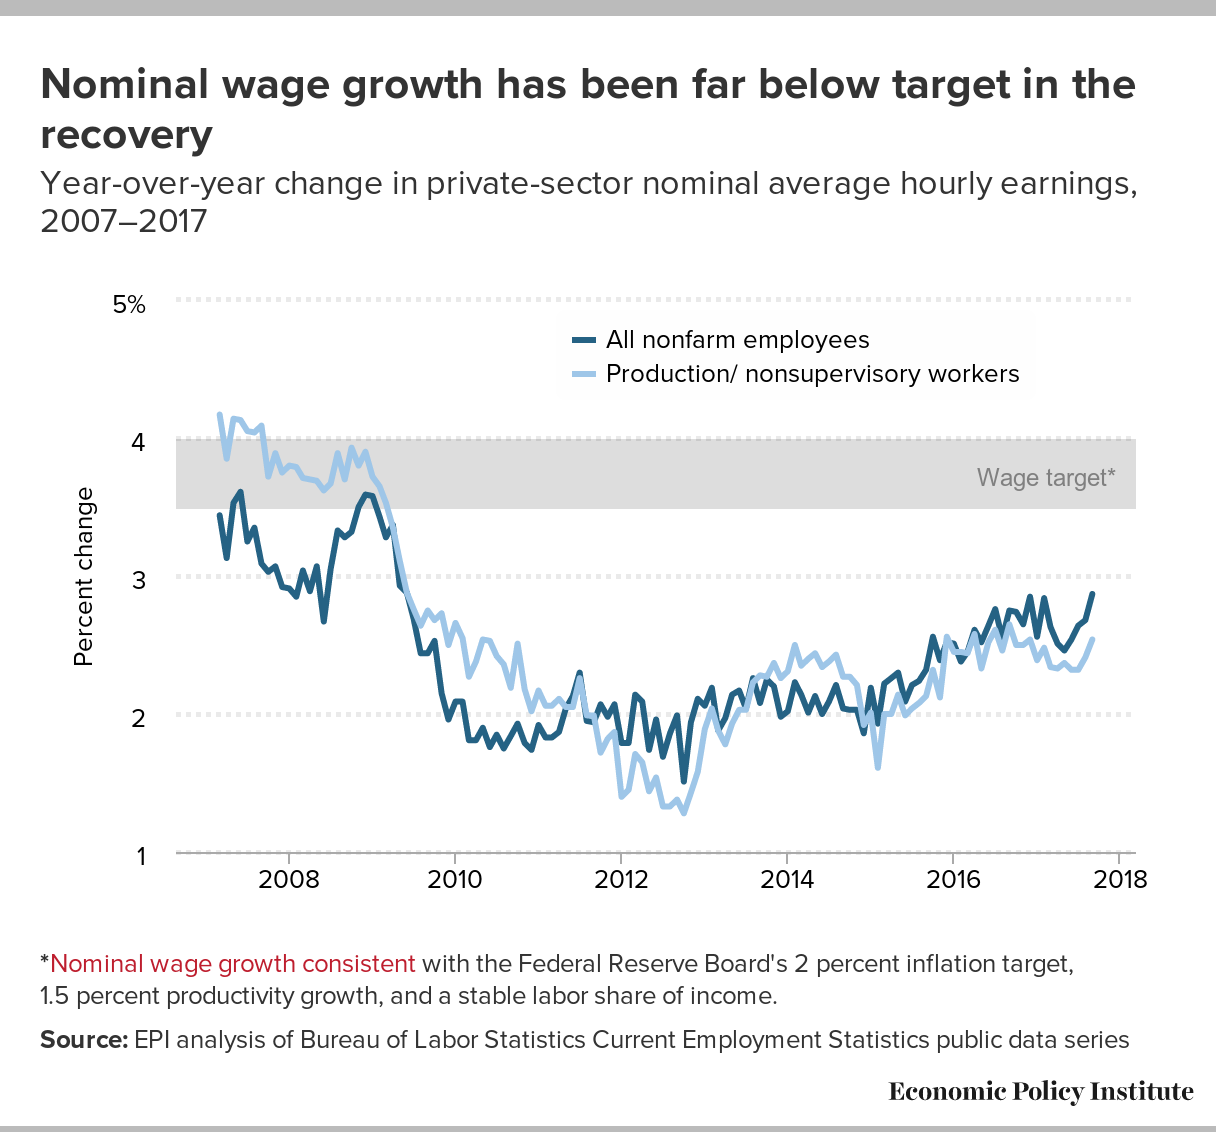
The unemployment rate has fallen steadily over the last seven years, and many have said that the current rate of 4.4 percent means we are back (or at least very close) to full employment—meaning that pushing unemployment any lower would cause inflation to accelerate above the Federal Reserve’s preferred 2 percent target. That is why some observers are calling upon the Fed to continue to raise rates, even though low unemployment has not translated into consistently strong nominal wage growth for workers across the economy.
The unemployment rate is only one indicator of labor market health—and other indicators, like the prime-age employment-to-population ratio (EPOP), suggest an economy with a fair amount of slack. When the economy first hit its current 4.4 percent unemployment rate in April 2017, I noted that, historically, an unemployment rate of 4.4 percent was associated with higher participation and employment in the labor market. In fact, based on the relationship between unemployment rates and prime-age EPOPs in the last two business cycles, the current prime-age EPOP of 78.4 should be 2.3 percentage points higher (80.7 percent). Unfortunately, its current rate is still below its lowest level in the last full business cycle. Nominal wage growth is another key indicator of labor market health. Year-over-year nominal wage growth has remained at 2.5 percent for the last several months, below target levels and where it would be expected in a stronger economy.
All told, the Fed was correct to resist further rate increases in their September meeting. Reaching genuine full employment should be the main concern of the Fed so that workers—white and black, young and old—see the benefits of tight labor markets in their job prospects and wages.
What to watch out for in Trump’s speech on regulation later this morning
President Trump is scheduled to give a speech later this morning about his administration’s regulatory agenda. Given the administration’s statements and actions since Trump took office in January—one of his first actions after taking office was to issue an executive order requiring federal agencies to identify at least two existing regulations to “repeal” when proposing a new regulation—there is little doubt about what any speech by this president on regulation will contain.
Watch for false claims that government regulations cost jobs. The truth is that research on the relationship between employment and regulations generally finds that regulations have a modestly positive, or simply neutral, effect on employment. Though regulations sometimes reduce jobs in one area, they create jobs in another. For example, factories making lead paint shut down after regulations banning lead paint were issued in the late 1970s, but enterprises manufacturing lead-free alternatives arose in their place. And some of the older factories hired people to retool their machinery to begin manufacturing lead-free paint. Importantly, the lack of sensible regulations can do major damage to the economy and cost jobs. One recent, devastating example was the housing bubble, and the financial and economic crisis of 2008 and 2009 that ensued when the bubble burst, resulting in the loss of nearly 9 million jobs. Deregulation and lax enforcement based on the belief that financial markets could “self-regulate” played a major role in this crisis.
Watch for false claims that the costs of regulation outweigh the benefits. The truth is that while there are costs associated with regulations, they tend to be dramatically outweighed by benefits—federal regulations typically provide huge net benefits (benefits minus costs) to society. Federal agencies are required to undertake a cost-benefit analysis when issuing a major rule, and each year the Office of Management and Budget (OMB) reports to Congress on the costs and benefits of federal regulations. In its most recent report, OMB found that during the last administration, from January 21, 2009, to September 20, 2015, the estimated annual net benefits of major federal regulations was between $103 and $393 billion. In other words, these regulations are providing an overall benefit to society of over $100 billion per year.
Janus is the latest attack on workers’ rights to organize and bargain collectively
Today, the U.S. Supreme Court announced that it will hear Janus v. AFSCME, a case that could profoundly affect the ability of public-sector workers to improve their wages and working conditions. The case threatens the right of the majority of workers, through their democratically elected union, to bargain a contract with their public employer that requires every employee covered by the contract to pay their fair share of the costs of negotiating it, administering it, and enforcing it. The Court decided this issue forty years ago in Abood v. Detroit Board of Education and it has been the law of the land since.
Janus is nothing more than the latest attack on workers’ rights to organize and bargain collectively. The Court considered this issue last term in Friedrichs v. California Teachers Association, which resulted in a 4-4 split decision upholding a lower court decision that permits public employee unions to assess fees on non-members who benefit from collective bargaining and union representation and who unions are required to represent. In any other circumstance, it would be outrageous to demand the benefits of a common enterprise without paying one’s fair share. Union representation is no different. Eliminating fair share fees protects people who want to get something for nothing and as a result, starves unions.
It is profoundly undemocratic to elevate the objections of a minority over the democratically determined choices of the majority of workers. This principle is what is at stake in Janus. The decision in this case will determine the future of effective unions, democratic decision making in the workplace, and the preservation of good, middle-class jobs in public employment.
Fixing education inequalities will require fixing broader societal inequities
Every serious education research study concludes with a series of recommendations for further research and implications for education policy. Our recent paper comparing skills gaps among kindergartners an “academic generation” apart is no exception. What is perhaps different is how important we think major changes to policies outside the realm of education are to improving the education system itself.
In Reducing and averting achievement gaps, we show that there was a large gap in preparedness between high and low social class students who began school in the fall of 2010. Furthermore, this gap changed very little over the prior twelve years. And it’s not only a matter of math and reading skills—there are similar gaps in social and emotional skills, which interact with and inform those traditional academic abilities.
We recommend that our counterparts in the field take up questions that arose in the course of conducting this work—like, to what degree do these gaps persist and change as children progress through elementary school and beyond, and what explains the lack of change over the past decade?
The third part of our paper draws on studies of a dozen communities that have embraced a range of strategies to mitigate the impacts of poverty at the district level—including very early support for children and their families, efforts to engage parents as partners in their children’s education, pre-K and improved kindergarten transitions, enriching, whole-child curricula, and wraparound health and nutrition services through the K–12 years. Our case studies highlight how feasible, and successful, this kind of comprehensive enrichment and support can be.
A leopard can’t change its spots: Newest Republican tax framework is what we knew it always would be—tax cuts for the rich.
The framework of the Republican tax plan was released today. In recent months, architects of the plan repeatedly promised that they had no “intention” to release a tax plan that disproportionately cut the taxes of the rich. Some too-credulous writers repeatedly chastised those of who thought that past Republican plans would provide a decent roadmap for the future and pre-emptively warned about all of the creative ways their new plan would likely try to cut the taxes of the rich. So, did Republicans unexpectedly veer and deliver a “middle-class tax cut”?
Nope.
They have once again rolled out a tax plan that is basically the same as all their previous tax plans. Not only does it deliver big tax cuts for the rich, it actually pretty creatively ensures that the crumbs that fall to the middle class will be as small as possible.
The most obvious giveaways to the rich are a reduction in the top individual rate to 35 percent and a cut in the top corporate rate to 20 percent. As we’ve noted before, cuts to corporate rates are cuts to the rich, period.
But these are just the most-obvious tax cuts for the rich.
Contradicting their claims to simplify the tax code, Republicans are adding loopholes. Anybody who studies taxes knows that they are not complicated because of the rates—you look those up in a table after you’ve done the hard part of wrestling with deductions and exclusions. So making 7 rates into 3 does nothing to deal with the complexity of the tax code. But adding further loopholes for the rich and big corporations does exacerbate the code’s complexity and unfairness.
One of their more egregious loopholes is hidden behind rhetoric about helping “small business.” The loophole caps the rate that individuals must pay on “pass-through” income at 25 percent. The first thing to note about this is that there is no small business tax code. Small business owners pay nothing at the business level, but then simply pay taxes on profits they take home on their individual income tax forms, just like you and I. So, the new tax rate does not cut taxes on small businesses. Instead, it cuts individual tax rates on small business owners who currently are in tax brackets above 25 percent. This is an extremely small share of all small business owners (less than 3 percent of all tax units are above the 25 percent tax bracket). So, this carve-out does not serve genuine small businesses, but instead serves only to ensure that rich households won’t have to actually pay the top individual tax rate on money they earn from “small businesses” like hedge funds and law firms, but can instead pay a lower 25 percent.
Supreme Court should uphold working people’s fundamental rights in Murphy Oil
Today, EPI released a new paper by Cornell professor Alexander J.S. Colvin, which shows that more than half of all private sector non-union workers are currently subject to mandatory arbitration agreements—denying them access to the court system to resolve workplace disputes. Colvin also found that 41 percent of employees subject to mandatory arbitration also have waived their right to pursue work-related claims on a collective or class basis. Next week, the Supreme Court will consider whether arbitration agreements that include class and collective action waivers of all work-related claims are prohibited by the National Labor Relations Act (NLRA). The Court is scheduled to hear argument in National Labor Relations Board v. Murphy Oil USA (along with two other cases Ernst & Young LLP v. Morris and Epic Systems v. Lewis) on October 2.
The NLRA guarantees workers the right to stand together for “mutual aid and protection” when seeking to improve their wages and working conditions. Employer interference with this right is prohibited. However, as Colvin’s report shows, employers are increasingly requiring workers to sign arbitration agreements that force them to waive their rights to collective actions and instead handle all workplace disputes as individuals. In practice, that means that even if many workers faced the same type of dispute at work, each individual employee must hire their own lawyer, and must resolve their disputes out of court, behind closed doors, with only their employer and a private arbitrator.
The National Labor Relations Board (NLRB) first reviewed arbitration agreements with class and collective action waivers in D.R. Horton, Inc. (357 NLRB No. 184 (2012)) and found that these forced arbitration agreements interfere with workers’ right to engage in concerted activity for their mutual aid and protection, in violation of the NLRA. Corporate interests and the Trump administration—in a stark departure from the position taken by the Obama administration Department of Justice—are fighting the NLRB. They are focusing their argument on the Federal Arbitration Act (FAA), which requires courts to enforce arbitration agreements, subject to contract defenses. However, the Supreme Court has never enforced an arbitration agreement that violates another federal statute—as the arbitration agreements here violate the NLRA by requiring workers waive their fundamental right to join together to address workplace disputes. Still, that is what corporate interests arguing against the NLRB are asking the Court to do in this case. If they succeed, they will, as the NLRB argues in its brief, be using “private contracts to eviscerate the public rights Congress protected in the NLRA.”
Graham-Cassidy: Maybe the worst Republican health proposal yet
The first plan the House of Representatives put forward to repeal the Affordable Cart Act (ACA) was the American Health Care Act (AHCA). The Congressional Budget Office projected that the AHCA would cost 24 million Americans their health insurance coverage by 2026. An amended version, which passed the House, cut this number to 23 million. Besides inflicting these coverage losses, the AHCA would have cost jobs and increased out-of-pocket costs faced by Americans.
The second plan, the Better Care Reconciliation Act (BCRA) failed narrowly in the Senate. The CBO projected that the BCRA would have cost 22 million Americans their coverage by 2026. On one hand, it may have seemed like progress of some kind to reduce the number thrown off the insurance rolls relative to the AHCA, but the BCRA back-loaded severe cuts to Medicaid beyond the budget window that CBO traditionally examines. This means that in the longer run, the BCRA would have been even more destructive to health security than the House-passed plan. Additionally, unlike the AHCA, the BCRA cut not just the expansions to Medicaid passed under the ACA, but cut deeply into traditional, pre-ACA Medicaid, shifting the burden of paying for health care onto states and/or poor households.
Think of the latest Republican entry, known as Graham-Cassidy, as the BCRA on steroids. After the CBO budget window passes, Graham-Cassidy is not a “repeal-and-replace the ACA” plan. It’s not even a straight “ACA repeal” plan. Instead, it’s a plan that repeals the ACA and cuts Medicaid over and on top of that. It’s, in short, an attempt to rollback not just the ACA, but even the coverage provided by the pre-ACA American health care system.
Just to remind everybody, this pre-ACA coverage system was unraveling at a rapid rate, with roughly 15 million workers losing employer-based coverage between 2000 and 2010.
An evidence-based Fed would hold rates steady in September
The Federal Open Market Committee (FOMC) meets today and tomorrow to determine whether or not to raise interest rates. The FOMC has raised rates three times since December 2016. The evidence arguing that these increases were wise or necessary was thin at best. That rationale for raising interest rates is to rein economic growth that threatens to drive down unemployment so low that workers will be empowered to achieve unsustainably large wage increases. The worry is that such wage increases could push price inflation over the Fed’s target rate.
But the real-world data that exists on every link of this causal chain shows that such worries are baseless. Economic growth in recent quarters is depressingly slow, not fast. Unemployment rates are in the low-end of historical experience, but have been lower (without wage or price inflation) several times in recent years. Other measures of labor market slack show the economy is far from recovered. Wage growth shows little sign of accelerating to levels that would spark wage-price spirals.
The rate increase that happened in June was particularly dispiriting for those hoping the Fed would continue to follow the evidence-based approach largely adhered to under the reign of Janet Yellen as Fed Chair. The economic data going into that meeting gave plenty of reasons why a data-dependent Fed might worry that it was riskier to raise rates too high too soon than to stand pat for a couple of months. Yet the Fed raised rates.
Data since June has been much softer. The Fed’s preferred inflation measure has decelerated significantly, and any upward creep of wage growth has stopped. There just is no case for continuing to raise rates in the face of this data.
While the outcome of any single FOMC meeting is not crucial for the American middle class, what this week’s meeting signals for the commitment of the Fed to genuine full employment is crucial. History has shown that low and middle-wage workers in the United States only get consistent annual wage increases when the economy is near genuine full employment. For example, for two solid years in 1999 and 2000 the unemployment rate averaged 4.1 percent and spent a number of months below 4 percent. And the late 1990s are the only time in recent economic history when wage growth was strong across the wage scale.
2016 ACS shows stubbornly high Native American poverty and different degrees of economic well-being for Asian ethnic groups
Thursday’s release of 2016 American Community Survey (ACS) data allows us to fill in the blanks for race and ethnic groups that were not covered in Tuesday’s Census Bureau report on income, poverty, and health insurance coverage in 2016. ACS is an annual nationwide survey that provides detailed demographic, social, and economic data for smaller populations like Native Americans and the thirteen distinct ethnic groups that make up the Asian American population. For the sake of comparability, in this blog post, the national estimates of median household income and poverty that I refer to are from the ACS.
Between 2015 and 2016, the real median household income for Native Americans increased 1.8 percent to $39,719. This was 69 percent of the national average in 2016 and $1,194 (-2.9 percent) lower than the group’s 2007 pre-recession level. While this data comes from a different source than Tuesday’s data on household income and covers a slightly different survey period, it suggests that Native American median household income is similar to that of black households, but Native American households experienced much slower income growth than blacks over the last year. Despite the income gains, poverty among all Native Americans was virtually unchanged between 2015 and 2016 (from 26.6 to 26.2 percent) and 33.8 percent of Native American children lived in poverty in 2016—the same as in 2015. Both rates are similar to those reported for blacks in the Current Population Survey, though slightly higher. The rate of poverty among Native Americans was nearly double the national average for all people and 1.7 times higher for children.
Median household income for Native Americans and total population (2016 dollars), 2005–2016
| Native Americans | Total population | |
|---|---|---|
| 2005 | $40,959 | $56,850 |
| 2006 | $40,198 | $57,675 |
| 2007 | $40,913 | $58,733 |
| 2008 | $42,157 | $57,879 |
| 2009 | $39,583 | $56,195 |
| 2010 | $38,595 | $55,090 |
| 2011 | $37,554 | $53,875 |
| 2012 | $36,914 | $53,697 |
| 2013 | $37,752 | $53,834 |
| 2014 | $37,745 | $54,404 |
| 2015 | $39,066 | $56,481 |
| 2016 | $39,719 | $57,617 |
Source: Author's analysis of American Community Survey data 2005-2016
Share of people in poverty, Native Americans and total population, 2015 and 2016
| Native Americans | Total population | |
|---|---|---|
| 2015 | 26.6% | 14.7% |
| 2016 | 26.2% | 14.0% |
Source: Author's analysis of American Community Survey data, 2015 and 2016
Share of children in poverty, Native Americans and total population, 2015 and 2016
| Native Americans | Total population | |
|---|---|---|
| 2015 | 33.8% | 20.7% |
| 2016 | 33.8% | 19.5% |
Source: Author's analysis of American Community Survey data, 2012 and 2013
According to my prior analysis of Tuesday’s Census report, Asian Americans were the only group for whom the increase in real median household income between 2015 and 2016 was statistically insignificant, but like non-Hispanic white and black households, still had not recovered their 2007 income level. The 2016 ACS data shows the variance in income across the different Asian ethnic populations, as well as their disparate rates of recovery. In 2016, median household income among Asian ethnic groups ranged from $110,026 for Indians to $38,971 for the Burmese. Indians also had the most income growth since 2007 (13.4 percent), although eight of the fourteen ethnic groups with reported income in 2007 had surpassed their 2007 income level. The wide range of incomes and income growth across Asian ethnic groups are also generally reflected in differences in poverty rates. Three groups—Indians (7.6 percent), Filipinos (6.6 percent) and Japanese (8.0 percent)— had poverty rates of 8 percent or lower, while over one-fourth of the Burmese (29.3 percent) and more than one-fifth of the Bangladeshi (22.6 percent) and Hmong (21.7 percent) populations lived in poverty.
Median household income and share of population in poverty, various Asian populations, 2016
| Share of U.S. Asian population | Poverty rate | Change in poverty | Median household income | Change in income | |||
|---|---|---|---|---|---|---|---|
| 2016 | 2016 | 2007-2016 | 2015-2016 | 2016 | 2007-2016 | 2015-2016 | |
| Bangladeshi | 1.0% | 22.6% | -2.3% | 1.5% | $46,806 | -3.2% | -6.7% |
| Burmese | 0.9% | 29.3% | N/A* | -5.6% | $38,971 | N/A* | -2.8% |
| Cambodian | 1.5% | 16.1% | -4.7% | -3.7% | $58,391 | 0.1% | 4.9% |
| Chinese (except Taiwanese) | 24.2% | 15.6% | 3.6% | 0.1% | $72,827 | -4.3% | 1.7% |
| Filipino | 16.1% | 6.6% | 1.1% | 0.1% | $88,745 | -0.3% | 3.7% |
| Hmong | 1.6% | 21.7% | -4.2% | -2.5% | $57,496 | 9.7% | 6.4% |
| Indian | 21.9% | 7.6% | -0.5% | 0.1% | $110,026 | 13.4% | 4.7% |
| Indonesian | 0.4% | 10.1% | N/A* | -4.7% | $70,539 | N/A* | 24.8% |
| Japanese | 4.5% | 8.0% | -0.5% | -0.3% | $76,175 | -0.3% | 0.9% |
| Korean | 8.2% | 13.1% | -0.5% | -0.3% | $63,677 | 4.3% | -0.2% |
| Laotian | 1.2% | 10.4% | -2.1% | -5.4% | $58,772 | -5.8% | 6.9% |
| Nepalese | 0.9% | 19.6% | N/A* | -1.5% | $50,497 | N/A* | 14.7% |
| Pakistani | 2.6% | 15.4% | 1.7% | 1.6% | $73,157 | 8.5% | -1.1% |
| Taiwanese | 1.0% | 11.9% | 0.3% | -0.8% | $90,221 | 2.9% | -2.0% |
| Thai | 1.2% | 14.7% | 2.2% | -1.3% | $66,976 | 7.6% | 12.1% |
| Vietnamese | 10.3% | 14.0% | 0.6% | -0.5% | $62,958 | 0.6% | 1.9% |
* ACS estimates for Indonesian, Nepalese, and Burmese populations started in 2011.
Note: The margin of error is greater in the ACS estimates for small sub-groups, which might account for the large percent changes in median household income and poverty rates for some Asian populations across years.
Source: Author's analysis of American Community Survey data 2007-2016
Little to no gain in median annual earnings in the 2000s, while significant wage gaps remain
This week, the Census Bureau released its report on incomes, earnings, and poverty rates for 2016. Most analysis paid particular attention to the changes between 2015 and 2016. We wanted to take a deeper look at earnings by race and gender over a longer period of time—since 2000—to paint a more complete picture of what has happened over the last full business cycle (2000-2007) plus the most recent recession and recovery (2007-2016). Since 2000, wages have been generally stagnant, and large gaps persist by race and gender. This longer-term trend might at least partially explain the less-than-rosy outlook many working people seem to have about the economy and their personal economic security—despite ongoing progress toward a full economic recovery.
To a great extent, trends in annual earnings since 2000 resemble the overall wage stagnation we’ve seen since the mid-1970s. (Here, we discuss annual full time earnings, but the long-run trends are consistent with the hourly wage data. For an extensive discussion of hourly wage trends, see The State of American Wages 2016.) Between 2015 and 2016, men’s earnings fell slightly, and are still 0.6 percent below their 2000 level. Meanwhile, women’s earnings increased slightly, and are now 8.5 percent higher than in 2000. Because of these divergent trends, the overall gender wage gap narrowed between 2000 and 2016, though at a slower rate than in the previous two decades.
These patterns in men’s and women’s full-time median annual earnings can be further broken down by race. As you can see in the figure below, real median earnings of full-time workers—male and female, black and white—have been relatively flat since 2000. While all four groups experienced an increase between 2014 and 2015, along with impressive gains across-the-board in 2015, only white women saw their median wages rise between 2015 and 2016. For the most part (except for white women), median wages were flat or falling in the full business cycle of 2000–2007, and have yet to significantly grow past their 2000 levels.
Most families are nearly back to 2007 income levels, but inequality continues to grow in 2016
In recent decades, the vast majority of Americans have experienced disappointing growth in their living standards—despite economic growth that could have easily generated faster gains in their living standards had it been broadly shared. Tuesday’s relatively good news on family income growth over the past year doesn’t make up for this long legacy of rising inequality. This year’s growth is encouraging though not as strong as the previous year in part due to near zero inflation between 2014 and 2015. Unfortunately, the growth in 2016 was also not as broadly shared as it was in 2015. Families in the top fifth of the income distribution grew faster than in 2015, while the bottom 80 percent of families saw slower growth. Another year of decent across-the-board growth should more than fully restore the income losses suffered during the Great Recession for most American families. But, it will barely put a dent in the generation of losses suffered as the incomes for the vast majority lagged far behind the economy’s potential.
As with most economic analysis, meaningful assessments of growth of living standards for the vast majority requires specifying benchmarks against which to measure actual performance. We offer up two reasonable benchmarks. The first is how income growth differs for families at different parts of the income distribution. What we have seen since the last business cycle peak in 2007, before the Great Recession hit, is growing income inequality. This week’s news that income growth in 2016 was positive across the board but does not overturn the general pattern of unequal growth that we have seen since 2007. The second benchmark we posit is income growth relative to that of earlier historical epochs. This benchmark shows that in the three decades following World War II, income growth was both much faster as well as more broadly shared than it has been since 1979.
Poverty declines in most states in 2016
The American Community Survey (ACS) data released today shows that the decline in the national poverty rate was felt in nearly every state. The poverty rate decreased in 43 states and remained unchanged in three states. While there were slight increases in the poverty rate in four states and the District of Columbia, the only statistically significant increase occurred in Vermont. In only two states, Louisiana and Mississippi, was the poverty rate above 20 percent.
Overall, the national poverty rate, as measured by the ACS, fell 0.7 percentage points, to 14.0 percent. Oregon saw the largest decline in its poverty rate (-2.1 percentage points), followed by Arkansas (-1.9 percentage points), Alabama (-1.4 percentage points), Hawaii (-1.3 percentage points), Montana (-1.3 percentage points), and South Carolina (-1.3 percentage points). There were increases in poverty in Vermont (1.7 percentage points), the District of Columbia (1.3 percentage points), Louisiana (0.6 percentage point), Oklahoma (0.2 percentage point), and Wyoming (0.2 percentage point). In Kentucky, Maryland, and West Virginia the rate remained essentially unchanged between 2015 and 2016.
Income growth at the national level and an increase in the number of jobs pulling workers off the sidelines accounted for a drop in the poverty rate in many states. While the federal minimum wage sits at $7.25, many states and localities have increased their minimum wages, which helps lift workers out of poverty. At the same time, government programs including Social Security, refundable tax credits, and Supplemental Nutrition Assistance Program (SNAP) are directly responsible for keeping tens of millions out of poverty across the country. A significant drop in the poverty rate for the second year in a row is a positive sign, but lawmakers should be careful to protect these recent gains with policies that raise wages for working families.
Incomes continued to rise in 2016 in four out of five states
State income data from the American Community Survey (ACS), released today by the Census Bureau, showed that from 2015 to 2016, median household income rose moderately across the country, with all but 7 states and the District of Columbia posting gains in inflation-adjusted household income. The ACS report showed a 2.1 percent increase in inflation-adjusted median household income for the country as a whole—an increase of $1,157 in the annual income of a typical U.S. household. This is similar to, albeit slightly lower than, the 3.2 percent increase in household income that the Census Bureau’s reported earlier this week using data from the Current Population Survey (CPS). The ACS and CPS have different samples and cover a somewhat different timeframe, which can lead to slightly different estimates.
In 2016, median household income ranged from $41,754 in Mississippi (17.5 percent below the median for the country) to $78,945 in Maryland (37.0 percent above the median for the country.)
From 2015 to 2016, the largest percentage gains in household income occurred in Idaho, where the typical household experienced an increase of $2,922 in their annual income—an increase of 6.0 percent. Massachusetts (5.3 percent), Oregon (4.9 percent), North Carolina (4.4 percent), Arkansas (4.3 percent), and New Jersey (4.1 percent) all had increases of 4 percent or more. Twelve other states (Nevada, California, Utah, South Carolina, Washington, Georgia, Rhode Island, Alaska, Maryland, Arizona, Indiana, and Nebraska) experienced income growth that exceeded the national average. Median household income was essentially unchanged over the year, after adjusting for inflation, in 4 states (Hawaii, Oklahoma, Vermont, and Montana), and it declined in 5 states (New Hampshire, Delaware, North Dakota, Wyoming, and Louisiana) and the District of Columbia. The states with the largest percentage declines—North Dakota at 1.1 percent, Wyoming at 1.8 percent, and Louisiana at 2.5 percent—are all states whose economies are heavily dependent upon energy production. Thus, it is likely that these declines are the result of falling energy prices, which slowed economic growth in these states.
Poverty declined modestly in 2016; government programs continued to keep tens of millions out of poverty
From 2015 to 2016, the official poverty rate fell by 0.8 percentage points, as household income rose modestly, albeit unevenly, throughout the income distribution. This was the second year in a row that poverty declined, and at 12.7 percent, the official poverty rate in 2016 was statistically the same as it was in 2007, just prior to the Great Recession. The poverty rate remains significantly higher than the low point of 11.3 percent it reached in 2000.
Since 2010, the U.S. Census Bureau has also released an alternative to the official poverty measure known as the Supplemental Poverty Measure (SPM).1
The SPM corrects many potential deficiencies in the official rate. For one, it constructs a more realistic threshold for incomes families need to live free of poverty, and adjusts that threshold for regional price differences. For another, it includes as income many resources available to poor families, such as Medicare, food stamps, and other in-kind government benefits.
As shown in Figure A, a larger proportion of Americans are in poverty as measured by the SPM than the official measure reports. (Importantly, however, researchers who constructed a longer historical version of the SPM found that it shows greater long-term progress in reducing poverty than the official measure.) In 2016, the SPM declined by 0.6 percentage points to 13.9 percent. Under the SPM, 44.6 million Americans were in poverty last year, compared with 40.7 million Americans under the “official” poverty measure.
New census data show strong 2016 earnings growth across-the-board, with black and Hispanic workers seeing the fastest growth for second consecutive year
Today’s Census Bureau report on income, poverty, and health insurance coverage in 2016 shows that median household incomes for all race and ethnic groups increased between 2015 and 2016. Encouragingly, groups that, by and large, had seen the worst losses in the years since the Great Recession saw the biggest earnings gains for the second consecutive year. Real incomes increased 5.7 percent (from $37,365 to $39,490) among African Americans, 4.3 percent (from $45,719 to $47,675) among Hispanics, 4.2 percent (from $78,143 to $81,431) among Asians, and 2.0 percent (from $63,747 to $65,041) among non-Hispanic whites. The increase in incomes was statistically significant for all groups except Asians, resulting in some improvement of racial and ethnic income gaps between 2015 and 2016. The median black household earned just 61 cents for every dollar of income the white median household earned (up from 59 cents), while the median Hispanic household earned just 73 cents (up from 71 cents). Meanwhile, households headed by persons who are foreign-born saw an increase in incomes of 4.9 percent between 2015 and 2016 (from $52,956 to $55,559), compared to an increase of 3.3 percent (from $57,896 to $59,781) among households with a native-born household head.
Real median household income, by race and ethnicity, 2000–2016
| Year | White | Black | Hispanic | Asian | White-imputed | Black-imputed | Hispanic-imputed | Asian-imputed | White | Black | Hispanic | Asian |
|---|---|---|---|---|---|---|---|---|---|---|---|---|
| 2000 | $63,589 | $41,349 | $46,229 | $65,836 | $42,217 | $44,789 | ||||||
| 2001 | $62,775 | $39,952 | $45,504 | $64,994 | $40,791 | $44,086 | ||||||
| 2002 | $62,583 | $38,732 | $44,173 | $70,224 | $64,795 | $39,545 | $42,797 | $75,793 | ||||
| 2003 | $62,340 | $38,681 | $43,055 | $72,677 | $64,543 | $39,493 | $41,714 | $78,440 | ||||
| 2004 | $62,147 | $38,240 | $43,546 | $73,067 | $64,344 | $39,043 | $42,190 | $78,861 | ||||
| 2005 | $62,427 | $37,933 | $44,213 | $75,101 | $64,633 | $38,729 | $42,836 | $81,056 | ||||
| 2006 | $62,417 | $38,063 | $44,983 | $76,484 | $64,622 | $38,862 | $43,582 | $82,549 | ||||
| 2007 | $63,576 | $39,261 | $44,775 | $76,521 | $65,822 | $40,085 | $43,380 | $82,589 | ||||
| 2008 | $61,906 | $38,147 | $42,266 | $73,173 | $64,093 | $38,947 | $40,949 | $78,975 | ||||
| 2009 | $60,929 | $36,454 | $42,557 | $73,244 | $63,082 | $37,219 | $41,231 | $79,052 | ||||
| 2010 | $59,948 | $35,361 | $41,423 | $70,735 | $62,067 | $36,103 | $40,133 | $76,344 | ||||
| 2011 | $59,130 | $34,392 | $41,216 | $69,499 | $61,220 | $35,113 | $39,932 | $75,011 | ||||
| 2012 | $59,599 | $34,835 | $40,777 | $71,754 | $61,705 | $35,566 | $39,507 | $77,444 | ||||
| 2013 | $60,036 | $35,647 | $42,205 | $69,098 | $62,158 | $36,395 | $40,890 | $74,577 | $62,158 | $36,395 | $40,890 | $74,577 |
| 2014 | $61,095 | $35,891 | $43,082 | $75,331 | ||||||||
| 2015 | $63,747 | $37,365 | $45,719 | $78,143 | ||||||||
| 2016 | 65041 | 39490 | 47675 | 81431 |
Note: CPS ASEC changed its methodology in 2013, hence the break in the series. Solid lines are actual CPS ASEC data; dashed lines denote historical values imputed by applying the new methodology to past income trends. White refers to non-Hispanic whites, black refers to blacks alone, Asian refers to Asians alone, and Hispanic refers to Hispanics of any race. Comparable data are not available prior to 2002 for Asians. Shaded areas denote recessions.
To account for the redesign of the CPS ASEC survey, when the difference between the original data for 2013 and the redesigned data for 2013 is small in magnitude (less than a 1 percent difference) and statistically insignificantly different, data for 2013 is an average of the original and redesigned data. When the difference between them is relatively large in magnitude (1 percent or greater) or statistically significantly different, we display a break in the series and impute the ratio between them to historical data.
Source: EPI analysis of Current Population Survey Annual Social and Economic Supplement Historical Poverty Tables (Table H-5 and H-9)
Based on EPI’s imputed historical income values (see the note under Figure A for an explanation), real median household incomes for all groups, except Hispanics, remain below their 2007 levels. Compared to 2007, 2016, median household incomes are down 1.5 percent (-$595) for African Americans, 1.2 percent (-$781) for non-Hispanic whites and 1.4 percent (-$1,158) for Asians, but increased 9.9 percent ($4,295) for Hispanics. Asian households continue to have the highest median income, despite large income losses in the wake of the recession.
Income growth in 2016 is strong, but not as strong as 2015 and more uneven
Today’s report from the Census Bureau shows strong across-the-board improvements to household incomes in 2016. Household incomes rose 3.2 percent, after an impressive 5.2 percent gain in 2015; non-elderly households saw a similar rise of 3.6 percent this year after gaining 4.6 percent the year before. However, inflation-adjusted full-time annual earnings for men fell slightly in 2016, 0.4 percent, while women working full time saw an earnings increase of 0.7 percent. Men’s earnings are still below their 2007 level (by 1.1 percent points), while women’s earnings are now 2.3 percent above. Better across-the-board earnings growth would have made this year’s income report unambiguously excellent news, much like the 2015 report. This year’s report is mostly encouraging, but wages need to make strong and sustained gains before we can rest easy about how the economy is working for typical American households.
While the gains in household income are not as impressive as the previous year, they nonetheless represent significant improvements. Part of this year’s slowdown in income growth relative to 2015 simply represents a small inflation bounce back. In 2015, plunging energy prices led to essentially zero inflation. In 2016, inflation rebounded to a still-low 1.3 percent. Besides representing a small slowdown in the pace of income growth, this year’s report reminds us that the vast majority of household incomes (when corrected for a break in the data series in 2013) have still not fully recovered from the deep losses suffered in the Great Recession—the bottom 80 percent of households had incomes in 2016 just at or below those of 2007 (while those in the top five percent are now 8.7 percent ahead). One more year of modest growth will likely bring the broad middle class back to pre-recession incomes.
By the Numbers: Income and Poverty, 2016
Jump to statistics on:
• Earnings
• Incomes
• Poverty
• Policy / SPM
This fact sheet provides key numbers from today’s new Census reports, Income and Poverty in the United States: 2016 and The Supplemental Poverty Measure: 2016. Each section has headline statistics from the reports for 2016, as well as comparisons to the previous year, to 2007 (the final year of the economic expansion that preceded the Great Recession), and to 2000 (the historical high point for many of the statistics in these reports.) All dollar values are adjusted for inflation (2016 dollars).
Earnings
Median annual earnings for men working full time fell 0.4 percent, to $51,640, in 2016, although this change was not statistically significant. Men’s earnings are down 1.1 percent since 2007, and are still 0.6 percent lower than they were in 2000.
Median annual earnings for women working full time rose 0.7 percent, to $41,554, in 2016—also statistically no different than women’s earnings in 2015. Women’s earnings are up 2.3 percent since 2007, and are 8.5 percent higher than they were in 2000.
Median annual earnings for men working full time in 2016: $51,640
Change over time:
- 2015–2016: -0.4%
- 2007–2016: -1.1%
- 2000–2016: -0.6%
Median annual earnings for women working full time in 2016: $41,554
Change over time:
- 2015–2016: 0.7%
- 2007–2016: 2.3%
- 2000–2016: 8.5%
Policy Watch: Two more foxes nominated to run hen houses in the Trump administration
Two officials with a history of anti-worker behavior nominated to be worker advocates
Late last week, President Trump announced his nominees to several key positions at the Department of Labor (DOL). Trump nominated Cheryl Stanton to serve as his Wage and Hour Division (WHD) administrator, a position responsible for enforcing our nation’s basic wage protections. Since 2013, Stanton has headed the South Carolina Department of Employment and Workforce, an agency that does not handle wage enforcement. Much of her career has in fact been dedicated to representing employers, not workers, in wage and hour cases. Stanton has also faced her own wage and hour litigation. The Center for Investigative Reporting recently revealed that she was sued last year for failing to pay her house cleaners. If confirmed, Stanton will be tasked with holding employers accountable when they steal workers’ wages. Her history of siding against workers certainly raises the question of how vigorously she will approach this task.
Trump also nominated former coal mining executive David Zatezalo to head the Mine Safety and Health Administration (MSHA). Zatezalo formerly served as chief executive of Rhino Resources, a coal company that had numerous clashes with MSHA officials during the Obama administration. Following the Upper Big Branch mine disaster on April 5, 2010, MSHA stepped up its enforcement efforts, and identified a number of health and safety violations at Zatezalo’s company. In fact, in 2011, MSHA sought a federal court injunction against Zatezalo’s company. If confirmed, Zatezalo will be charged with ensuring safety standards in our nation’s mines. Twelve coal miners have died on the job to date this year.
What to watch for in the 2016 Census data on earnings, incomes, and poverty
Next Tuesday will see the Census Bureau’s annual release of data on earnings, income, poverty, and health insurance coverage for 2016, which will give us a better picture of how working families are—and are not—recovering from the Great Recession. While it may seem a bit odd to still be talking about recovery a full 9 years after the Great Recession started, even as of 2015 median incomes for American households still had not gotten back to their pre-Great Recession peaks. Worse, in the full business cycle of 2000-2007, household incomes never fully recovered to the pre-recession peaks reached in 2000. This means that the slow early-2000s recovery and expansion, combined with the damage done by the Great Recession, has led to nearly two decades of lost income growth for typical American households. Next week’s release will help us chart the progress in clawing back these lost decades—paying particular attention to differences in the recovery across racial and ethnic groups.
Last year, annual earnings and household incomes rose significantly for the first time since 2007. At the same time, the official poverty rate sharply fell. These long-awaited and impressive across-the-board improvements were welcome news after the lengthy downturn. Furthermore, most of these gains were experienced by workers of both genders and workers and households of all races and ethnicities. Despite these significant improvements, by 2015 household incomes had still not fully recovered from the deep losses suffered in the Great Recession. One more year of modest growth should bring the broad middle class back to pre-recession incomes. It is important to note, however, that some of the improvements we saw last year were driven by very low inflation (0.1 percent), mostly due to falling oil prices. While still low by historical standards, inflation was 1.3 percent between 2015 and 2016, which should moderate some of the gains expected in next week’s report.
A NAFTA renegotiation game-changer, until the Trump administration squanders it
Since the beginning of his presidential campaign, Donald Trump has railed against the North American Free Trade Agreement (NAFTA) as being a bad deal for working Americans. He promised that if he was elected, he would renegotiate NAFTA and secure a “much better deal for all Americans.”
So it’s not surprising that earlier this week, the leader of a prosperous country engaged in NAFTA renegotiations demanded changes to increase workers’ leverage, provide a bulwark against downward wage pressure, and prevent his country’s manufacturing sector from being undercut by weak labor standards. But was this leader Donald Trump? Nope. It was Justin Trudeau of Canada.
Even more striking, the reported change that Trudeau’s government has requested to stem downward pressure on Canadian wages is one that beefs up American labor standards. Yes, the low-wage, low-standard country that Trudeau’s government is correctly concerned about as they renegotiate NAFTA is the United States.
The requested change is ambitious: Trudeau’s government wants an end to so-called “right to work” (RTW) laws in American states. This would clearly be good for American workers. In a nutshell, “right to work” laws have nothing to do with helping people find work—instead they simply ban contracts requiring that workers benefiting from labor union representation pay their fair share for this representation. This ban makes it extraordinarily difficult for workers to join together and form unions in RTW states. As a result, these states have substantially fewer union members and less collective bargaining. The economic evidence shows that RTW laws do not boost employment or economic growth, but do suppress wages.