Mobility Needs To Do More Than Stagnate To Indicate U.S. Economy Is Performing for Low- and Moderate-Income Families
A recent paper by Raj Chetty et al found that young adults entering the labor market in recent years (they were children in roughly the 1990s) have the same chances of moving higher (or lower!) in the income distribution than their parents did as did children born in the 1970s. Some have claimed that this study somehow blunts or even overturns any narrative that the U.S. economy has performed poorly for low- and moderate-income households over the past generation. This is reading a judgment into the Chetty et al. results that just is not there.
First, some context on the mobility research literature. The Chetty et al. results are part of a recent resurgence in research about intergenerational mobility—or the likelihood that children will be in a different position in the income distribution than their parents. If where you start on the income scale as a child has a strong influence on where you wind up as an adult, then the degree of economic mobility is low. If, on the other hand, where you start is largely unrelated to where you end, then mobility is high. Chetty et al. find that the probability that a child reaches the top fifth of the income distribution given that their parents are in the bottom fifth of the income distribution is about 9 percent and also now famously found that this probability has not changed much over time.
So, do these Chetty et al. results really overturn the argument that the U.S. economy has performed poorly for low- and moderate-income families over most of the past generation? Not really.
The fundamental evidence underlying this view is simply that income growth for low- and moderate- income households since roughly the late 1970s has lagged far behind both (a) economic growth (or productivity) in the previous three decades and, more importantly, (b) far behind growth in overall average income (see the figure below for some of these over-time comparisons). This growing wedge between income growth for the vast majority and overall average growth rates, one definition of income inequality, is driven by the vastly disproportionate share of income growth accruing to households at the top of distribution. These facts are not challenged by the Chetty et al. results.
Household income for the broad middle class, actual and projected assuming it grew at overall average rate, 1979–2007
| Year | Actual | Projected |
|---|---|---|
| 1979 | $60714 | $60714 |
| 1980 | $58732.64 | $58855.12 |
| 1981 | $58384.47 | $58638.72 |
| 1982 | $57315.84 | $58452.08 |
| 1983 | $56369.14 | $58858.63 |
| 1984 | $59640.16 | $61965.16 |
| 1985 | $59771.71 | $62928.76 |
| 1986 | $61559.08 | $67679.99 |
| 1987 | $60628.18 | $65471.77 |
| 1988 | $61439.69 | $68299.36 |
| 1989 | $62293.88 | $68904.05 |
| 1990 | $62520.53 | $68244.5 |
| 1991 | $61589.53 | $66612.67 |
| 1992 | $61979.35 | $68436.4 |
| 1993 | $62702.69 | $68834.39 |
| 1994 | $63091.57 | $69660.42 |
| 1995 | $65054.18 | $72338.97 |
| 1996 | $65769.78 | $74795.34 |
| 1997 | $66911.57 | $77662.68 |
| 1998 | $69113.65 | $81250.76 |
| 1999 | $70948.66 | $84688.06 |
| 2000 | $70731.34 | $86063.02 |
| 2001 | $70771.07 | $81558.64 |
| 2002 | $69163 | $78177.02 |
| 2003 | $69349.78 | $79418.73 |
| 2004 | $71651.95 | $84002.48 |
| 2005 | $72760.86 | $88145.3 |
| 2006 | $73381.6 | $90812.04 |
| 2007 | $75411.56 | $93276.63 |
Note: Data are for comprehensive income, and cover between the 20th and 80th percentiles of the income distribution.
Source: Authors' analysis of Congressional Budget Office (2012)
Some have argued that we should care more about mobility than inequality because….well I’m not really sure why. Honestly, I think there may be a misunderstanding about the differences between mobility and inequality, mobility being the likelihood of changing relative position in the income distribution and inequality being the distance between various positions in the income distribution. Assuming clarity in definitions, one argument for why some may say we should care more about mobility may run something along the lines that the huge rise in inequality over the past generation was caused by an unleashing of meritocracy and mobility that is simply rewarding talent. So, that the pulling away of the top 1 percent, for instance, was only due to increasing rewards to those few with the highest talent and drive, regardless of where they began in the income distribution as children.
A corollary argument could run that although the income growth of low- and moderate-income families as a group is indeed lagging far behind overall average growth, rising mobility would allow any individual members of this group with talent and motivation to make their way to higher living standards. So in a sense, as long as mobility rose significantly enough in the past generation, it could either explain, or counteract the downsides of, the large increase in inequality. But, what is often forgotten in such discussions is that rising mobility would also mean that some people fall (and in our vastly wide income distribution, could fall far). So, both arguments require a willingness to both allow smart, poor kids to have a chance to be rich at the same rate that rich kids have to fight for everything they get. Either way, explaining or counteracting the large rise in inequality would require a huge increase in mobility.
And this rise in mobility simply hasn’t happened. And the Chetty et al results just reinforce this stagnation. Instead, we have had rising inequality throttling income growth at the bottom with no increased opportunity for individuals at the bottom to jump up the income distribution.
Further, we should note that the Chetty et al. results that have attracted the most attention are about relative mobility—or how far a child rises above or below the percentile rank of their parents in the income distribution. But one could also be as interested in the difference in expected incomes—measuring the gap in incomes for children relative to parents. And here Chetty et al highlight something important: increasing inequality in the United States over the past generation results in a rise in the expected income difference because “a child’s income depends more heavily on her parents’ position in the income distribution today than in the past” (page 3).
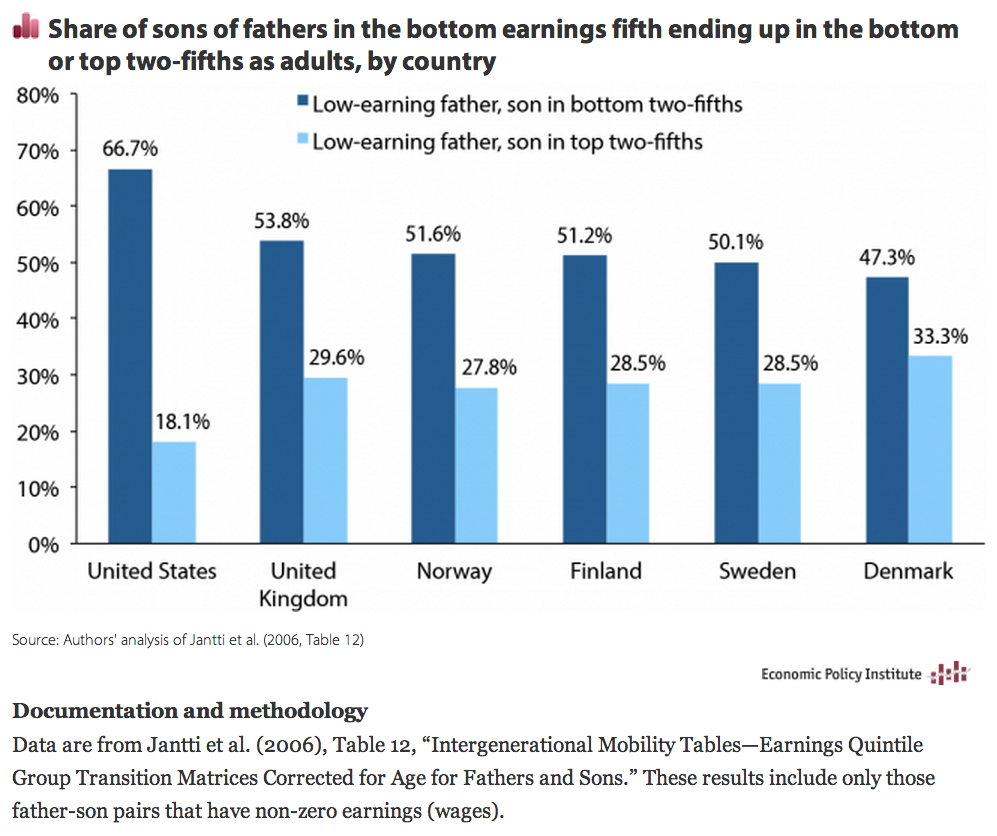
Finally, we should note something important about American mobility not highlighted in the Chetty et al results—it remains low relative to advanced country peers. In fact, your economic position in childhood determines your position in adulthood more in the U.S. than in most other advanced countries. The figure below compares the likelihood that sons will reach different parts of the earning distribution given a low-earning father. So, if you have a low earning father in the United States, then there is a 66.7 percent chance that you’ll be in the bottom two-fifths of the earnings distribution. And, there’s only a 18.1 percent chance that you’ll be in the top two-fifths of the earnings distribution. So, it’s really likely you aren’t going very far from where you started. If we look at our international peers, countries like the UK, Norway, Finland, Sweden, and Denmark, we see that sons of low-earning fathers have a far greater chance of moving up the earnings ladder.
The Chetty et al. results confirm that no rise in mobility has occurred over the last generation to either explain or offset the rise in inequality that has been so damaging for the vast majority. And, the United States remains one of the least mobile economies in the industrial world. It is awfully hard to take much solace from these results.
Enjoyed this post?
Sign up for EPI's newsletter so you never miss our research and insights on ways to make the economy work better for everyone.