I’d be a damn fool to jump off a cliff
When I was a child, there were times when I wanted to go someplace with a group of friends and my mother would say no. I would then argue that I should be allowed to go “because all my friends are going.” As would be expected, my mother would respond with “suppose all your friends jumped off a cliff, would you?” I would always answer no, of course, but I gather that a number of people would answer “I’d be a damned fool not to.” In his Wonkblog post, Washington Post’s Dylan Matthews appears to be the latest to respond this way when he joins the “consensus around the idea that increases in the corporate tax rate hurt growth.” Before getting into why I am not part of the so-called consensus, I need to first correct a glaring error in Matthews’s blog.
The Error
He cites a Tax Notes article (and CRS report) I wrote with Jane Gravelle in 2008. He notes that we concluded: “The traditional concerns about the corporate tax appear valid. While many economists believe that the tax is still needed as a backstop to individual tax collections, it does result in economic distortions.” This conclusion, he claims, contradicts my new analysis of the corporate tax rate. There are two problems with his claim. First, he omitted the next sentence: “These economic distortions, however, have declined substantially over time as corporate rates and shares of output have fallen.”
Second and more importantly, he confuses “economic distortions” with a reduction in output (that is, GDP). We estimate that the economic distortions of the corporate income tax are in the range of 10 percent to 15 percent of corporate income tax revenues. Since corporate tax revenues are about 2 percent of GDP in a typical non-recession year, this is equivalent to about 0.2 percent of GDP—not a significant reduction. But the distortions we talk about in our article do not show up as a reduction in GDP. They result from corporations making different investment decisions because of the corporate income tax. For example, the corporate tax gives firms an incentive to finance new investments with debt rather than equity because interest payments are deductible for tax purposes whereas dividend payments to shareholders are not (we figure this accounts for about half of the economic distortion). Also, firms may invest more in lightly taxed capital equipment and less in more heavily taxed equipment. None of this reduces output. If any of the economic distortion does show up in reduced output, the magnitude is likely considerably less than rounding error.
My problem with the consensus
The likely route in going from corporate tax changes to GDP changes is through investment—the corporate tax affects investment incentives. So what is the proper corporate tax rate to use? The choices are the statutory corporate tax rate, the effective marginal tax rate (the tax that is paid on the return to investment), and the average corporate tax rate (corporate taxes divided by profits). Each has advantages and disadvantages. The best one to use is the effective marginal tax rate because it directly gets at the mechanism through which the corporate tax rate affects economic growth. I use both the statutory corporate tax rate and the effective marginal tax rate in my study. Many of the other studies cited by Matthews use the average tax rate.
My results are best summarized in these two diagrams, which are figures C and D from my report. (For some reason Matthews as well as slate’s Matt Yglesias suggest that my conclusions are based on Figure B.) The diagrams are scatter plots of measures of the corporate tax rate and real GDP growth. For both types of tax rates, there appears to be no relation between the tax rate and economic growth (the straight lines in the diagrams summarize the relationship). In multivariate regression analysis in the appendix to my report, I also find no evidence of a relation between corporate tax rates and economic growth. Note: I am only examining correlation here, not causality, but these results do suggest that reducing the corporate rate may have little impact on economic growth.
Relationship between statutory corporate tax rate and economic growth, 1948–2010
| Real GDP growth | Statutory corporate tax rate (1-year lag) | Trend line |
|---|---|---|
| -3.5 | 35.0 | 40.2 |
| -2.0 | 46.0 | |
| -0.9 | 52.0 | |
| -0.9 | 38.0 | |
| -0.6 | 52.0 | |
| -0.6 | 48.0 | |
| -0.5 | 38.0 | |
| -0.3 | 35.0 | |
| -0.3 | 46.0 | |
| -0.2 | 34.0 | |
| -0.2 | 48.0 | |
| 0.2 | 52.8 | |
| 1.1 | 35.0 | |
| 1.8 | 35.0 | |
| 1.9 | 34.0 | |
| 1.9 | 35.0 | |
| 2.0 | 52.0 | |
| 2.0 | 52.0 | |
| 2.3 | 52.0 | |
| 2.4 | 52.0 | |
| 2.5 | 35.0 | |
| 2.5 | 52.8 | |
| 2.5 | 46.0 | |
| 2.5 | 35.0 | |
| 2.6 | 35.0 | |
| 2.8 | 34.0 | |
| 3.0 | 35.0 | |
| 3.0 | 35.0 | |
| 3.1 | 52.8 | |
| 3.1 | 48.0 | |
| 3.1 | 46.0 | |
| 3.3 | 49.2 | |
| 3.3 | 34.0 | |
| 3.4 | 46.0 | |
| 3.4 | 35.0 | |
| 3.5 | 34.0 | |
| 3.7 | 35.0 | |
| 3.8 | 50.8 | |
| 4.0 | 35.0 | |
| 4.0 | 40.0 | |
| 4.1 | 46.0 | |
| 4.1 | 35.0 | |
| 4.3 | 35.0 | |
| 4.3 | 52.0 | |
| 4.3 | 38.0 | |
| 4.4 | 35.0 | |
| 4.4 | 46.0 | |
| 4.5 | 48.0 | |
| 4.5 | 52.0 | |
| 4.7 | 35.0 | |
| 4.7 | 52.8 | |
| 5.2 | 48.0 | |
| 5.2 | 48.0 | |
| 5.4 | 48.0 | |
| 5.6 | 52.0 | |
| 5.6 | 48.0 | |
| 5.9 | 52.0 | |
| 6.2 | 50.0 | |
| 6.3 | 48.0 | |
| 6.9 | 52.0 | |
| 6.9 | 46.0 | |
| 7.0 | 52.0 | |
| 7.5 | 42.0 | |
| 8.4 | 38.0 | 46.1 |
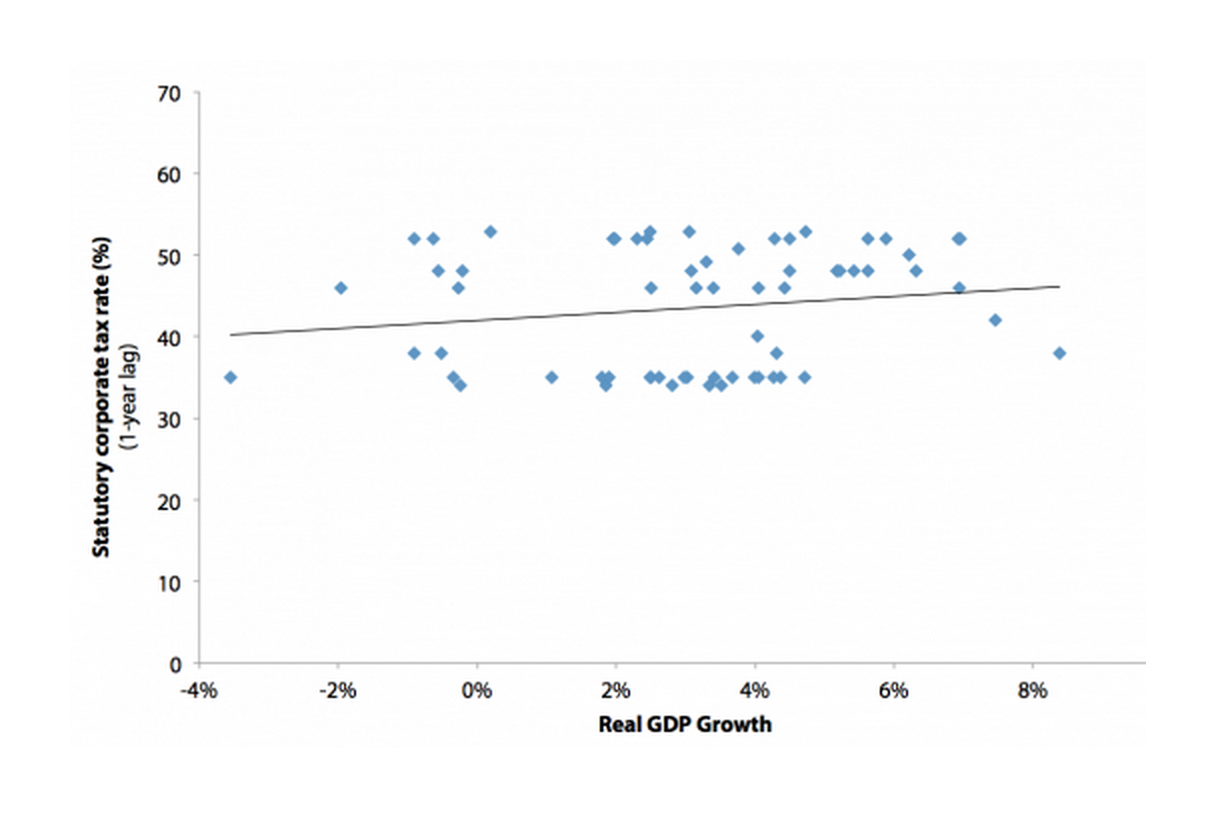
Note: Each dot shows the real GDP growth rate for a particular year and the statutory corporate tax rate from the previous year. The line describes the relation between the two variables.
Source: Author's analysis of Bureau of Economic Analysis National Income and Product Accounts data (Table 1.1.1) and Internal Revenue Service Historical Table 24
Relationship between effective marginal tax rate on capital income and economic growth, 1954–2006
| Real GDP growth | Effective marginal tax rate on capital income (1-year lag) | Trend line |
|---|---|---|
| -2.0% | 38.0% | 37.4% |
| -0.9% | 48.0% | |
| -0.6% | 38.0% | |
| -0.3% | 45.0% | |
| -0.2% | 31.0% | |
| -0.2% | 42.0% | |
| 0.2% | 45.0% | |
| 1.1% | 31.0% | |
| 1.8% | 30.0% | |
| 1.9% | 33.0% | |
| 2.0% | 44.0% | |
| 2.0% | 46.0% | |
| 2.3% | 42.0% | |
| 2.4% | 45.0% | |
| 2.5% | 30.0% | |
| 2.5% | 30.0% | |
| 2.5% | 48.0% | |
| 2.5% | 29.0% | |
| 2.6% | 30.0% | |
| 2.8% | 30.0% | |
| 3.0% | 26.0% | |
| 3.1% | 37.0% | |
| 3.1% | 46.0% | |
| 3.1% | 33.0% | |
| 3.3% | 42.0% | |
| 3.3% | 30.0% | |
| 3.4% | 33.0% | |
| 3.4% | 23.0% | |
| 3.5% | 33.0% | |
| 3.7% | 31.0% | |
| 4.0% | 31.0% | |
| 4.0% | 33.0% | |
| 4.1% | 33.0% | |
| 4.1% | 30.0% | |
| 4.3% | 31.0% | |
| 4.3% | 35.0% | |
| 4.4% | 31.0% | |
| 4.4% | 35.0% | |
| 4.5% | 40.0% | |
| 4.7% | 30.0% | |
| 4.7% | 33.0% | |
| 5.2% | 38.0% | |
| 5.2% | 44.0% | |
| 5.4% | 40.0% | |
| 5.6% | 34.0% | |
| 5.6% | 38.0% | |
| 5.9% | 42.0% | |
| 6.2% | 31.0% | |
| 6.3% | 29.0% | |
| 6.9% | 47.0% | |
| 6.9% | 34.0% | |
| 7.0% | 58.0% | 35.5% |
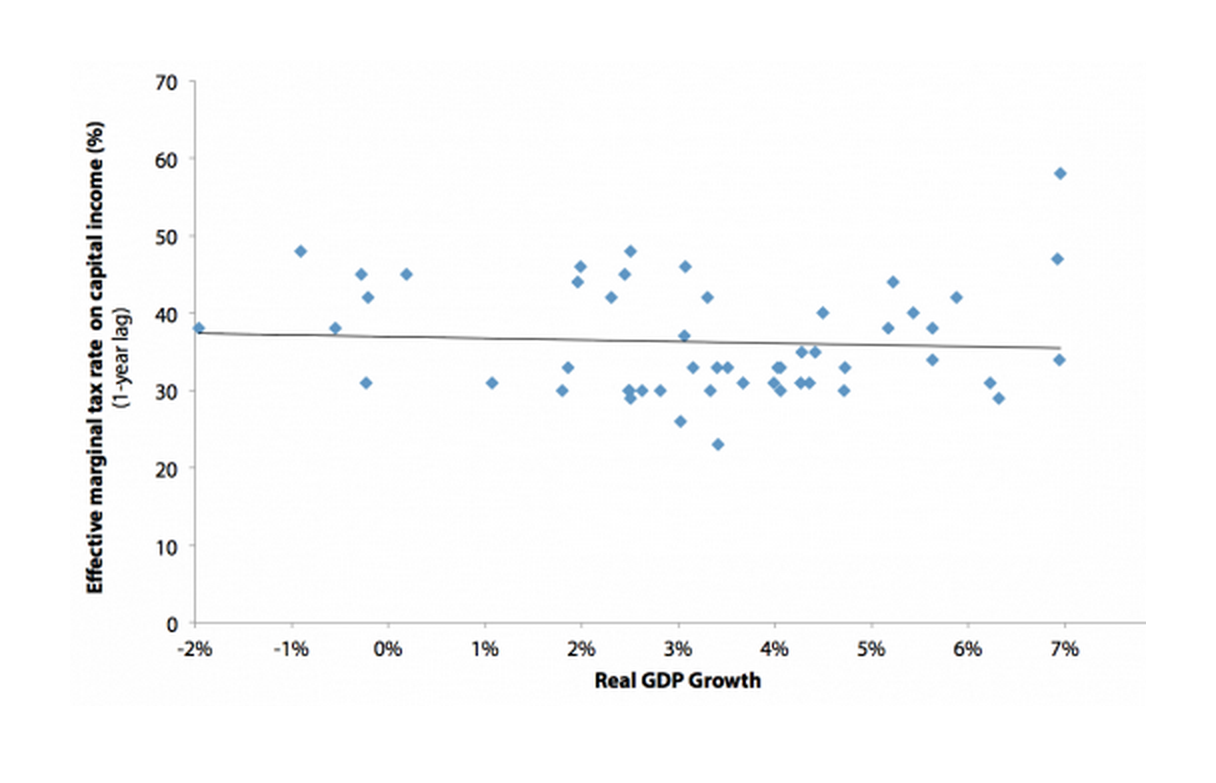
Note: Each dot shows the real GDP growth rate for a particular year and the effective marginal tax rate on capital income from the previous year. The line describes the relation between the two variables.
Source: Author's analysis of Bureau of Economic Analysis National Income and Product Accounts data (Table 1.1.1) and Gravelle (2006)
My analysis is not the only study that finds little association between the corporate tax rate and economic growth. In a CRS report, Jane Gravelle estimates that a 10 percentage point reduction in the corporate income tax rate (from 35 percent to 25 percent) would eventually increase GDP by about 0.2 percent. That is, a 28 percent reduction in the corporate tax rate would lead to a 0.2 percent increase in GDP, likely spread out over a number of years. For example, if the adjustment of GDP took five years, then we would see an annual increase in GDP of 0.04 percent; this might not even be noticeable in an economy that typically grows at 2 to 3 percent per year.
How does this compare to “the consensus?” Let me discuss two of the studies cited by Matthews. The first is a study by the OECD that concludes “corporate taxes can be expected to be the most harmful for growth.” Jane Gravelle told me she examined the implications of the OECD’s results and found in translating their results into output responses that a 10 percentage point reduction in the corporate tax rates eventually increases GDP by 0.2 percent to 0.5 percent—hardly a significant increase of GDP from a very large decrease in the corporate tax rate (and not much different from her own estimate). The consensus appears to be cracking.
The second cited study estimated the effect of the average corporate income tax rate on economic growth. The authors find that reducing the average corporate tax rate by 1 percentage point (from, say, 29 percent to 28 percent) would increase GDP by 0.6 percent within one year. To me this is an implausibly large effect of a tax rate reduction for a tax taking in revenue that is less than 2 percent of GDP—the tail does not wag the dog! Further, I thought Matthews took it as given that the significant impact of lowering corporate taxes was not supposed to be on year-to-year growth.
So, I am not part of Matthews’ claimed “consensus” because (1) there does not appear to be a particularly strong consensus to begin with, and (2) some of the research yields rather implausible results. Given my fear of heights, I believe I will stay away from cliffs.
Enjoyed this post?
Sign up for EPI's newsletter so you never miss our research and insights on ways to make the economy work better for everyone.